Have Humans Visited Mercury?

The MESSENGER spacecraft at Mercury (NASA)

[/caption]
Have astronauts from Earth ever stepped foot on Mercury? No, Mercury has been visited by spacecraft from Earth, but no human has ever gone into orbit around Mercury, let alone stepped on the surface. Just what would it take to visit Mercury?

Humans attempting to visit Mercury would find a similar environment to the Moon. Mercury is airless, so they would need a spacesuit to protect themselves from the vacuum of space. However, the temperatures on Mercury are much greater. During the daytime, the surface of Mercury at the equator rises to 700 Kelvin (427 degrees C). Just for comparison, the surface of the Moon only rises to 390 Kelvin (117 degrees C) during the daytime. So you would need some kind of protection from the intense heat.

But then, nighttime on Mercury dips down to only 100 Kelvin (-173 degrees C) – that’s the same low temperatures you get on the Moon at night. So an astronaut’s spacesuit would need to be able to keep an astronaut warm when they’re in the shade.

The travel time to the Moon is only about 3 days. But the travel time to Mercury is much longer. That’s partly because Mercury is much further away – 10s of millions km. But spacecraft also need to take special trajectories so they can get into orbit around Mercury. All of the spacecraft that have visited Mercury have taken longer than a year to reach the planet. That would be a long, hot journey for astronauts.

Maybe some day in the future humans will visit Mercury, but it hasn’t happened yet.

We have written many stories about Mercury here on Universe Today. Here’s an article about a the discovery that Mercury’s core is liquid. And how Mercury is actually less like the Moon than previously believed.

Want more information on Mercury? Here’s a link to NASA’s MESSENGER Misson Page, and here’s NASA’s Solar System Exploration Guide to Mercury.

We have also recorded a whole episode of Astronomy Cast that’s just about planet Mercury. Listen to it here, Episode 49: Mercury.

Reference:
NASA Star Child: Mercury

Geology of Mercury

Caloris Basin on Mercury

[/caption]
The geology of Mercury is similar to the geology of the Moon; although, Mercury is a much denser planet with a larger liquid iron core. But when you look at photographs of Mercury, it really looks like you’re looking at the Moon. The surface of Mercury is covered by impact craters and lava plains.

Planetary scientists can judge the age of a planet’s surface by the number and size of impact craters. In the case of Mercury, there are enough craters that scientists think that the surface of Mercury is largely unchanged for billions of years. It’s believed that the surface of Mercury is geologically inactive; although, only 55% of the surface has been mapped in enough detail to see its geology.

Mercury formed with the rest of the Solar System about 4.6 billion years ago. After that was a period of heavy bombardment by asteroids and comets; this lasted until 3.8 billion years ago. All of the planets in the Solar System were beaten up during the Late Heavy Bombardment period, but we can still see the scars on Mercury and the Moon. Some of the largest craters in this period were filled with lava from Mercury’s interior. It’s believed that vulcanism on Mercury ended during its first 700 800 million years.

Craters on Mercury can be small bowl-shaped pockets, or huge impact craters hundreds of kilometers across. The largest crater on Mercury is the Caloris Basin, measuring 1,550 km across. There have been about 15 large impact basins identified on Mercury. Just like the Moon, the larger craters have bright rays of material; it’s brighter because it hasn’t been as weathered by impacts.

One of the unique places on Mercury are the regions around its poles. Astronomers using radar telescopes have detected large deposits of water ice around Mercury’s poles. It’s believed these deposits of ice are located in deep craters near Mercury’s poles where they’re always in shadow. It’s possible these were deposited by comet impacts billions of years ago.

We have written many stories about Mercury here on Universe Today. Here’s an article about a the discovery that Mercury’s core is liquid. And how Mercury is actually less like the Moon than previously believed.

Want more information on Mercury? Here’s a link to NASA’s MESSENGER Misson Page, and here’s NASA’s Solar System Exploration Guide to Mercury.

We have also recorded a whole episode of Astronomy Cast that’s just about planet Mercury. Listen to it here, Episode 49: Mercury.

References:
NASA Solar System Exploration: Mercury
NASA: The Solar System’s Big Bang

Solved: Mystery of Gamma Ray Distribution in the Milky Way

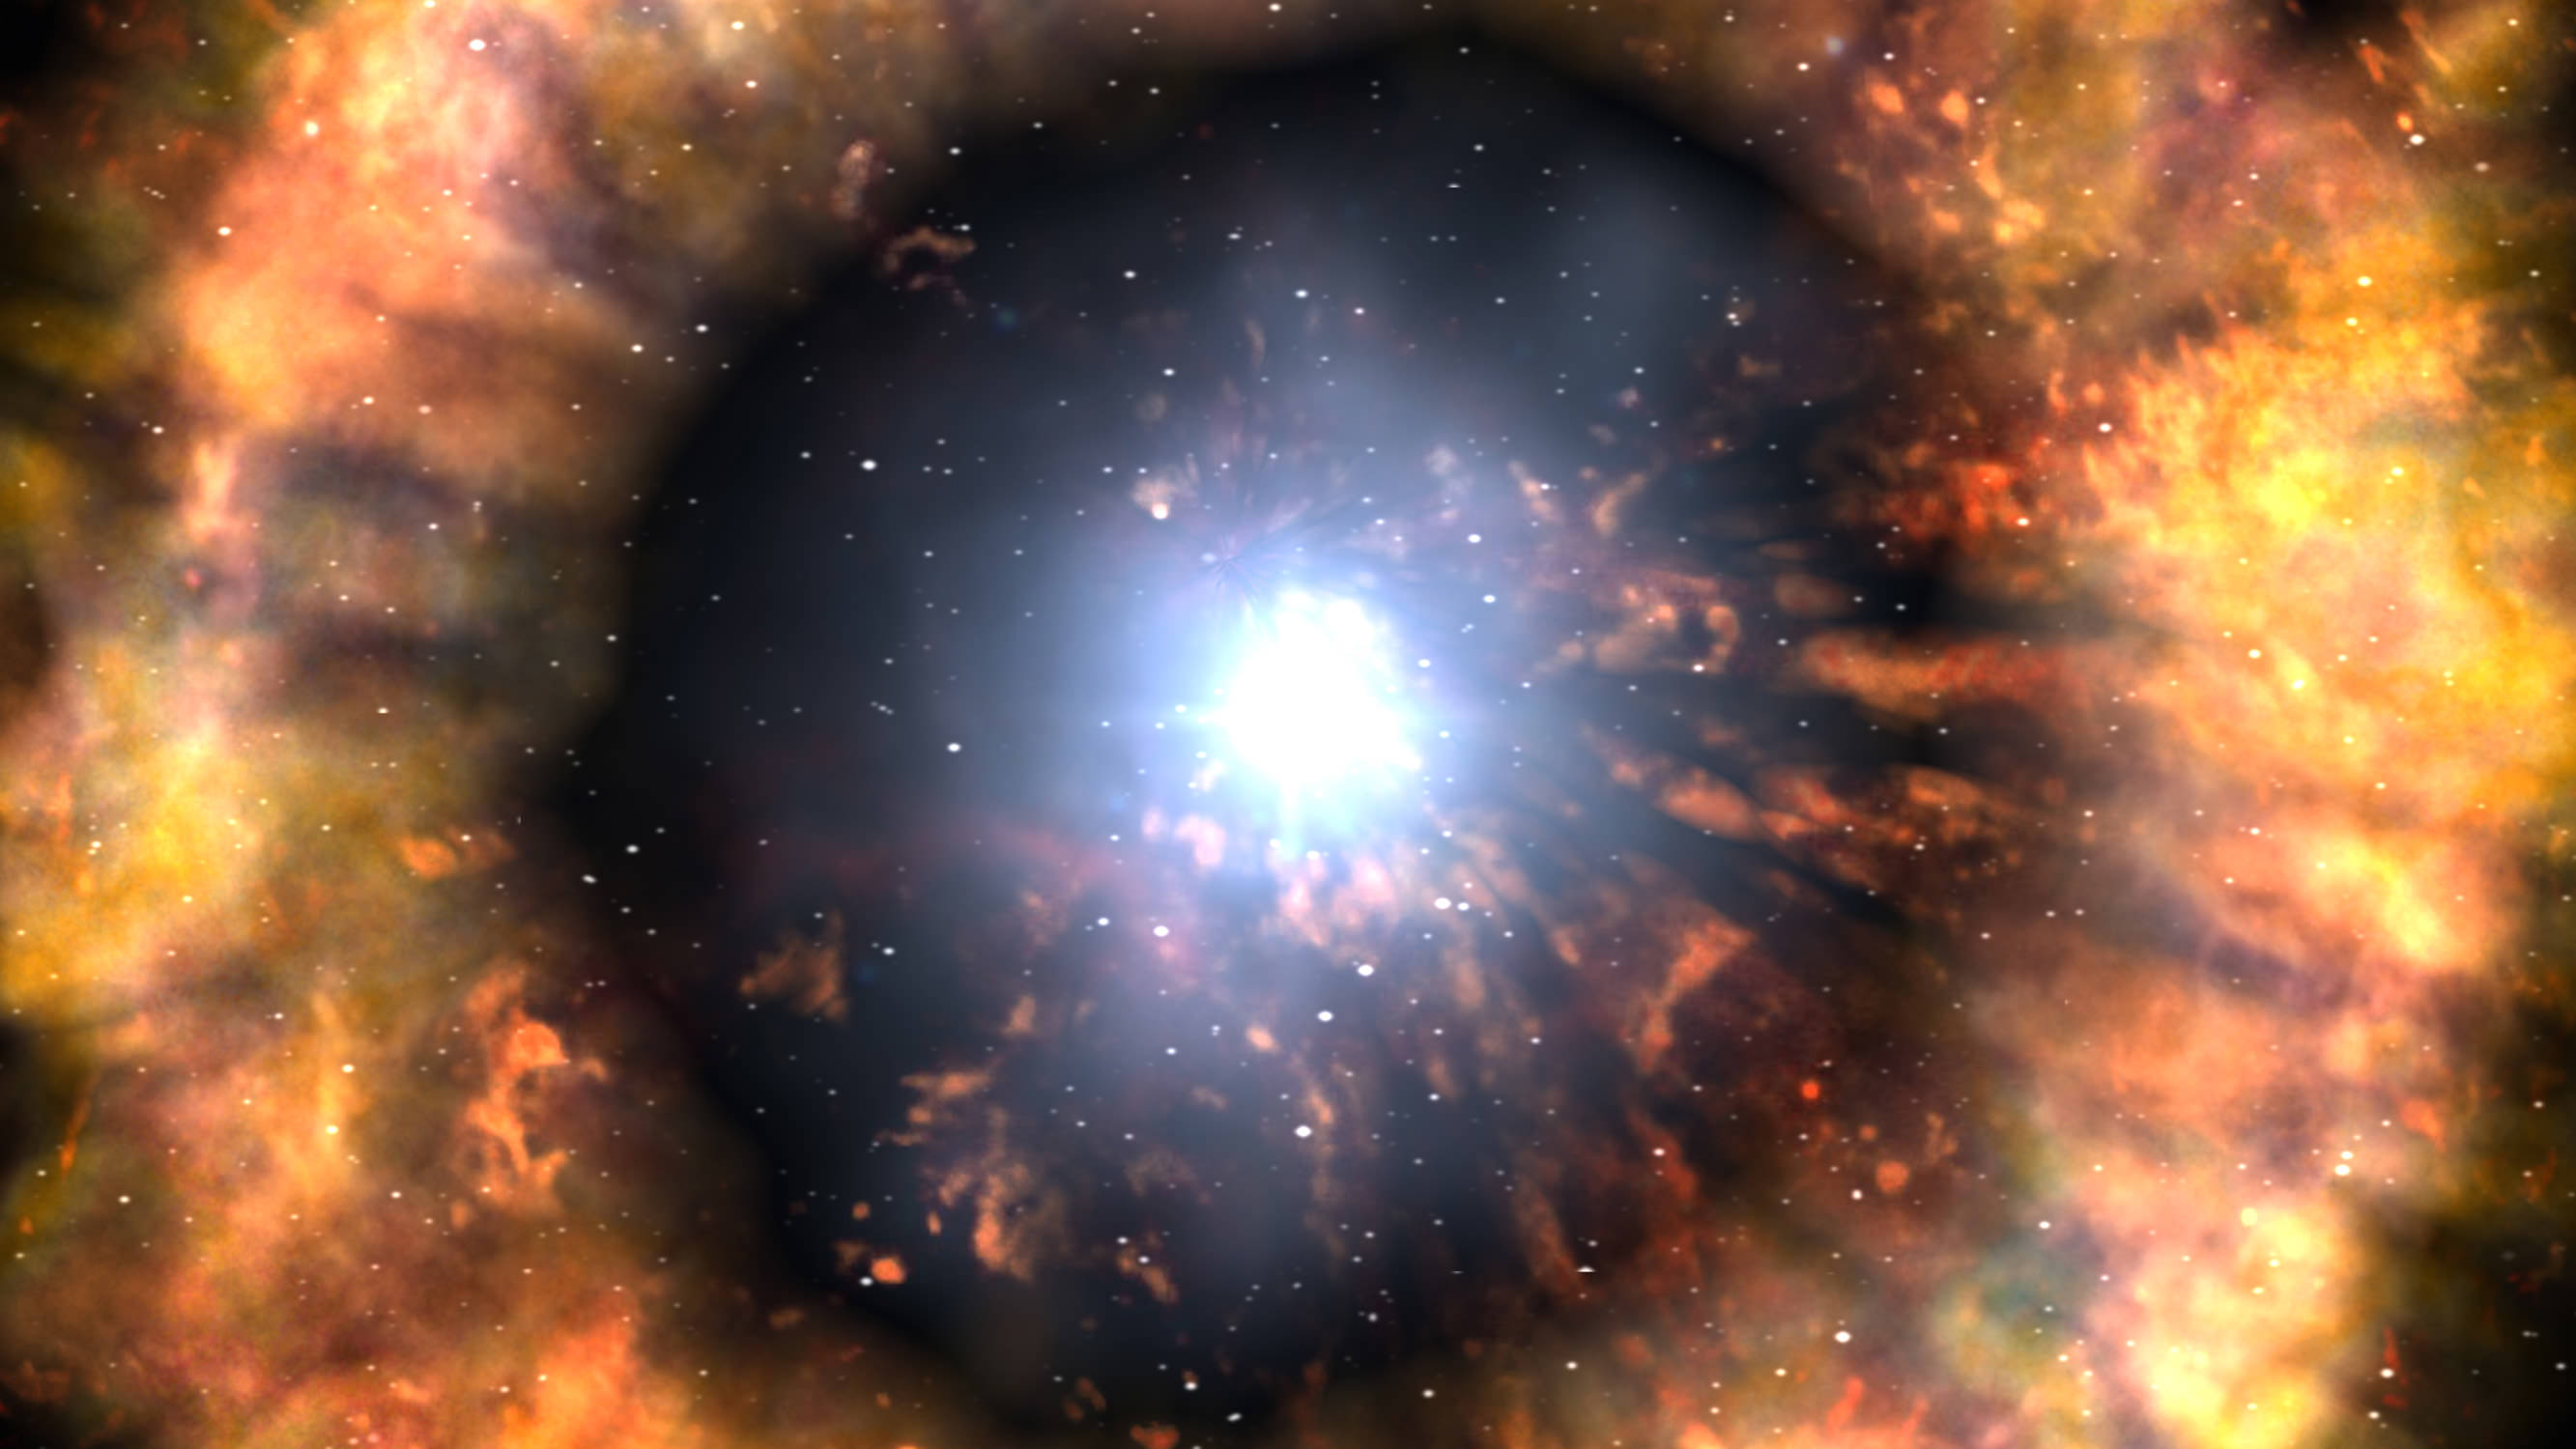
A team of astrophysicists has solved the mystery of the distribution of gamma rays in our Milky Way galaxy.  While some researchers thought the distribution suggested a form of undetectable “dark matter”, the team from the University of California, San Diego, proposed an explanation based on standard physical models of the galaxy.

In two separate scientific papers, the most recent of which appears in the July 10 issue of the journal Physical Review Letters, the astrophysicists show that this distribution of gamma rays can be explained by the way “antimatter positrons” from the radioactive decay of elements, created by massive star explosions in the galaxy, propagate through the galaxy. That means, the scientists said, the observed distribution of gamma rays is not evidence for dark matter.

“There is no great mystery,” said Richard Lingenfelter, a research scientist at UC San Diego’s Center for Astrophysics and Space Sciences who conducted the studies with Richard Rothschild, a research scientist also at UCSD, and James Higdon, a physics professor at the Claremont Colleges. “The observed distribution of gamma rays is in fact quite consistent with the standard picture.”

Over the past five years, gamma ray measurements from the European satellite INTEGRAL have perplexed astronomers, leading some to argue that a “great mystery” existed because the distribution of these gamma rays across different parts of the Milky Way galaxy was not as expected.

To explain the source of this mystery, some astronomers had hypothesized the existence of various forms of dark matter, which astronomers suspect exists—from the unusual gravitational effects on visible matter such as stars and galaxies—but have not yet found.

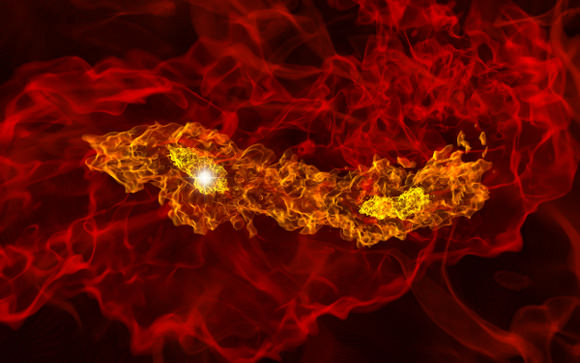
What is known for certain is that our galaxy—and others—are filled with tiny subatomic particles known as positrons, the antimatter counterpart of typical, everyday electrons. When an electron and positron encounter each other in space, the two particles annihilate and their energy is released as gamma rays. That is, the electron and positron disappear and two or three gamma rays appear.

”These positrons are born at nearly the speed of light, and travel thousands of light years before they slow down enough in dense clouds of gas to have a chance of joining with an electron to annihilate in a dance of death,” explains Higdon. “Their slowing down occurs from the drag of other particles during their journey through space. Their journey is also impeded by the many fluctuations in the galactic magnetic field that scatter them back and forth as they move along. All of this must be taken into account in calculating the average distance the positrons would travel from their birthplaces in supernova explosions.”

”Some positrons head towards the center of the Galaxy, some towards the outer reaches of the Milky Way known as the galactic halo, and some are caught in the spiral arms,” said Rothschild. “While calculating this in detail is still far beyond the fastest supercomputers, we were able to use what we know about how electrons travel throughout the solar system and what can be inferred about their travel elsewhere to estimate how their anti-matter counterparts permeate the galaxy.”

The scientists calculated that most of the gamma rays should be concentrated in the inner regions of the galaxy, just as was observed by the satellite data, the team reported in a paper published last month in the Astrophysical Journal.

“The observed distribution of gamma rays is consistent with the standard picture where the source of positrons is the radioactive decay of isotopes of nickel, titanium and aluminum produced in supernova explosions of stars more massive than the Sun,” said Rothschild.

In their companion paper in this week’s issue of Physical Review Letters, the scientists point out that a basic assumption of one of the more exotic explanations for the purported mystery—dark matter decays or annihilations—is flawed, because it assumes that the positrons annihilate very close to the exploding stars from which they originated.

“We clearly demonstrated this was not the case, and that the distribution of the gamma rays observed by the gamma ray satellite was not a detection or indication of a ‘dark matter signal’,” said Lingenfelter.

Source: UC San Diego

This Week’s Where In The Universe Challenge


It’s time once again for another Where In The Universe Challenge. Test your visual knowledge of the cosmos by naming where in the Universe this image was taken and give yourself extra points if you can name the spacecraft responsible for this picture. Post your guesses in the comments section, and check back later at this same post to find the answer. To make this challenge fun for everyone, please don’t include links or extensive explanations with your answer. Good luck!

UPDATE: The answer has now been posted below — don’t peek if you haven’t guessed yet!

This is Saturn’s small moon Janus, taken by the Cassini spacecraft. Here, Janus is illuminated by light from both the sun and Saturn.

This view looks toward the south pole of Janus (179 kilometers, or 111 miles across) which lies on the terminator just below the center of the image. Brightly lit terrain seen on the right is on the leading hemisphere of Janus. Light reflected off Saturn dimly lights the Saturn-facing side of Janus on the top left of the image.

Check out the Cassini website for more information about this image.

Check back next week for another WITU challenge!

Beautiful Chaos

Stephen's Quintet. X-ray (NASA/CXC/CfA/E.O'Sullivan); Optical (Canada-France-Hawaii-Telescope/Coelum)

[/caption]
Can you imagine living in this region of space? Just think of the beautiful views you’d have in the sky – that is, if you survived the chaos as one galaxy is passing through the core of three other galaxies at ridiculous (ludicrous?) speeds (3.2 million km per hour / 2 million miles per hour) generating a shock wave of gas and X-rays.

This is Stephen’s Quintet, A compact group of galaxies, discovered about 130 years ago, located about 280 million light years from Earth. The curved, light blue ridge running down the center of the image shows X-ray data from the Chandra X-ray Observatory. The galaxy in the middle, NGC 7318b is passing through the core of the other galaxies at high speed and is thought to be causing the ridge of X-ray emission by generating a shock wave that heats the gas. The most prominent galaxy in front (NGC 7320) is actually far away from the other galaxies and is not part of the group.

(See the Chandra webpage for a roll-over labeled version)

Additional heating by supernova explosions and stellar winds has also probably taken place in Stephan’s Quintet. A larger halo of X-ray emission – not shown here – detected by ESA’s XMM-Newton could be evidence of shock-heating by previous collisions between galaxies in this group. Some of the X-ray emission is likely also caused by binary systems containing massive stars that are losing material to neutron stars or black holes.

Stephan’s Quintet provides a rare opportunity to observe a galaxy group in the process of evolving from an X-ray faint system dominated by spiral galaxies to a more developed system dominated by elliptical galaxies and bright X-ray emission. Being able to witness the dramatic effect of collisions in causing this evolution is important for increasing our understanding of the origins of the hot, X-ray bright halos of gas in groups of galaxies.

Source: Chandra

Earliest Stars Came in Pairs, New Simulation Shows

Image Credit: Science/AAAS

[/caption]

Most stars exist in binary pairs today — and new research indicates that may have been true for a very long time. This simulation of a primordial star forming region about 200 million years after the Big Bang shows two pre-stellar cores of more than five times the mass of the sun each. The cores formed at a separation of 800 times the distance from the Earth to the Sun, and are expected to evolve into a binary star system.

Most previous simulations of the early universe, in which clouds of primordial gas collapsed to form the first luminous objects, suggest that early stars formed separately from each other.

Lead author Matthew Turk, of Stanford University, and his colleagues performed computer simulations during which a central clump of primordial material about 50 times the mass of the Sun breaks into two cores with a mass ratio of two to one. Both are able to cool and plump up, by accreting matter from the surrounding cold gas reservoir, “and will likely form a binary star system,” the authors write.

The findings may also have implications for detecting both gravity waves — disturbances predicted by general relativity, which haven’t yet been detected directly — and the ultra-energetic explosions known as gamma ray bursts, since binary systems are thought to be at the origins of both of these phenomena.

The results are in this week’s issue of the journal Science and appear online today at the Science Express website.

Image credit:  © Science/AAAS

Source: Science, via Eurekalert.

Help Find the Mars Polar Lander!

Search this image for the Mars polar lander! Credit: NASA/JPL/UofA. Click for larger version.

[/caption]
The Mars Polar Lander was supposed to be a mission to the Red Planet’s south polar region to study the climate, weather and the ever-changing polar cap. But the spacecraft went missing in December of 1999 after entering Mars atmosphere, and its disappearance has been a mystery. Attempts at finding the presumably crashed lander using images from the Mars Global Surveyor have been unsuccessful. But now we have the Mars Reconnaissance Orbiter and its powerful HiRISE Camera. A new campaign has begun to try and find the Mars Polar Lander, and the best thing about it is that you can help!

UPDATE: I’ve been contacted by several people wondering what they should do if they think they find something in the image. The HiRISE blog has instructions: contact the HiRISE folks with this form, or add to the comments in a previous HiRISE blog post.

HiRISE has been successful in imaging missions like the Mars Exploration Rovers and the Phoenix lander – as the location of those spacecrafts have been known. But now’s the chance to use HiRISE’s eyes to look for an object whose location is unknown.

“This HiRISE image is one of a sequence searching for either the parachute or the crumpled lander on the ground,” say the folks on the HiRISE website. “However, we expect the debris from this mission to be covered with dust and ice, making it a challenge to identify them. The more eyes that search these images the better, so try your luck!”

Click the image for a larger version, or find even larger versions on the HiRISE website.

The terrain seen here appears to be composed of alternating layers of clean and dust-laden ice. Most of the surface is covered with patches of small channels. It is thought that these have been carved by vaporized ice. On Mars, the ice goes straight to a gas (a process called “sublimation”) rather than first melting. So, as the ice heats in the spring and summer, gas is generated and flows under the remaining ice. This flowing gas can move dust and slowly carve a small channels.

The lander was to touch down on the southern polar layered terrain, between 73°S and 76°S in the region, Planum Australe less than 1,000 km from the south pole, near the edge of the carbon dioxide ice cap in Mars’ late southern spring.

So what could have happened to the spacecraft? It has been speculated that either the thrusters failed as it began to land. Or perhaps the landing sequence failed entirely, and when the legs were deployed the software accidently reported that the lander was on the ground, cutting the parachute while the lander was actually hundreds of feet in the air. Bummer.

But the only way to know for sure it to find the remains of the spacecraft. So let’s get searching! And watch for more images from HiRISE to look for the lost MPL.

Source: HiRISE

Observing Alert! Outburst of Dwarf Nova WX Ceti


According to AAVSO Special Notice #161 posted today by M. Templeton, dwarf nova WX Ceti is now in outburst and has been recorded at magnitude 12.62. There’s a lot to be learned about this cool little star…

Hazel McGee (Guildford, UK) has reported that the infrequently outbursting dwarf nova WX Ceti is in outburst. WX Ceti was recorded at a magnitude of 12.62 (clear filter, V zeropoint) on 2009 July 8.44375 (JD 2455020.94375). The observation was obtained remotely with GRAS-001 (New Mexico).

Follow-up observations of this outburst are urgently requested, including both visual estimates and instrumental photometry. CCD time-series observations capable of detecting possible superhumps
are particularly important. Please obtain the highest signal-to-noise data you can with the shortest exposures possible; filtered observations are not required. Please report all observations to the AAVSO with the name “WX CET”. Information on submitting observations to the AAVSO may be found at here and additional charts are available here.

WX Ceti is located at the following (J2000) coordinates: RA: 01 17 04.20 , Dec: -17 56 23.0

WX_cetSo what kind of star is WX Ceti? Try a SU UMa type dwarf nova… but one with a superoutburst cycle that happens about every 880 days. But, WX is a bit different. It can have short eruptions every 200 days…. and apparently the outburst cycle length has doubled over the last 70 years. “According to our numerical simulations, this can be explained in the context of the disc instability model by assuming enhanced mass transfer during outburst and a decreasing mean mass transfer rate during the last decades. Using the data available, we refine the orbital period of WX Ceti to 0.0582610 ± 0.0000002 days and interpret the orbital hump found in quiescence as emission from the hot spot. During two recent superoutbursts in July 2001 and December 2004 we observed superhumps, with a rather large positive period derivative of Ps/Ps = 1.6 x 10⁻⁴, present only during the first 9 days of a superoutburst. Afterwards and during decline from the “plateau” phase, a constant superhump period of about 0.05922 days was observed. Late superhumps are present for at least 12 days after the decline from the “plateau”, with a period of 0.05927 days. We find this phenomenology difficult to interpret in the context of the standard explanation for superhumps, i.e. the thermal tidal instability model.” says C. Sterken (et al), “We interpret the long-term light curve of WX Cet as the result of a significantly decreasing mean mass transfer rate. Highlighting the complexity of the observed superhump light curves, we emphasise the importance of WX Ceti for a proper understanding of the SU UMa star outburst physics and the evolution of ultra-short period cataclysmic variables.”

What could cause this kind of behavior? Try a nearby white dwarf star. “We find that the accreting white dwarfs in VY Aquari and WX Ceti are remarkably similar. Both systems contain white dwarfs with Teff = 13,00013,500 K, a rotation velocity below 8001200 km s-1, and subsolar metallicity. Both white dwarfs are better fitted with a two-temperature white dwarf plus accretion belt model in which part of the white dwarf is cooler and “slowly” rotating and part is hotter, smaller, and spinning at the Keplerian speed.” says Edward M. Sion, “The occurrence of more outbursts on shorter timescales makes it likely that the accretion rates in VY Aqr and WX Ceti are somewhat higher than in the other systems. This possibility is supported by an increased amount of emission compared with the lowest accretion rate systems in our program. Moreover, there is less prominent absorption around the Balmer lines than in the other systems. The apparent presence of an accretion belt in VY Aqr and WX Ceti may be a direct result of the higher accretion. Surprisingly, the rotational velocities of VY Aqr and WX Ceti fall in the same range as the white dwarfs in LL And, SW UMa, HV Vir, BC UMa, EF Peg, EG Cnc, and other ultrashort-period, high outburst amplitude dwarf novae, viz., 200 to 500 km s-1. The abundances of photospheric metals at subsolar values for VY Aqr and WX Ceti, taken at face value, also appear to be a hallmark of the entire group. The evolutionary significance of the chemical abundances as well as the fate of the accreted angular momentum remain to be explained.”

Good luck and clear skies!

Finder chart courtesy of AAVSO, field image Palomar Observatory, courtesy of Caltech.

New Technique Finds Farthest Supernovae

This artist’s impression of a supernova shows the layers of gas ejected prior to the final deathly explosion of a massive star. Credit: NASA/Swift/Skyworks Digital/Dana Berry

[/caption]
Two of the farthest supernovae ever detected have been found by using a new technique that could help find other dying stars at the edge of the universe. The two cosmic blasts occurred 11 billion years ago. The next-farthest large supernova known occurred about 6 billion years ago. Jeff Cooke from the University of California Irvine said this new method has the potential to allow astronomers to study some of the very first supernovae and will advance the understanding of how galaxies form, how they change over time and how Earth came to be.

A supernova occurs when a massive star (more than eight times the mass of the sun) dies in a powerful, bright explosion. Cooke studies larger stars (50 to 100 times the mass of the sun) that blow part of their mass into their surroundings before they die. When they finally explode, the nearby matter glows brightly for years.

Typically, cosmologists find supernovae by comparing pictures taken at different times of the same swath of sky and looking for changes. Any new light could indicate a supernova.

Cooke built upon this idea. He blended pictures taken over the course of a year, then compared them with image compilations from other years.

“If you stack all of those images into one big pile, then you can reach deeper and see fainter objects,” Cooke said. “It’s like in photography when you open the shutter for a long time. You’ll collect more light with a longer exposure.”

This image shows the host galaxy containing one of the newly discovered supernovae.  Comparing the images shows how the galaxy visibly brightens in 2004 and then returns to normal. This suggested that in 2003 the supernova was not detected; it appeared in 2004 and was beginning to fade in 2005.  The last frame subtracts the images from the years that the supernova was not detected as well as the galaxy’s light to reveal only the supernova. Credit: Jeff Cooke/CFHT
This image shows the host galaxy containing one of the newly discovered supernovae. Comparing the images shows how the galaxy visibly brightens in 2004 and then returns to normal. This suggested that in 2003 the supernova was not detected; it appeared in 2004 and was beginning to fade in 2005. The last frame subtracts the images from the years that the supernova was not detected as well as the galaxy’s light to reveal only the supernova. Credit: Jeff Cooke/CFHT

This image shows the host galaxy containing one of the newly discovered supernovae. Comparing the images shows how the galaxy visibly brightens in 2004 and then returns to normal. This suggested that in 2003 the supernova was not detected; it appeared in 2004 and was beginning to fade in 2005. The last frame subtracts the images from the years that the supernova was not detected as well as the galaxy’s light to reveal only the supernova. Credit: Jeff Cooke/CFHT

Doing this with images from the Cooke found four objects that appeared to be supernovae. He used a Keck telescope to look more closely at the spectrum of light each object emitted and confirmed they were indeed supernovae.

“The universe is about 13.7 billion years old, so really we are seeing some of the first stars ever formed,” Cooke said.

Cooke’s paper is published in the journal Nature on July 9.

Source: UC-Irvine

Going to Mars Together

Mars. Credit: NASA

[/caption]
From the “this makes complete sense” department: NASA and ESA have established an initiative to make future explorations of Mars a joint venture. The ESA Director of Science and Robotic Exploration, David Southwood, met with NASA’s Associate Administrator for Science, Ed Weiler at the end of June and created the Mars Exploration Joint Initiative (MEJI) that will provide a framework for the two agencies to define and implement their scientific, programmatic and technological goals at Mars. The initiative includes launch opportunities in 2016, 2018 and 2020, with landers and orbiters conducting astrobiological, geological, geophysical and other high-priority investigations, leading up to a sample return mission in the 2020s.

Both NASA and ESA have been reassessing their Mars exploration programs, and Weiller revealed at a press conference last year (when it was announced that the Mars Science Laboratory would be delayed) that NASA and ESA would seek to work together. But now it is official.

The two space agencies will be working together to plan future missions. A joint architecture review team will be established to assist the agencies in planning the mission portfolios. As plans develop, they will be reviewed by ESA member states for approval and by the US National Academy of Sciences.

Source: ESA