Hunt for Supernovae With Galaxy Zoo

How would you like to find a supernova? I can’t think of anyone who wouldn’t be proud to say they have spotted an exploding star. And now, perhaps you can – and without all the work of setting up your telescope and staying up all night (well, that can be fun, too, but…). The great folks who brought you Galaxy Zoo have now partnered with the Palomar Transient Factory to offer the public a chance to hunt and click for supernovae from the comfort of your own computer. And yes, you can still classify galaxies at Galaxy Zoo, but now you can search for for the big guns out in space, too. Sound like fun?

The Palomar Transient Facory uses the famous Palomar Observatory and the Samuel Oschin 1.2 m telescope to look for anything that’s changing in the sky — whether it’s a variable star, an asteroid moving across the sky, the flickering of an active galaxy’s nucleus or a supernova. For now, though, the partnership with Galaxy Zoo will concentrate on finding supernovae, and in particular Type 1A supernovae.

According to Scott Kardel of the Palomar Observatory, “the quantity and quality of the new data that’s been coming in are absolutely mind blowing for astronomers working in this field. On one recent night PTF patrolled a section of the sky about five times the size of the Big Dipper and found eleven new objects.” For the supernova search, it returns to the same galaxies twice a night, every five nights.

That’s where the Zooites from Galaxy Zoo come in: searching through all specially chosen PTF data and looking for supernovae.

“Your task is to search through the candidates found by PTF” said the Galaxy Zoo team. “Waiting for your results are two intrepid Oxford astronomers, Mark and Sarah, who have travelled out to the Roque de los Muchachos Observatory on the Canary Island of La Palma. They have time allocated on the 4.2m William Herschel Telescope to follow up the best of our discoveries.”

Check out Galaxy Zoo’s Supernova page for more info and to sign up to be part of this exciting new Citizen Science project!

For more info on the Palomar Transient Factory, listen to Scott Kardel’s 365 Days of Astronomy podcast.

Naked Saturn

Saturn on August 12, 2009 just after equinox. Credit: NASA

[/caption]
Here’s one of the first raw images of Saturn taken by the Cassini spacecraft just after equinox, on August 12, 2009. The planet sure looks naked without its rings! But not to fear, the rings are still there; we just can’t see them very well — only a thin line. That’s because the sun was shining directly straight-on at the rings at Saturn’s equinox, and the spacecraft was in the right place, too. Equinox occurs every half-Saturn-year which is equivalent to about 15 Earth years. The illumination geometry that accompanies equinox lowers the sun’s angle to the ringplane and causes out-of-plane structures and some moons to cast long shadows across the rings. The ring shadows themselves have become a rapidly narrowing band cast onto the planet. Below, see another image with the rings visible as the spacecraft changed its angle.

Saturn's rings at equinox. Credit: NASA

Check out more raw images from the equinox here.

IYA Live Telescope Today: Delta Gruis and the “Tarantula Nebula”

Hey, folks! What a treat. The skies were clear and dark in central Victoria earlier and the beautiful double star – Delta Gruis – came out to play. Afterwards we homed in on the incredibly bright Tarantula Nebula. While you’re at it, you might want to update your bookmarks to this IYA Live Telescope link. Now… Go and look at our new video! Once in awhile you can even see other portions the Magellanic Cloud in there, too!

The stars that form Grus were originally considered part of Piscis Austrinus (the southern fish), and the Arabic names of many of its stars reflect this classification.

The stars were first defined as a separate constellation by Petrus Plancius, who created twelve new constellations based on the observations of Pieter Dirkszoon Keyser and Frederick de Houtman. Grus first appeared on a 35-cm diameter celestial globe published in 1597 (or 1598) in Amsterdam by Plancius with Jodocus Hondius. Its first depiction in a celestial atlas was in Johann Bayer’s Uranometria of 1603. Plancius chose the crane because that bird was considered to symbolise watchfulness. An alternative name for the constellation, Phoenicopterus (Latin for flamingo), was used briefly in England during the 17th century.

Now that it’s good and dark and we’ve got a bit before the Moon, let’s take a look at something even more fantastic… the Tarantula Nebula!

The Tarantula Nebula (also known as 30 Doradus, or NGC 2070) is an H II region in the Large Magellanic Cloud. It was originally thought to be a star, but in 1751 Nicolas Louis de Lacaille recognized its nebular nature.

The Tarantula Nebula has an apparent magnitude of 8. Considering its distance of about 180,000 light years, this is an extremely luminous non-stellar object. Its luminosity is so great that if it were as close to Earth as the Orion Nebula, the Tarantula Nebula would cast shadows. In fact, it is the most active starburst region known in the Local Group of galaxies. It is also the largest and most active such region in the Local Group with an estimated diameter of 200 pc.

The nebula resides on the leading edge of the LMC, where ram pressure stripping, and the compression of the interstellar medium
likely resulting from this, is at a maximum. At its core lies the extremely compact cluster of stars (~2.5 pc diameter) – R136a – that produces most of the energy that makes the nebula visible. The estimated mass of the cluster is 450,000 solar masses, suggesting it will likely become a globular cluster in future.

In addition to R136, the Tarantula Nebula also contains an older star cluster—catalogued as Hodge 301—with an age of 20–25 million years. The most massive stars of this cluster have already exploded in supernovae. The closest supernova since the invention of the telescope, Supernova 1987A, occurred in the outskirts of the Tarantula Nebula.

As always, check back periodically on the IYA “Live” telescope. It can’t be cloudy forever!

Factual Information Source: Wikipedia

This Week’s WITU Challenge

I’m a day late (sorry!) but here’s this week’s image for the Where In The Universe Challenge, to test your visual knowledge of the cosmos. You know what to do: take a look at this image and see if you can determine where in the universe this image is from; give yourself extra points if you can name the spacecraft responsible for the image. We’ll provide the image today, but won’t reveal the answer until tomorrow. This gives you a chance to mull over the image and provide your answer/guess in the comment section. Please, no links or extensive explanations of what you think this is — give everyone the chance to guess.

UPDATE: The answer has now been posted below.

This is a dust devil on Mars, captured by the HiRISE camera on the Mars Reconnaissance Orbiter. The white mass is a swirling vortex of dust, and the darker line is a shadow cast by this swirling column of dust. This image is from some of the newest releases by HiRISE, see them all here. Find out more about this particular image here.

Check back next week for another WITU challenge!

NASA Doesn’t Receive Enough Money for Mandated Asteroid Search

Planet Killer
Artist's conception of an asteroid hitting Earth.

In 2005, the US Congress mandated that NASA discover 90 percent of all near-Earth objects 140 meters in diameter or greater by 2020. But they forgot one minor detail: Congress or the administration did not request or appropriate any new funds to meet this objective, and with NASA’s existing budget, there is no way NASA can meet the mandated goal.

Does anyone else see a pattern here?

“For the first time, humanity has the capacity and the audacity to avoid a natural disaster,” says Irwin Shapiro of the Harvard-Smithsonian Center for Astrophysics (CfA) in Cambridge, Mass., who headed a National Research Council panel to asses NASA’s progress in reaching the asteroid detection goal . “It really is a question of how much to invest in an insurance policy for the planet.”

NASA was also directed by the Bush administration to build spacecraft to return to the Moon, and perhaps go on to Mars, but do the job (as well as complete the space station and make sure the shuttles can fly safely) with no real increase in budget.

From the report:

Currently, the U.S. government spends a relatively small amount of money funding a search and survey program to discover and track near-Earth objects, and virtually no money on studying methods of mitigating the hazards posed by such objects. Although Congress has mandated that NASA conduct this survey program and has established goals for the program, neither Congress nor the administration has sought to fund it with new appropriations. As a result, NASA has supported this activity by taking funds from other programs, while still leaving a substantial gap between the goals established by Congress and the funds needed to achieve them.

The report is available here (download the free pdf version)

But in summary, the report says that since only limited facilities are currently involved in the asteroid survey/discovery effort, NASA cannot meet the goals of the Congressional mandate on the existing budget. Instead, the three current survey efforts dedicated to the problem, supported at current levels, will likely find only about 15%.

The report also says that Harvard-Smithsonian’s Minor Planet Center is more than capable of handling the observations of the congressionally mandated survey, but there isn’t enough funds for adequate staffing.

If this is true, the facilities to do the job appear to be in place, and no new observatories need to be built or spacecraft need to be launched. How much more money would it take to hire enough people?

However, only three surveys are currently involved in the search (Catalina Sky Survey, Spacewatch and Lincoln Near Earth Asteroid Research), and the panel suggests that more telescopes and spacecraft would be beneficial to the search. Several ground-based telescopes have been proposed or are currently under development that could contribute substantially to meeting the goal established by Congress. However, none has yet been fully funded, nor principally dedicated to the NEO discovery goal.

Right now, the US is the only country that currently has an operating survey/detection program for discovering near-Earth objects. Canada and Germany are both building spacecraft that may contribute to the discovery of near-Earth objects, but neither mission will detect fainter or smaller objects than ground-based telescopes.

But the US isn’t alone in the non-funding of asteroid searches. “Virtually no international funds are spent supporting ground-based NEO surveys, and international NEO discovery efforts are largely conducted on an ad hoc, voluntary, or amateur basis. NASA is the agency that has funded more than 97 percent of the discoveries of NEOs in the last decade,” says the report.

Sources: USA Today, National Acadamies Press

Variability in Type 1A Supernovae Has Implications for Studying Dark Energy

A Hubble Space Telescope-Image of Supernova 1994D (SN1994D) in galaxy NGC 4526 (SN 1994D is the bright spot on the lower left). Image Credit:HST

[/caption]

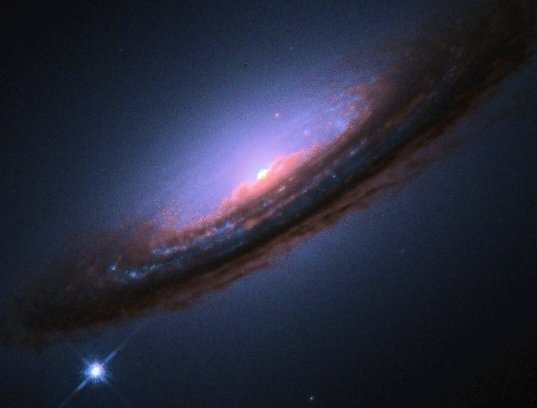
The discovery of dark energy, a mysterious force that is accelerating the expansion of the universe, was based on observations of type 1a supernovae, and these stellar explosions have long been used as “standard candles” for measuring the expansion. But not all type 1A supernovae are created equal. A new study reveals sources of variability in these supernovae, and to accurately probe the nature of dark energy and determine if it is constant or variable over time, scientists will have to find a way to measure cosmic distances with much greater precision than they have in the past.

“As we begin the next generation of cosmology experiments, we will want to use type 1a supernovae as very sensitive measures of distance,” said lead author Daniel Kasen, of a study published in Nature this week. “We know they are not all the same brightness, and we have ways of correcting for that, but we need to know if there are systematic differences that would bias the distance measurements. So this study explored what causes those differences in brightness.”

Kasen and his coauthors–Fritz Röpke of the Max Planck Institute for Astrophysics in Garching, Germany, and Stan Woosley, professor of astronomy and astrophysics at UC Santa Cruz–used supercomputers to run dozens of simulations of type 1a supernovae. The results indicate that much of the diversity observed in these supernovae is due to the chaotic nature of the processes involved and the resulting asymmetry of the explosions.

For the most part, this variability would not produce systematic errors in measurement studies as long as researchers use large numbers of observations and apply the standard corrections, Kasen said. The study did find a small but potentially worrisome effect that could result from systematic differences in the chemical compositions of stars at different times in the history of the universe. But researchers can use the computer models to further characterize this effect and develop corrections for it.

A type 1a supernova occurs when a white dwarf star acquires additional mass by siphoning matter away from a companion star. When it reaches a critical mass–1.4 times the mass of the Sun, packed into an object the size of the Earth–the heat and pressure in the center of the star spark a runaway nuclear fusion reaction, and the white dwarf explodes. Since the initial conditions are about the same in all cases, these supernovae tend to have the same luminosity, and their “light curves” (how the luminosity changes over time) are predictable.

Some are intrinsically brighter than others, but these flare and fade more slowly, and this correlation between the brightness and the width of the light curve allows astronomers to apply a correction to standardize their observations. So astronomers can measure the light curve of a type 1a supernova, calculate its intrinsic brightness, and then determine how far away it is, since the apparent brightness diminishes with distance (just as a candle appears dimmer at a distance than it does up close).

The computer models used to simulate these supernovae in the new study are based on current theoretical understanding of how and where the ignition process begins inside the white dwarf and where it makes the transition from slow-burning combustion to explosive detonation.

The simulations showed that the asymmetry of the explosions is a key factor determining the brightness of type 1a supernovae. “The reason these supernovae are not all the same brightness is closely tied to this breaking of spherical symmetry,” Kasen said.

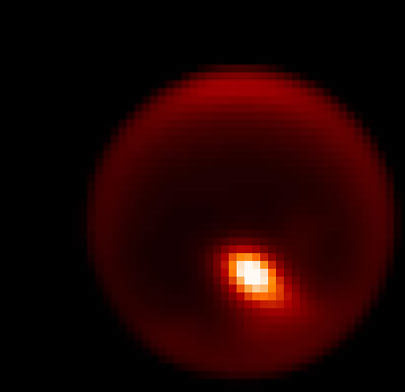
The dominant source of variability is the synthesis of new elements during the explosions, which is sensitive to differences in the geometry of the first sparks that ignite a thermonuclear runaway in the simmering core of the white dwarf. Nickel-56 is especially important, because the radioactive decay of this unstable isotope creates the afterglow that astronomers are able to observe for months or even years after the explosion.

“The decay of nickel-56 is what powers the light curve. The explosion is over in a matter of seconds, so what we see is the result of how the nickel heats the debris and how the debris radiates light,” Kasen said.

Kasen developed the computer code to simulate this radiative transfer process, using output from the simulated explosions to produce visualizations that can be compared directly to astronomical observations of supernovae.

The good news is that the variability seen in the computer models agrees with observations of type 1a supernovae. “Most importantly, the width and peak luminosity of the light curve are correlated in a way that agrees with what observers have found. So the models are consistent with the observations on which the discovery of dark energy was based,” Woosley said.

Another source of variability is that these asymmetric explosions look different when viewed at different angles. This can account for differences in brightness of as much as 20 percent, Kasen said, but the effect is random and creates scatter in the measurements that can be statistically reduced by observing large numbers of supernovae.

The potential for systematic bias comes primarily from variation in the initial chemical composition of the white dwarf star. Heavier elements are synthesized during supernova explosions, and debris from those explosions is incorporated into new stars. As a result, stars formed recently are likely to contain more heavy elements (higher “metallicity,” in astronomers’ terminology) than stars formed in the distant past.

“That’s the kind of thing we expect to evolve over time, so if you look at distant stars corresponding to much earlier times in the history of the universe, they would tend to have lower metallicity,” Kasen said. “When we calculated the effect of this in our models, we found that the resulting errors in distance measurements would be on the order of 2 percent or less.”

Further studies using computer simulations will enable researchers to characterize the effects of such variations in more detail and limit their impact on future dark-energy experiments, which might require a level of precision that would make errors of 2 percent unacceptable.

Source: EurekAlert

Titan’s Desert Sports a Surprising, Powerful Storm

CREDIT: Gemini Observatory/AURA/Henry Roe, Lowell Observatory/Emily Schaller, Insitute for Astronomy, University of Hawai‘i

[/caption]

Titan is just fun. Seems like every other week, another fascinating tidbit emerges about how interesting Saturn’s famous moon really is — and how compellingly similar to Earth.

A United States team of astronomers is releasing this image today in Nature. It’s an adaptive optics peek at a storm over the wild object’s parched, dry desert.

The new research, to be published in the August 13 issue of the journal, announces the discovery of significant cloud formation (about three million square kilometers, or 1.16 million square miles) within the moon’s tropical zone near its equator. Prior to this event (in April 2008) it was not known whether significant cloud formation was possible in Titan’s tropical regions. This activity in Titan’s tropics and mid-latitudes also seems to have triggered subsequent cloud development at the moon’s south pole where it was considered improbable due to the Sun’s seasonal angle relative to Titan.

The evidence comes from astronomers using the Gemini North telescope and NASA’s Infrared Telescope Facility (IRTF), both on Hawaii’s Mauna Kea.

“We obtain frequent observations with IRTF giving us a ‘weather report’ of sorts for Titan. When the IRTF observations indicate that cloud activity has increased, we are able to trigger the next night on the Gemini telescope to determine where on Titan the clouds are located,” said team member Emily Schaller, who was at the University of Hawai‘i Institute for Astronomy when this work was done.

Saturn and Titan (six o'clock). CREDIT: Gemini Observatory/AURA/Henry Roe, Lowell Observatory/Emily Schaller, Insitute for Astronomy, University of Hawai‘i

Titan, the solar system’s second largest moon, has received considerable attention by scientists since NASA’s Cassini mission deployed the Huygens probe that descended through the moon’s atmosphere in January 2005. During its descent, the probe’s cameras revealed small-scale channels and what appear to be stream beds in the equatorial regions that seemed to contradict atmospheric models predicting extremely dry desert-like conditions near the equator. Until now these erosional (fluvial) features have been explained by the possibility of liquid methane seeping out of the ground.

“In April 2008 we observed what was a global event that shows how storm activity in one region can trigger clouds, and probably rainfall, over arid regions, such as the tropics where Huygens landed,” said team member Henry Roe, an astronomer at Lowell Observatory. “Of course these rain showers are not liquid water like here on Earth, but are instead made of liquid methane. Just like the streambeds and channels that are carved by liquid water on Earth, we see features on Titan that have been created by flowing liquid methane.”

Unlike the Earth, on Titan, where the temperature is hundreds of degrees below freezing, methane (or natural gas) is a liquid and it the dominant driver of the moon’s weather and surface erosion. Any water on Titan is frozen on or below the moon’s surface and resemble rocks or boulders on Titan’s surface.

Mid-latitude and polar cloud formations have been bserved for many years (by this team and others) but the combination of extensive monitoring at the IRTF with rapid follow-up using Gemini allowed the team to capture the process as it unfolded near the equator. The team monitored Titan on 138 nights over 2.2 years and during that time cloud cover was well under one percent. Then, mid-April of 2008, just after team member and Ph.D. candidate Schaller had handed in her doctoral dissertation focusing on Titan’s minimal cloud cover she noticed the dramatic increase in cloud cover.

During this three-week episode clouds forming at about 30 degrees south latitude were observed, followed several days later by clouds closer to the equator and at the moon’s south pole. The apparent connection between the cloud formations leads to the possibility that cloud formation in one area of the moon can instigate clouds in other areas by a process known as atmospheric teleconnections. This same phenomena occurs in the Earth’s atmosphere and is caused by what are called planetary Rossby waves which are well understood.

The high-resolution Gemini images of Titan were all obtained with adaptive optics technology which uses a deformable mirror to remove distortions to light caused by the Earth’s atmosphere and produce images showing remarkable detail in the tiny disk of the moon.

“Without this technology this discovery would be impossible from the surface of the Earth,” said Schaller. Currently the Cassini spacecraft is orbiting Saturn but only flies by Titan once every 6 weeks or so. This makes continuous ground-based monitoring important for studying features like these with shorter periods on the order of 3-weeks like this storm.

Further detail about the lead image: Gemini North adaptive optics image of Titan showing storm feature (bright area). Titan is about 0.8 arcsecond across in this 2.12 micron near-infrared image obtained on April 14, 2008 (UTC). CREDIT: Gemini Observatory/AURA/Henry Roe, Lowell Observatory/Emily Schaller, Insitute for Astronomy, University of Hawai‘i

Source: Gemini. Other information available through the University of Hawaii, the National Science Foundation (NSF), Lowell Observatory in Flagstaff, Arizona and, of course, Nature.

HiRISE Highlights: Crater Within a Crater, Awesome View of Victoria and More

Interesting Crater in Meridiani Planum. Credit: NASA/JPL/University of Arizona

[/caption]
I was just thinking it had been awhile since we featured images from the HiRISE camera onboard the Mars Reconnaissance Orbiter spacecraft, so I moseyed over to the HiRISE website only to be blown away by their newest releases. This incredible crater in Meridiani Planum shows a possible double whammy of impacts. It looks as though material filled in the original crater only to be blown out a second time. Another option is that the material in the crater could have collapsed, giving the appearance of a second impact. You can bet the HiRISE team will be looking more closely at this one. Before we move on to more great images, an update on MRO, which unexpectedly went into “safe” mode last week: MRO has now been restored to full operations, after switching to its backup computer. Engineers successfully transitioned the orbiter out of limited-activity “safe” mode on Saturday, Aug. 8, and resumed use of the spacecraft’s science instruments on Monday, Aug. 10. This has happened a few times, and engineers are trying to figure out the root cause of this.

Now, on to the images!
Continue reading “HiRISE Highlights: Crater Within a Crater, Awesome View of Victoria and More”

Trigger-Happy Star Formation in Cepheus B

Cepheus B from Chandra and Spitzer: X-ray (NASA/CXC/PSU/K. Getman et al.); IR (NASA/JPL-Caltech/CfA/J. Wang et al.)

[/caption]
Combining data from the Chandra X-Ray Observatory and the Spitizer Space Telescope allowed astronomers to create this gorgeous new image of Cepheus B. Besides being incredible eye candy, the new image also provides fresh insight into how some stars are born. The research shows that radiation from massive stars may trigger the formation of many more stars than previously thought.

While astronomers have long understood that stars and planets form from the collapse of a cloud of gas, the question of the main causes of this process has remained open.

“Astronomers have generally believed that it’s somewhat rare for stars and planets to be triggered into formation by radiation from massive stars,” said Konstantin Getman of Penn State University, and lead author of the study. “Our new result shows this belief is likely to be wrong.”

Chandra image of Cepheus B.  Credit: NASA/Chandra team
Chandra image of Cepheus B. Credit: NASA/Chandra team

The new study suggests that star formation in the region of study in this image, Cepheus B, is mainly triggered by radiation from one bright, massive star outside the molecular cloud. According to theoretical models, radiation from this star would drive a compression wave into the cloud triggering star formation in the interior, while evaporating the cloud’s outer layers. The Chandra-Spitzer analysis revealed slightly older stars outside the cloud while the youngest stars with the most protoplanetary disks congregate in the cloud interior — exactly what is predicted from the triggered star formation scenario.

“We essentially see a wave of star and planet formation that is rippling through this cloud,” said co-author Eric Feigelson, also of Penn State. “Outside the cloud, the stars probably have newly born planets while inside the cloud the planets are still gestating.”

Cepheus B is a cloud of mainly cool molecular hydrogen located about 2,400 light years from the Earth. There are hundreds of very young stars inside and around the cloud — ranging from a few millions years old outside the cloud to less than a million in the interior — making it an important testing ground for star formation.

Previous observations of Cepheus B had shown a rim of ionized gas around the molecular cloud and facing the massive star. However, the wave of star formation — an additional crucial feature to identifying the source of the star formation — had not previously been seen. “We can even clock how quickly this wave is traveling and it’s going about 2,000 miles per hour,” said Getman.

The star that is the catalyst for the star formation in Cepheus B, is about 20 times as massive as the Sun, or at least five times weightier than any of the other stars in Cepheus B.

The Chandra and Spitzer data also suggest that multiple episodes of star and planet formation have occurred in Cepheus B over millions of years and that most of the material in the cloud has likely already been evaporated or transformed into stars.

“It seems like this nearby cloud has already made most of its stars and its fertility will soon wane,” said Feigelson. “It’s clear that we can learn a lot about stellar nurseries by combining data from these two Great Observatories.”

A paper describing these results was published in the July 10 issue of the Astrophysical Journal.

Source: Chandra

Biggest Exoplanet Yet Orbits the Wrong Way

An artist's impression of a transiting exoplanet Credit:NASA/Hubble

[/caption]
Planet hunters from the UK have discovered the largest exoplanet yet, and its uniqueness doesn’t end there. Dubbed WASP-17, this extra large world is twice the size of Jupiter but is super-lightweight, “as dense as expanded polystyrene” one astronomer said. Plus it is going the wrong way around its home sun, making it the first exoplanet known to have a retrograde orbit. As a likely a victim of planetary billiards, astronomers say this unusual planet casts new light on how planetary systems form and evolve.

Astronomers say the planet must have flipped direction after a near miss with another huge “big brother” planet swung it around like a slingshot. “Newly formed solar systems can be violent places,” said graduate student David Anderson, of Keele University. “Our own moon is thought to have been created when a Mars-sized planet collided with the recently formed Earth and threw up a cloud of debris that turned into the moon. A near collision during the early, violent stage of this planetary system could well have caused a gravitational slingshot, flinging WASP-17 into its backwards orbit.”

An artist's impression of a transiting exoplanet. Credit: ESA C Carreau

Though it is only half the mass of Jupiter it is bloated to nearly twice Jupiter’s size.

Astronomers have long wondered why some extra-solar planets are far bigger than expected, and WASP-17 points to the explanation. Scattered into a highly elliptical, retrograde orbit, it would have been subjected to intense tides. Tidal compression and stretching would have heated the gas-giant planet to its current, hugely bloated extent. “This planet is only as dense as expanded polystyrene, seventy times less dense than the planet we’re standing on”, said Coel Hellier, also of Keele University.

WASP-17 is the 17th new exoplanet found by the Wide Area Search for Planets (WASP) consortium of UK universities. The WASP team detected the planet using an array of cameras that monitor hundreds of thousands of stars, searching for small dips in their light when a planet transits in front of them. Geneva Observatory then measured the mass of WASP-17, showing that it was the right mass to be a planet. The WASP-South camera array that led to the discovery of WASP-17 is hosted by the South African Astronomical Observatory.

Read the team’s paper here.

Source: STFC