
In an impressive show of the power and might of the new Ares rocket, NASA and ATK Space systems successfully completed the first full-scale, full-duration test firing of the first stage motor for the potential successor to the space shuttle. The two-minute burn was powered with 22 million horsepower, and this first stage motor will generate up to 3.6 million pounds of thrust, or lifting power, at launch. Flames shot out twice as long as the rocket itself, at temperatures where steel boils and sand turns to glass — about 4,500 degrees Fahrenheit (2,480 degrees Celsius). 650 sensors sampled data from the test firing with rates up to 2000 samples a second. “We got an incredible amount of data today, ” Alex Priskos, first stage manager for Ares Projects, “and we were looking at 46 different objectives, but we should be able to understand every aspect of this motor, including strengths and weaknesses, and ultimately deliver the safest and most reliable motor possible.”
Continue reading “NASA, ATK Unleash Ares Engine in Test Firing”
IYA Live Telescope Today: Messier 93

At last… Some clear skies in Central Victoria! (and i thought ohio was bad…) If you had a chance to check on our IYA Live Telescope today, you got a treat. We broadcast the “Running Man Nebula” for awhile, then switched over to Puppis as it rose to pick up Messier 93. Need a replay? We saved one for you…
Messier 93 (also known as M 93 or NGC 2447) is an open cluster in the constellation Puppis. It was discovered by Charles Messier in 1781.
M93 is at a distance of about 3,600 light years from Earth and has a spatial radius of some 10 to 12 light years. Its age is estimated at some 100 million years.
As always, keep checking periodically with the link on the left. It can’t stay cloudy forever… Can it?!?
Factual Information courtesy of Wikipedia.
What is Sagittarius A*?

At the very heart of the Milky Way is a region known as Sagittarius A*. This region is known the be the home of a supermassive black hole with millions of times the mass of our own Sun. And with the discovery of this object, astronomers have turned up evidence that there are supermassive black holes at the centers most most spiral and elliptical galaxies.
The best observations of Sagittarius A*, using Very Long Baseline Interferometry (VLBI) radio astronomy have determined that it’s approximately 44 million km across (that’s just the distance of Mercury to the Sun). Astronomers have estimated that it contains 4.31 million solar masses.
Of course, astronomers haven’t actually seen the supermassive black hole itself. Instead, they have observed the motion of stars in the vicinity of Sagittarius A*. After 10 years of observations, astronomers detected the motion of a star that came within 17 light-hours distance from the supermassive black hole; that’s only 3 times the distance from the Sun to Pluto. Only a compact object with the mass of millions of stars would be able to make a high mass object like a star move in that trajectory.
The discovery of a supermassive black hole at the heart of the Milky Way helped astronomers puzzle out a different mystery: quasars. These are objects that shine with the brightness of millions of stars. We now know that quasars come from the radiation generated by the disks of material surrounding actively feeding supermassive black holes. Our own black hole is quiet today, but it could have been active in the past, and might be active again in the future.
Some astronomers have suggested other objects that could have the same density and gravity to explain Sagittarius A, but anything would quickly collapse down into a supermassive black hole within the lifetime of the Milky Way.
We have written many articles about Sagittarius A. Here’s an article about how the Milky Way’s black hole is sending out flares, and even more conclusive evidence after 16 years of observations.
Here’s an article from NASA back in 1996 showing how astronomers already suspected it was a supermassive black hole, and the original ESO press release announcing the discovery.
We have recorded an episode of Astronomy Cast all about the Milky Way. Give it a listen: Episode: 99 – The Milky Way
Source: Wikipedia
Anticipated Joint Experiment with Chandrayaan-1 and LRO Failed

[/caption]
A highly anticipated Bi-static radar experiment to look for possible water ice hiding in polar craters on the Moon failed due to the deterioration and eventual loss of the Chandrayaan-1 lunar orbiter. “Everything worked out as best as could be hoped, except for one thing,” said Paul Spudis, principal investigator for Chandrayaan-1’s radar instrument, Mini-SAR. “It turned out Chandrayaan-1 wasn’t pointed at the Moon when we were taking the data, but we didn’t know that at the time. So, the Bi-static attempt was a failure.” The experiment was attempted on August 20, and one week later the Chandrayaan-1 spacecraft failed completely due to overheating. The Indian Space Research Organization (ISRO) admitted they underestimated the amount of heat radiating from the Moon and didn’t have enough thermal protection on the spacecraft.
Spudis told Universe Today that both Chandrayaan-1 and the Lunar Reconnaissance Orbiter were in the right locations to do the experiment, but Chandrayaan-1 was pointed in the wrong direction. “We didn’t realize it, but the spacecraft was on its last legs at that point. When we commanded it to get into a certain attitude to do the experiment, it just wasn’t in that attitude, and we had no way of knowing it.”
The experiment required tricky maneuvers for both Chandrayaan-1 and LRO. The test was timed to coincide when both spacecraft were only 20 kilometers (12.4 miles) apart over Erlanger Crater near the Moon’s north pole. Chandrayaan-1’s radar was to transmit a signal to be reflected off the interior the crater to be picked up by LRO. Comparing the signal that would have bounced straight back to Chandrayaan-1 with the signal that bounced at a slight angle to LRO would have provided unique information about any water ice that may be present inside the crater.

Because of the loss of the star trackers earlier this year on Chandrayaan-1, Spudis said they weren’t certain during the test what direction the spacecraft was pointing. “We thought it was oriented in the right attitude, but it turned out it was not. So we didn’t send the radar beam into the crater like we had hoped, so therefore we didn’t get any echoes from it. It is disappointing, but that’s the space biz, that’s the way things go.”
Spudis said the international coordination required for the experiment between ISRO, JPL, NASA and the Applied Physics Lab worked exceptionally well. “Everyone did a great job and gave us great support on it. We came very close and the actual encounter was better than predicted. So everything worked except for the Chandrayaan-1 spacecraft.”
The teams were getting ready to try a repeat of the experiment, during the last weekend in August when Chandrayaan-1 quit communicating. “We were going to have another opportunity where the spacecraft were going to be close together over a different crater on the north pole,” Spudis said, “but then we lost the spacecraft on that Thursday. So that was disappointing. We gave it our best shot, but that’s the way it goes.”
But Spudis said he has his team have been busy focusing on studying and understanding the monostatic data they do have.
“We have some excellent quality data collected from mid- Feb to mid-April of this year,” he said. “We were able to get data from over 90% of both poles. We’re really just getting started analyzing it.”
There are missing pieces of data, especially directly at the poles because the instrument was a side-looking radar. The Mini-SAR always looked off nadir, off to one side of the ground track that is directly below the spacecraft. “So if you are in perfectly polar orbit, you will never image the poles because you are always looking off to the side,” Spudis explained. ” So we have these black zones around the poles. But we do have a lot of coverage around the poles of terrain that is in permanent darkness. We are studying that right now, and In fact, I am in the midst of writing up our first paper, and we’ll have some interesting results from that.”

Spudis said the loss of Chandrayaan-1 wasn’t totally unexpected due to the problems the spacecraft had been experiencing, but no one thought it would happen quite this quickly. “It was a little unexpected how rapidly it happened, how soon the end came,” he said. “Because the spacecraft had been having problems, we had been living with the various losses of capabilities, and we just kept soldiering through hoping that everything would work out. The timing was unfortunate.”
In addition the substantial amount of data received from Chandrayaan-1 data, Spudis is also looking to the data that will be coming from LRO. “LRO has a radar instrument that is a more advanced version than the one on Chandrayaan,” he said. “The difference is that there are two frequencies instead of one, and it has two resolutions – a normal resolution similar to India’s version on Chandrayaan-1 one, as well as a zoom version, a hi-res mode, with a factor of 6 or 7 better than the nominal mode.”
Spudis said LRO’s Mini-RF has been turned on during the LRO commissioning and so far it has been used to support the LCROSS impact. “They wanted to look at targets near the south pole, so we took some data for them. That data looks very interesting as well.”
For more information on Spudis’ work, check out his website.
When Was Mars Discovered?
[/caption]
It is impossible to know the answer to ”when was Mars discovered”. It is bright enough to be seen in the night sky without binoculars or a telescope and has been documented for at least 4,000 years.
If you were to change the question a little to ”who first theorized that Mars was a planet”, then an answer can be found. Nicolaus Copernicus is the first astronomer to postulate that Mars and a few other bodies known at the time were planets. The heliocentric theory that he published in 1543 marked the first time that astronomers widely considered the possibility that the Sun was the center of the Solar System instead of the Earth.
While no one knows who first discovered Mars, we do know who made many of the discoveries about the planet. It is known that Tycho Brahe, a Danish astronomer made accurate calculations of the position of Mars as early as 1576. Johannes Kepler theorized that the orbit of Mars was elliptical in contradiction to what astronomers believed at the time. He soon expanded that theory to encompass all planets. In 1659, Christian Huygens, a Dutch astronomer drew Mars with the observations he made using a telescope he designed himself. He also discovered a strange feature on the planet that became known as Syrtis Major.
On November 28, 1964, Mariner 4 was launched successfully on an eight-month voyage to the Red Planet. It made its first flyby on July 14, 1965, collecting the first close-up photographs of another planet. The pictures showed many impact craters, some of them touched with frost in the chill Martian evening. The Mariner 4 spacecraft was able to function for about three years in solar orbit, continuing long-term studies of the solar wind environment and making coordinated measurements with Mariner 5.
There are currently six spacecraft in orbit around Mars or on its surface and several more are in the planning or design stages. Five are gathering data at an amazing rate, the other(Phoenix) is non-functioning. New discoveries like subsurface water ice and methane plumes in the atmosphere are being made on a regular basis. Scientists may not be able to give an answer to ”when was Mars discovered”, but they can offer answers to thousands of other questions and the list is growing as we speak.
We have written many articles about the study of Mars. Here an article about how methane is being produced on Mars, and the possible discovery of life on Mars.
Here are some additional articles about the early observations of Mars, and here’s a whole book about observing Mars.
We have recorded an entire episode of Astronomy Cast about the planet Mars. Listen to it here, Episode 52: Mars.
Source: NASA
Aliens
K-T Boundary

[/caption]
What killed the dinosaurs? That’s a question that has puzzled paleontologists since dinosaurs were first discovered. Maybe the global climate changed, maybe they were killed by disease, volcanoes, or the rise of mammals. But in the last few decades, a new theory has arisen; an asteroid strike millions of years ago drastically changed the Earth’s environment. It was this event that pushed the dinosaurs over the edge into extinction. What’s the evidence for this asteroid impact? A thin dark line found in layers of sediment around the world; evidence that something devastating happened to the planet 65 million years ago. This line is known as the K-T boundary.
What is the K-T boundary? K is actually the traditional abbreviation for the Cretaceous period, and T is the abbreviation for the Tertiary period. So the K-T boundary is the point in between the Cretaceous and Tertiary periods. Geologists have dated this period to about 65.5 million years ago.
When physicist Luis Alvarez and geologist Walter Alvarez studied the K-T boundary around the world, they found that it had a much higher concentration of iridium than normal – between 30-130 times the amount of iridium you would expect. Iridium is rare on Earth because it sank down into the center of the planet as it formed, but iridium can still be found in large concentrations in asteroids. When they compared the concentrations of iridium in the K-T boundary, they found it matched the levels found in meteorites.
The researchers were even able to estimate what kind of asteroid must have impacted the Earth 65.5 million years ago to throw up such a consistent layer of debris around the entire planet. They estimated that the impactor must have been about 10 km in diameter, and release the energy equivalent of 100 trillion tons of TNT.
When that asteroid struck the Earth 65.5 million years ago, it destroyed a region thousands of kilometers across, but also threw up a dust cloud that obscured sunlight for years. That blocked photosynthesis in plants – the base of the food chain – and eventually starved out the dinosaurs.
Researchers now think that the asteroid strike that created the K-T boundary was probably the Chicxulub Crater. This is a massive impact crater buried under Chicxulub on the coast of Yucatan, Mexico. The crater measures 180 kilometers across, and occurred about 65 million years ago.
Geologists aren’t completely in agreement about the connection between the Chicxulub impact and the extinction of the dinosaurs. Some believe that other catastrophic events might have helped push the dinosaurs over the edge, such as massive volcanism, or a series of impact events.
We have written many articles about the K-T boundary for Universe Today. Here’s an article about how the dinosaurs probably weren’t wiped out by a single asteroid, and here’s an article about how asteroids and volcanoes might have done the trick.
Here’s more information from the USGS, and an article from NASA.
We have recorded an episode of Astronomy Cast all about asteroid impacts. Listen to it here: Episode 29: Asteroids Make Bad Neighbors.
Reference:
USGS
Japan Launches New Era of ISS Resupply Ships
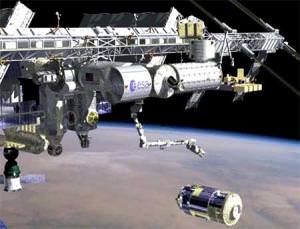
Japan successfully launched its first re-supply spacecraft to the International Space Station today. After liftoff at 17:01 GMT (12:01 CDT) from Tanegashima Space Center in southern Japan, flight controllers confirmed the HTV-1 spacecraft separated from the H-2B rocket and now is in its preliminary orbit. The flight profile has the HTV taking seven days to reach the ISS so controllers can run various tests and demonstrations on its maiden voyage before rendezvousing with the space station. Unlike previous re-supply ships that dock directly to the station, the HTV will fly to within 10 meters from the ISS on September 17, and then astronaut Nicole Stott will reach out and grapple the spacecraft with the space station’s robotic arm, Canadarm 2, and connect it to the Harmony module on the ISS.
[/caption]
The new HTV spacecraft is the latest in an international fleet of cargo ships to support the space station. While capable of carrying 6.5 tons of cargo, on this first flight it is bringing up 5 tons of food, experiments and other supplies for the ISS. Unlike previous supply ships, it can haul large unpressurized experiments and equipment to remain outside the station, as well as supplies for inside the station, too. For its flight debut, the HTV-1’s external cargo drawer is filled with two experiments – one for JAXA and one for NASA – to be attached to the Kibo lab’s external porch.
The HTV weighs about 16 tons, is 9 meters (30 feet) long and 4.2 meters (14.5 feet) in diameter.

Another difference is that craft doesn’t have solar array wings, but has 57 solar arrays molded around the spacecraft to gather power from sunlight.
“HTV-1 is opening up new horizons for JAXA’s undertaking of human spaceflight,” said Masazumi Miyake, deputy director of JAXA’s Houston office. “I like to say that JAXA is now entering a new era.”
The success of both the HTV and the H-2B rocket will likely prove to be an important stepping stone for JAXA, as the country has ambitions of heading to the moon and Mars.
How Long is a Light Year?

A light year is the distance light can travel in vacuum in one year’s time. This distance is equivalent to roughly 9,461,000,000,000 km or 5,878,000,000,000 miles. This is such a large distance. For comparison, consider the circumference of the Earth when measured at the equator: 40,075 km.
You can even throw in the center to center distance between the Earth and the Moon, 384,403 km, and that value would still pale in comparison to 1 light year. Pluto, at its farthest orbit distance from the Sun, is only about 7,400,000,000 km from the center of our Solar System.
Because of its great scale, the light year is one of the units of distance used for astronomical objects. For example, Andromeda Galaxy, which is the nearest spiral galaxy from the Milky Way, is approximately 2.5 million light years away. Alpha Centauri, the nearest star system from our own Solar System is only 4.37 light years away.
Imagine using miles or kilometers when describing the diameter of the Milky Way Galaxy, some 100,000 light years. Expressed in km or mi in expanded notation, that could occupy a lot of space on this page. Just look at the first paragraph, wherein we described 1 light year, to see what I mean. Of course, one may argue that we can still use scientific notation. But well, some people easily get daunted by the mere sight of exponents.
Although the light year has a more familiar ring to us, having perhaps heard about it quite often in sci-fi films or in magazines, it is not the most widely used unit of distance in astrometry, the branch of astronomy that deals with measurements and positions of celestial bodies. That assignment is given to the parsec. 1 parsec is approximately equal to 3.26 light years.
Another commonly used unit of distance is the astronomical unit or AU, wherein 1 AU is the average distance between the Earth and the Sun, and is roughly equivalent to 150,000,000 km. It is normally used when describing distances within the Milky Way.
Always remember that the ‘year’ we have been referring to here is not based in the internationally-accepted Gregorian Calendar. Instead, ‘year’ here refers to the Julian year. 1 Julian year is equivalent to 365.25 days or 31,557,600 seconds. The Julian calendar does not designate dates, hence is different from the Gregorian Calendar.
We have some related articles here in Universe Today. Here are the links:
Here are the links of two more articles from NASA:
Here are two episodes at Astronomy Cast that you might want to check out as well:
Source: NASA
What are Plate Boundaries?
In Plate Tectonic Theory, the lithosphere is broken into tectonic plates, which undergo some large scale motions. The boundary regions between plates are aptly called plate boundaries. Based upon their motions with respect to one another, these plate boundaries are of three kinds: divergent, convergent, and transform.
Divergent Boundaries:
Divergent boundaries are those that move away from one another. When they separate, they form what is known as a rift. As the gap between the two plates widen, the underlying layer may be soft enough for molten lava underneath to push its way upward. This upward push results in the formation of volcanic islands. Molten lava that succeeds in breaking free eventually cools and forms part of the ocean floor.
Some formations due to divergent plate boundaries are the Mid-Atlantic Ridge and the Gakkel Ridge. On land, you have Lake Baikal in Siberia and Lake Tanganyika in East Africa.
Convergent Boundaries:
Convergent boundaries are those that move towards one another. When they collide, subduction usually takes place. That is, the denser plate gets subducted or goes underneath the less dense one. Sometimes, the plate boundaries also experience buckling. Convergent boundaries are responsible for producing the deepest and tallest structures on Earth.
Among those that have formed due to convergent plate boundaries are K2 and Mount Everest, the tallest peaks in the world. They formed when the Indian plate got subducted underneath the Eurasian plate. Another extreme formation due to the convergent boundary is the Mariana Trench, the deepest region on Earth.
Transform Boundaries:
Transform boundaries are those that slide alongside one another. Lest you imagine a slippery, sliding motion, take note that the surfaces involved are exposed to huge amounts of stress and strain and are momentarily held in place. As a result, when the two plates finally succeed in moving with respect to one another, huge amounts of energy are released. This causes earthquakes.
The San Andreas fault in North America is perhaps the most popular transform boundary. Transform boundary is also known as transform fault or conservative plate boundary.
Movements of the plates are usually just a few centimeters per year. However, due to the huge masses and forces involved, they typically result in earthquakes and volcanic eruptions. If the interactions between plate boundaries involve only a few centimeters per year, you could just imagine the great expanse of time it had to take before the land formations we see today came into being.
You can read more about plate boundaries here in Universe Today. Here are the links:
- Tectonic Plates
- Lithosphere
Here are the links of two more articles from USGS:
Here are two episodes at Astronomy Cast that you might want to check out as well:
Sources:
Plate Boundaries
http://pubs.usgs.gov/gip/dynamic/understanding.html