Space Junk Threatens Future Missions

Low Earth Orbit
Estimated number of objects in low Earth orbit. Credit: NASA

[/caption]
The U.S. Air Force began upgrading its ability to predict possible collisions in space after two satellites collided in February 2009, and has now done a collision analysis on over 800 maneuverable satellites. They hope to be able to track 500 more non-maneuvering satellites by year’s end. But maneuverable satellites aren’t the problem. The amount of space debris has risen by 40 per cent in the past four years alone. The Air Force Space Command now tracks 21,000 orbiting objects that are 10 centimeters or more across – including the 800 working satellites – and estimates that there are 500,000 smaller fragments in orbit.

“Our goal now is to do that conjunction assessment for all active satellites, roughly around 1,300 satellites, by the end of the year and provide that information to users as required,” said Lieutenant General Larry James, U.S. Strategic Command’s Joint Functional Component Command for Space, speaking at the Strategic Space Symposium this week in Omaha, Nebraska.

Some of the 500 satellites still to be assessed cannot be maneuvered in orbit because they are not functioning, or do not carry extra fuel that would be needed to move them once in orbit.

At another conference this week, the European Air and Space Conference in Manchester, UK, Hugh Lewis of the University of Southampton estimated the number of close encounters between objects in orbit will rise 50% in the next decade, and quadruple by 2059. The number of pieces of space debris has risen by 40% in the past four years alone.

Countermeasures by satellite builders and operators to avoid additional space debris are encouraged, but they add to the cost of missions.

Lewis has determined that compared with the 13,000 close approaches per week now, he projects there will be 20,000 a week in 2019 and upwards of 50,000 a week in 2059. From this he predicts that satellite operators will have to make five times as many collision avoidance maneuvers in 2059 as they will in 2019. “There’s going to be a big impact,” says Lewis. “You’re going to need more tracking to remove uncertainty about close approaches and undertake more maneuvers.”

Sources: Reuters, New Scientist

Mercury Gives Up More Secrets to MESSENGER

Even though the MESSENGER spacecraft experienced a “hiccup” during its third and final flyby of Mercury on Sept. 29, scientists are still pleased and surprised by the data garnered. The spacecraft went into safe mode, shutting down temporarily because of a power system switchover during a solar eclipse as it approached the planet and only half of the expected observations were carried out. But the new data – combined with observations from the two previous flybys — provide an almost complete view of Mercury’s surface and offer new, unexpected scientific findings. “Although the area viewed for the first time by spacecraft was less than 350 miles across at the equator, the new images reminded us that Mercury continues to hold surprises,” said principal investigator Sean Solomon.

The most important aspect of the flyby was a critical gravity assist to remain on course to enter into orbit around Mercury in 2011. Additionally, the spacecraft’s cameras and instruments collected high-resolution and color images unveiling another 6 percent of the planet’s surface never before seen at close range.

Image coverage map of Mercury after the third MESSENGER flyby. Credit: NASA, Applied Physics Lab

Solomon said at today’s press conference that all the data gathered on Mercury so far are like first few chapters of a novel; we’ve learned much, but much more of the story remains. Approximately 98 percent of Mercury’s surface now has been imaged by NASA spacecraft. After MESSENGER goes into orbit around Mercury, it will see the polar regions, which are the only unobserved areas of the planet.

Many new features were revealed during the third flyby, including a region with a bright area surrounding an irregular depression, suspected to be volcanic in origin. Other images revealed a double-ring impact basin approximately 180 miles across. The basin is similar to a feature scientists call the Raditladi basin, which was viewed during the probe’s first flyby of Mercury in January 2008.

This spectacular 290-km-diameter double-ring basin seen in detail for the first time during MESSENGER’s third flyby of Mercury bears a striking resemblance to the Raditladi basin, observed during the first flyby.

“This double-ring basin, seen in detail for the first time, is remarkably well preserved,” said Brett Denevi, a member of the probe’s imaging team and a postdoctoral researcher at Arizona State University in Tempe. “One similarity to Raditladi is its age, which has been estimated to be approximately one billion years old. Such an age is quite young for an impact basin, because most basins are about four times older. The inner floor of this basin is even younger than the basin itself and differs in color from its surroundings. We may have found the youngest volcanic material on Mercury.”

One of the spacecraft’s instruments conducted its most extensive observations to date of Mercury’s exosphere, or thin atmosphere, during this encounter. The flyby allowed for the first detailed scans over Mercury’s north and south poles. The probe also has begun to reveal how Mercury’s atmosphere varies with its distance from the sun.

Comparison of neutral sodium observed during MESSENGER’s second and third Mercury flybys

“A striking illustration of what we call ‘seasonal’ effects in Mercury’s exosphere is that the neutral sodium tail, so prominent in the first two flybys, is 10 to 20 times less intense in emission and significantly reduced in extent,” says participating scientist Ron Vervack, of the Johns Hopkins University Applied Physics Laboratory, or APL, in Laurel, Md. “This difference is related to expected variations in solar radiation pressure as Mercury moves in its orbit and demonstrates why Mercury’s exosphere is one of the most dynamic in the solar system.”

The observations also show that calcium and magnesium exhibit different seasonal changes than sodium. Studying the seasonal changes in all exospheric constituents during the mission orbital phase will provide key information on the relative importance of the processes that generate, sustain, and modify Mercury’s atmosphere.

Schematic view of Mercury’s interior showing its large, iron-rich core, which constitutes at least ~60% of the planet’s mass.

The third flyby also revealed new information on the abundances of iron and titanium in Mercury’s surface materials. Earlier Earth and spacecraft-based observations showed that Mercury’s surface has a very low concentration of iron in silicate minerals, a result that led to the view that the planet’s crust is generally low in iron.

“Now we know Mercury’s surface has an average iron and titanium abundance that is higher than most of us expected, similar to some lunar mare basalts,” says David Lawrence, an APL participating mission scientist.

The spacecraft has completed nearly three-quarters of its 4.9-billion-mile journey to enter orbit around Mercury. The full trip will include more than 15 trips around the sun. In addition to flying by Mercury, the spacecraft flew past Earth in August 2005 and Venus in October 2006 and June 2007.

Source: NASA

Chase Plane Footage of Ares I-X Flight


Here’s some great additional footage from the Ares I-X flight taken from a chase plane, which shows the entire flight, including booster separation and parachute deploy — and the problems that happened with the parachutes. The video was taken from a Cessna Skymaster aircraft positioned approx. 10 nautical miles away from the vehicle at an altitude of 12,000 feet. The videographer used a gyro-stabilized high-definition camera system mounted to the outside of the aircraft to capture this spectacular footage which provides extremely valuable engineering data, and imagery of the recovery sequence in rarely-seen detail. This provides NASA with additional critical data from vehicle ascent, booster deceleration and parachute deploy.
Continue reading “Chase Plane Footage of Ares I-X Flight”

Do “Skeleton” Filaments Give Structure to the Universe?

This 3D illustration shows the position of the galaxies and reveals the extent of this gigantic structure. The galaxies located in the newly discovered structure are shown in red. Galaxies that are either in front or behind the structure are shown in blue. Credit: ESO

Are there “skeletons” out in the Universe –structures that form the framework of how galaxies are distributed? Astronomers have tracked down a gigantic, previously unknown assembly of galaxies located almost seven billion light-years away from us, which seems to point to a prominent galaxy structure in the distant Universe, providing further insight into the cosmic web and how it formed. “Matter is not distributed uniformly in the Universe,” says Masayuki Tanaka from ESO, who led the new study. “In our cosmic vicinity, stars form in galaxies and galaxies usually form groups and clusters of galaxies. The most widely accepted cosmological theories predict that matter also clumps on a larger scale in the so-called ‘cosmic web’, in which galaxies, embedded in filaments stretching between voids, create a gigantic wispy structure.”

The filament is located about 6.7 billion light-years away from us and extends over at least 60 million light-years. The newly uncovered structure does probably extend further, beyond the field probed by the team, and hence future observations have already been planned to obtain a definite measure of its size.

These filaments are millions of light years long and constitute the skeleton of the Universe: galaxies gather around them, and immense galaxy clusters form at their intersections, lurking like giant spiders waiting for more matter to digest. Scientists are struggling to determine how they swirl into existence. Although massive filamentary structures have been often observed at relatively small distances from us, solid proof of their existence in the more distant Universe has been lacking until now.

The galaxies located in the newly discovered structure are shown in red. Galaxies that are either in front or behind the structure are shown in blue.  Credit: ESO
The galaxies located in the newly discovered structure are shown in red. Galaxies that are either in front or behind the structure are shown in blue. Credit: ESO

The team led by Tanaka discovered a large structure around a distant cluster of galaxies in images they obtained earlier. They have now used two major ground-based telescopes to study this structure in greater detail, measuring the distances from Earth of over 150 galaxies, and, hence, obtaining a three-dimensional view of the structure. The spectroscopic observations were performed using the VIMOS instrument on ESO’s Very Large Telescope and FOCAS on the Subaru Telescope, operated by the National Astronomical Observatory of Japan.

With these and other observations, the astronomers were able to make a real demographic study of this structure, and have identified several groups of galaxies surrounding the main galaxy cluster. They could distinguish tens of such clumps, each typically ten times as massive as our own Milky Way galaxy — and some as much as a thousand times more massive — while they estimate that the mass of the cluster amounts to at least ten thousand times the mass of the Milky Way. Some of the clumps are feeling the fatal gravitational pull of the cluster, and will eventually fall into it.

Image of the assembly of galaxies. Credit: ESO

“This is the first time that we have observed such a rich and prominent structure in the distant Universe,” says Tanaka. “We can now move from demography to sociology and study how the properties of galaxies depend on their environment, at a time when the Universe was only two thirds of its present age.”

Source: ESO

Fabulous! Enceladus Raw Flyby Images

Carolyn Porco, the lead for Cassini’s imaging team, warned on Twitter that the flyby of Saturn’s moon Enceladus performed by the spacecraft on Nov. 2 wasn’t really an “imaging” flyby, and that we might have to wait until the Nov. 21 flyby for really good images. But just take a look the images returned so far, with stunning looks at the jets shooting from the moon! Another image takes a close look at the surface. These are raw, unprocessed images, but what images they are! This is the second image from today’s flyby returned by the spacecraft. See below for more.

Image #3 from  the Nov. 2 flyby of Enceladus. Credit: NASA/JPL/Space Science Institute
Image #3 from the Nov. 2 flyby of Enceladus. Credit: NASA/JPL/Space Science Institute

Cassini came within about 100 kilometers (62 miles) of the surface. The spacecraft has gone closer during a previous flyby (25 kilometers or 15 miles). This is the third image sent back so far from this flyby, showing the surface of the tiger-striped, geyser-spewing moon. According to the CICLOPS website, this image was taken in visible green light with the Cassini spacecraft narrow-angle camera at a distance of approximately 14,000 kilometers (8,700 miles) from Enceladus. The plan was for the spacecraft to go deep into the heart of the plume from the geysers on the tiger-striped moon; as of yet no images from the plume have been released. The objective of this flyby was to analyze the particles in the plume with instruments that can detect the size, mass, charge, speed and composition. The spacecraft spent only about a minute in the plume.

A far away view of the plumes from Enceladus. Credit: NASA/JPL/Space Science Institute

Here’s a view from farther away, with the plumes visible against the backlit moon.

We’ll add any more images that become available.

Source: CICLOPS

Jupiter’s Dueling Red Spots

Jupiter 11/01/09 by John Chumack

Even though most of us have been suffering from poor seeing conditions due to both hemisphere’s seasonal climate changes, the changes we’re experiencing look like nothing compared to what’s happening on Jupiter. If you think we’ve got turbulent atmosphere and more than our fair share of clouds – then check out what John Chumack’s been watching!

“I captured Jupiter last night (7:45pm EST on 11-01-09) from my backyard in Dayton, but the seeing was rather poor….but I did notice that the Great Red Spot had Company…the Little Red Spot has gotten noticeably redder and is now very close to the GRS.”

Of course, we all know the Great Red Spot is a great anti-cyclonic (high pressure) storm similar to our terrestrial hurricanes, but it is enormous. Three Earths would fit within its boundaries! And we also know this huge storm has persisted for at least the 400 years that we humans have observed it through telescopes. But in all that time, has it ever collided with another storm front?

Because the GRS can never occur over a land mass and the fact that it is driven by Jupiter’s internal heat source may be why it has hung around for so long. Thanks to some far reaching computer simulations, astronomers believe such large disturbances may be a stable feature of Jupiter, and that stronger disturbances tend to absorb weaker ones. Has the GRS consumed smaller anti-cyclones in its past and that is why is is so big? Is it about to do it again?

Since the cometary collision that created the “Great Black Spot” in July of this year occurred, many observers and photographers have been keeping an eye on Jupiter’s activity. Says John, “Since July they seem to have been getting closer together and may eventually collide….it will be fun watching to see which one survives the duel!!!”

dn14290-2_250In 2006, Oval BA, also known as “Red Jr.,” sideswiped its huge companion – just as it does about every two years. Chances are good that when the two meet, the smaller of the pair will end up losing its ruddy tones – the larger storm slowing Oval BA’s spin and possibly reversing the process that reddened it in the first place. Will it pull up even more material from below Jupiter’s surface? Or will it disperse what’s already there? No one knows for sure… But what we do know is that when a third “Red Spot” passed between the two in 2008… and it didn’t survive the interaction. Need to know when to watch? Then take this:

Great Red Spot Transit Times (UT):

November 1: 5:36, 15:31; 2: 1:27, 11:23, 21:19; 3: 7:14, 17:10; 4: 3:06, 13:02, 22:58; 5: 8:53, 18:49; 6: 4:45, 14:41; 7: 0:36, 10:32, 20:28; 8: 6:24, 16:20; 9: 2:15, 12:11, 22:07; 10: 8:03, 17:59; 11: 3:54, 13:50, 23:46; 12: 9:42, 19:38; 13: 5:33, 15:29; 14: 1:25, 11:21, 21:17; 15: 7:12, 17:08; 16: 3:04, 13:00, 22:56; 17: 8:51, 18:47; 18: 4:43, 14:39; 19: 0:35, 10:30, 20:26; 20: 6:22, 16:18; 21: 2:14, 12:10, 22:05; 22: 8:01, 17:57; 23: 3:53, 13:49, 23:44; 24: 9:40, 19:36; 25: 5:32, 15:28; 26: 1:23, 11:19, 21:15; 27: 7:11, 17:07; 28: 3:03, 12:58, 22:54; 29: 8:50, 18:46; 30: 4:42, 14:38

December 1: 0:33, 10:29, 20:25; 2: 6:21, 16:17; 3: 2:13, 12:08, 22:04; 4: 8:00, 17:56; 5: 3:52, 13:48, 23:43; 6: 9:39, 19:35; 7: 5:31, 15:27; 8: 1:22, 11:18, 21:14; 9: 7:10, 17:06; 10: 3:02, 12:58, 22:53; 11: 8:49, 18:45; 12: 4:41, 14:37; 13: 0:33, 10:28, 20:24; 14: 6:20, 16:16; 15: 2:12, 12:08, 22:03; 16: 7:59, 17:55; 17: 3:51, 13:47, 23:43; 18: 9:39, 19:34; 19: 5:30, 15:26; 20: 1:22, 11:18, 21:14; 21: 7:09, 17:05; 22: 3:01, 12:57, 22:53; 23: 8:49, 18:45; 24: 4:40, 14:36; 25: 0:32, 10:28, 20:24; 26: 6:20, 16:16; 27: 2:11, 12:07, 22:03; 28: 7:59, 17:55; 29: 3:51, 13:46, 23:42; 30: 9:38, 19:34; 31: 5:30, 15:26

And get thee out there with a telescope… Dueling Red Spots will be fun to watch!

Many thanks to John Chumack of Northern Galactic for sharing his image with us and to Sky & Telescope Magazine for the GRS transit prediction times!

Bolden Revamps NASA Advisory Council

Miles O'Brien

[/caption]
NASA Administrator Charles Bolden has restructured the NASA Advisory Council (NAC), adding several new committees in key areas of importance to the agency’s future, including Education and Public Outreach, led by former CNN anchor Miles O’Brien and a Commercial Space, Information Technology Infrastructure committee led by Brett Alexander, the executive director of the Commercial Spaceflight Federation. “I consider the NASA Advisory Council to be an extremely important external advisory group, one that is uniquely capable to advise me and the entire NASA senior leadership team on some of the important decisions our agency will face in the coming months and years,” Bolden said. “I am confident that this new structure will serve as an effective forum to stimulate meaningful advice to me and the rest of NASA’s leadership.”

Other new committees include a technology and innovation panel led by Esther Dyson, an information technology investor and space travel enthusiast and an information technology infrastructure committee led by retired U.S. Air Force Lt. Gen. Al Edmonds, to deal with cyber security issues.
The NAC held their first meeting with the restructured NASA Advisory Council last week at the
Ames Research Center at Moffett Field, Calif.

The council’s members provide advice and make recommendations to the NASA administrator about agency programs, policies, plans, financial controls and other matters pertinent to NASA’s responsibilities. The chairs for the council and its committees are:

NASA Advisory Council: Kenneth M. Ford
Aeronautics Committee: Marion Blakey
Audit, Finance and Analysis Committee: Robert M. Hanisee
Commercial Space Committee: Brett Alexander
Education and Public Outreach: Miles O’Brien
Exploration Committee: retired Air Force Gen. Lester L. Lyles
Science Committee: Wesley T. Huntress, Jr.
Space Operations Committee: former astronaut and retired Air Force
Col. Eileen M. Collins
Technology and Innovation Committee: Esther Dyson

An appointment is pending for the Information Technology and
Infrastructure Committee.

Raymond S. Colladay represents the National Academies’ Aeronautics and
Space Engineering Board, and Charles F. Kennel represents the
National Academies’ Space Studies Board as ex officio members.

Two ESA Satellites Launch Successfully

UPDATE: Information about both SMOS and the Proba-2 satelite are on ESA Television. The program loop is embedded at the bottom of this post. Enjoy!

Last night at 2:50 am Central European Time, two European Space Agency (ESA) satellites were successfully launched from the Plesetsk Cosmodrome in Northern Russia. The Rockot launch vehicle was carrying both the Soil Moisture and Ocean Salinity (SMOS) satellite, and the Proba-2 satellite. SMOS will monitor the moisture exchange of the Earth between the ocean, air and land as well as the salinity of the oceans and the moisture of the soil in an effort to better understand how these factors influence the climate of our planet. Proba-2 will test out various instruments, including a small wide angle optical camera, and instruments for monitoring the plasma environment in orbit and the Sun’s corona.

SMOS is part of the ESA’s Earth Observation Envelope Program, an initiative to study in scientific detail from space the ongoing changes of the Earth. The GOCE satellite launched earlier this year to study the Earth’s gravity field and ocean circulation is another part of this program.

SMOS is the first satellite designed with the intent of measuring ocean salinity from space. To do this, it will implement a multi-part microwave antenna to monitor the oceans at a wavelength of about 23cm. At this frequency, an antenna of 5-10 meters (15-30 feet) is needed to make the measurements. This is too large to fit into a standard rocket payload bay, so the mission engineers employed what is called ‘synthetic aperture synthesis’. This is a technique used in radio astronomy that strings together separate antennae in different places, allowing the antennae to act as one larger antenna. A perfect example of this is the Very Large Array in New Mexico. The SMOS antenna has three foldable arms that are 3 meters (6 feet) long apiece, and extend to form a Y shape. Along the arms are 69 small antennae that all act together to take measurements as if they were one larger antenna.

Volker Liebig, ESA’s Director of Earth Observation Programs said in an ESA press release:

“The data collected by SMOS will complement measurements already performed on the ground and at sea to monitor water exchanges on a global scale. Since these exchanges – most of which occur in remote areas – directly affect the weather, they are of paramount importance to meteorologists. Moreover, salinity is one of the drivers for the Thermohaline Circulation, the large network of currents that steers heat exchanges within the oceans on a global scale, and its survey has long been awaited by climatologists who try to predict the long-term effects of today’s climate change.”

The Proba-2 satellite is the second in a series of ESA missions to test out new technologies in space. Image Credit:ESA
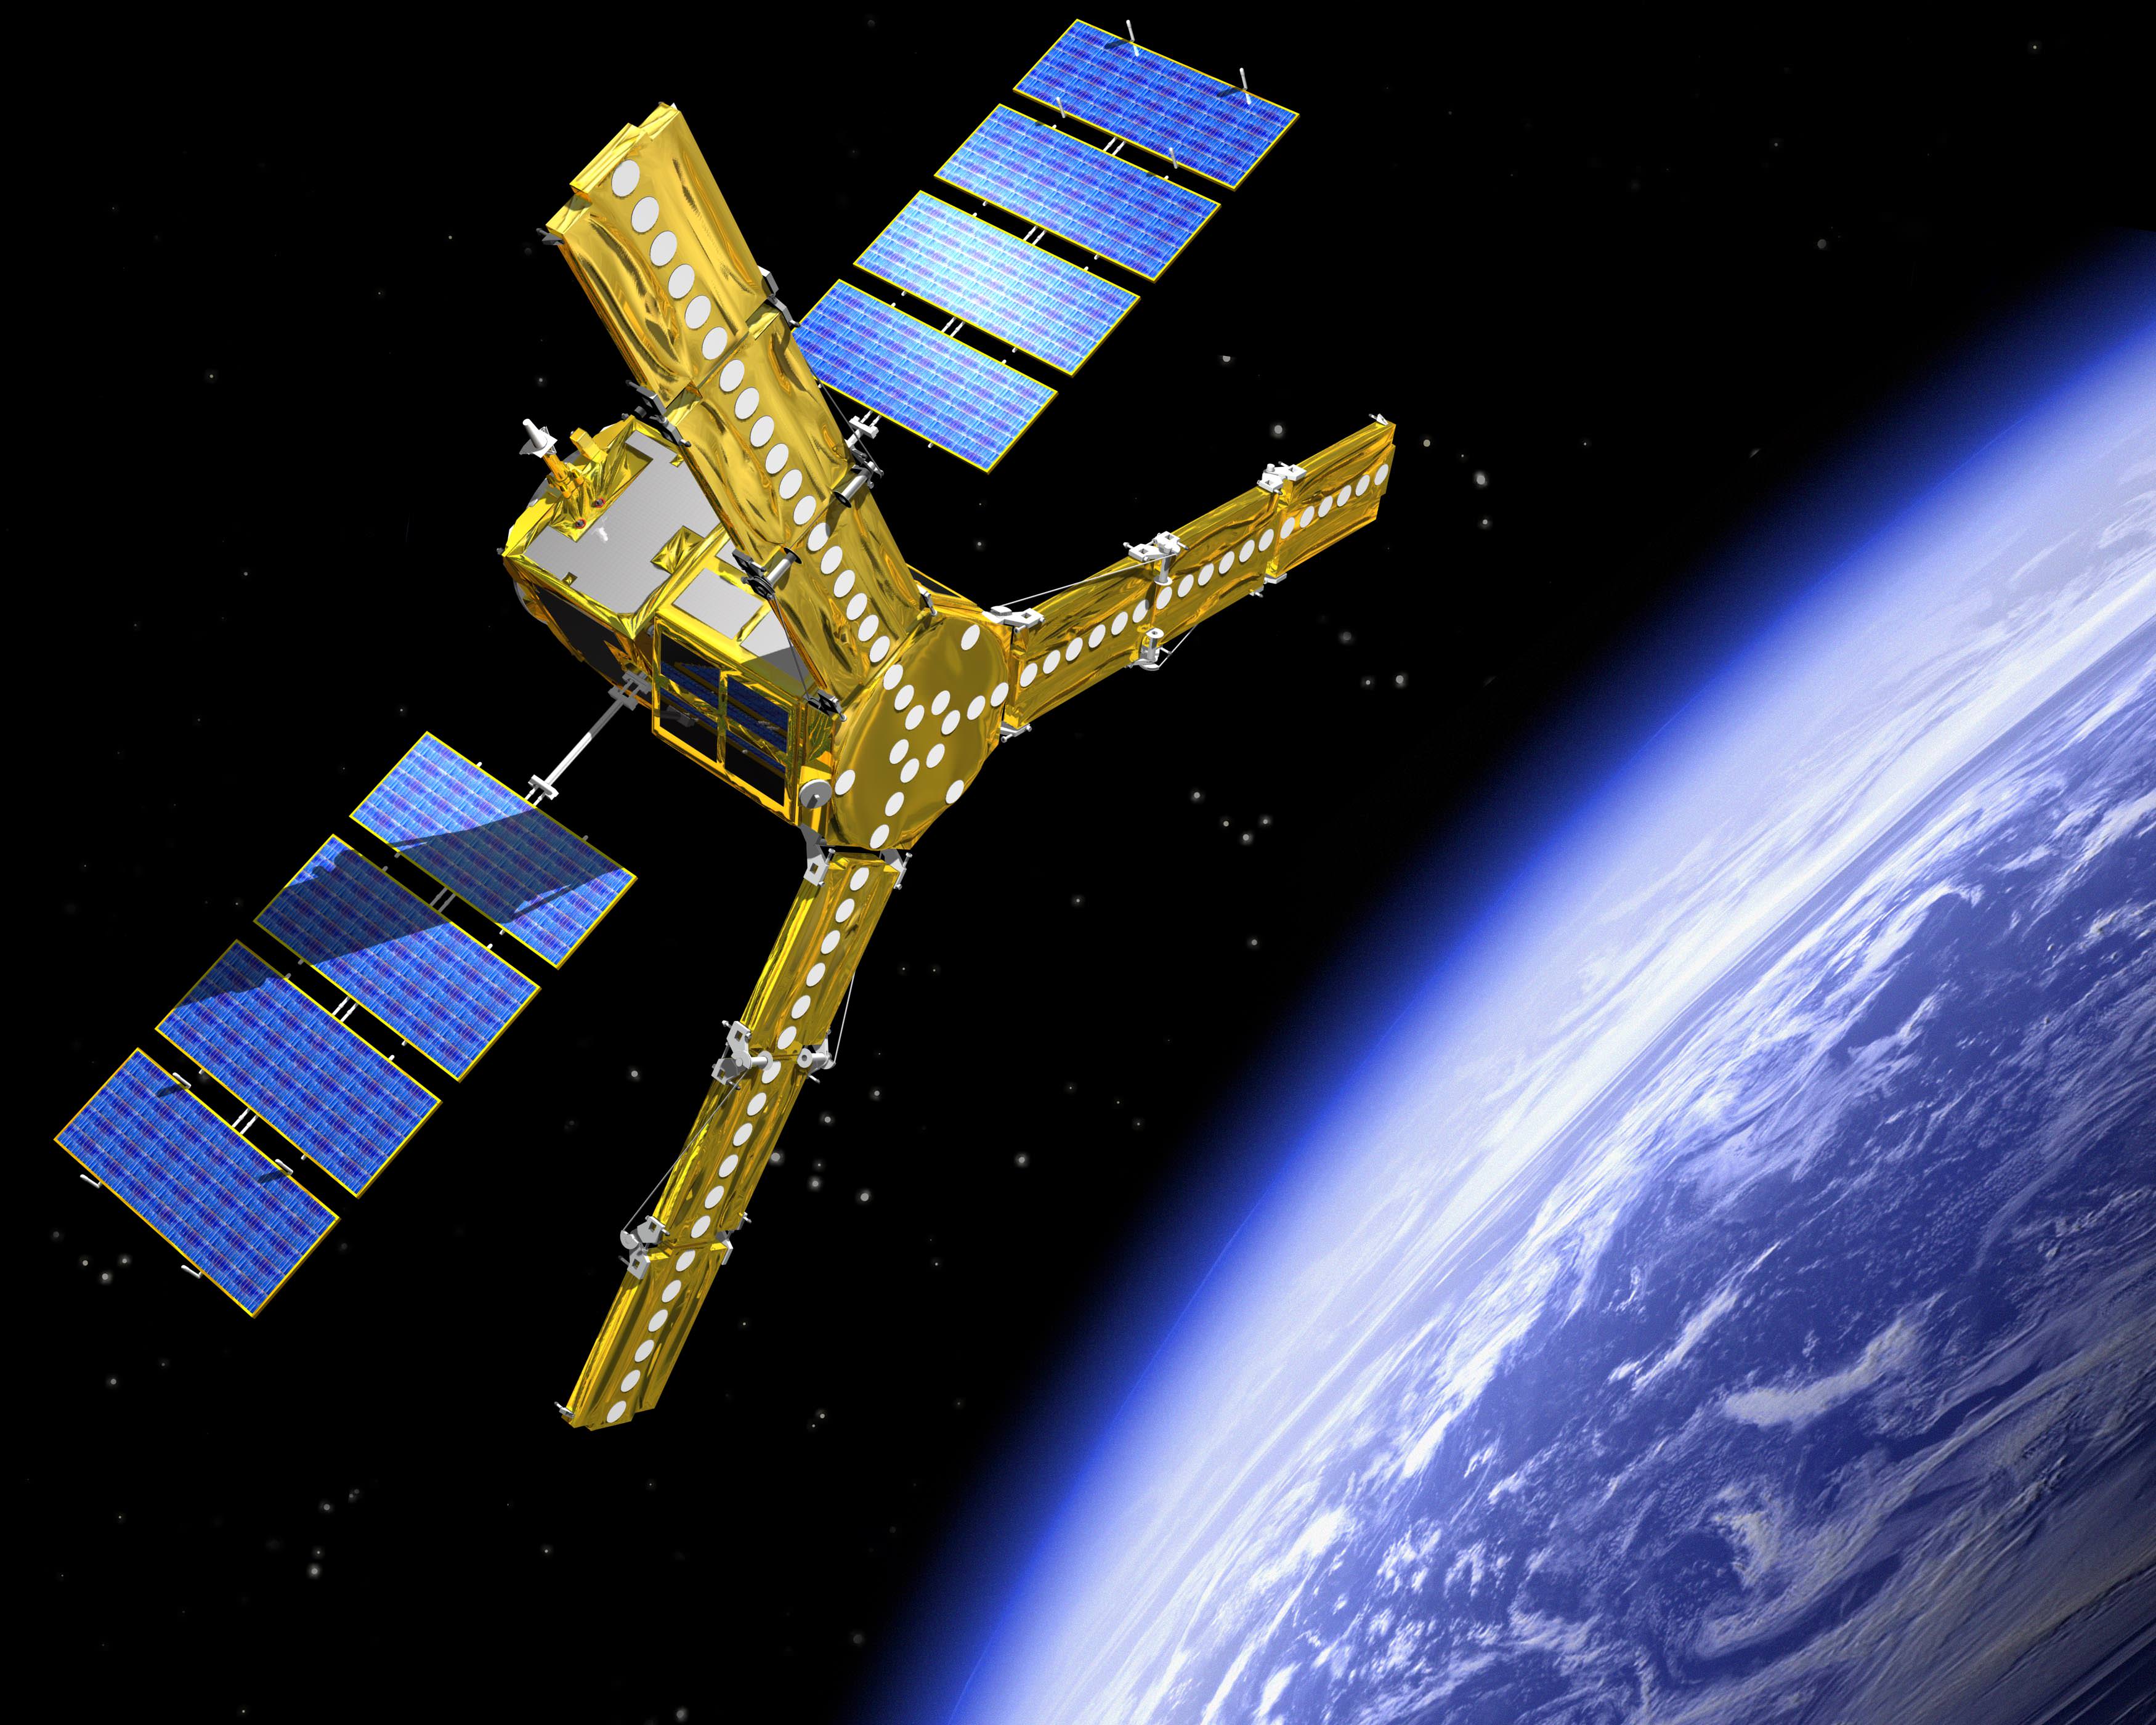
The other satellite piggybacking on the SMOS mission launch is the suitcase-sized Proba-2, part of  a series of missions in the ESA’s General Support Technology Program to test out new technology in space for further development on other ESA missions. Proba-2 is carrying a digital sun sensor, a high-precision magnetometer, and dual frequency GPS space receiver among other instruments for a Belgian study of solar physics and Czech study of plasma physics.

Both satellites arrived in their sun-synchronous orbits, and initial systems checks indicate that both are operating as expected. SMOS will orbit at 760 km (472 miles) above the Earth, and Proba-2 at 725 km (450 miles). SMOS, once calibrated, will reach full operational status in about six months, and Proba-2 will become fully operation in two months.

Source: ESA, Eurekalert

How Fast is the Speed of Light?

You may think that a lot of things are fast, like speeding bullets and Superman and the passage of time when you are having fun. But all of these things are nothing compared to the speed of light, which is the fastest that something can travel through the Universe. The speed of light is sometimes referred to as the “cosmic speed limit”. Light travels in a vacuum at 186,282.4 miles per second or 299,792,458 meters/second. For simplicity, it is often said that these numbers are 186,000 miles per second, and 3.00 x 10^8 meters per second.

How fast is this in normal terms? Well, the record for the fastest aircraft is held by the Boeing x-43 scramjet. Scramjets are single-use unmanned aircraft designed to go at hypersonic speeds. The x-43 traveled at  12,144 km/h (7,546 mph), or Mach 9.8, on November 16th, 2004. That is .000405% of the speed of light. And this is a jet that can travel from New York to Los Angeles in 20 minutes. While it takes photons about 8 minutes to travel the distance from the Sun to the Earth – at its furthest, 152 million km (94.4 million miles) – this scramjet traveling at its maximum speed would take about 522 days!

The speed of light is really fast, and at this speed some bizarre things start to happen. First off, photons can only travel this speed because they have zero rest mass, meaning that if you were to somehow trap a photon and put it on a scale, it would have no mass. It’s virtually impossible for something with mass to travel this speed, because as you get faster and faster, it takes more and more energy to get you to the speed of light, which makes you heavier, which requires more energy, etc. Time also changes when you get to these speeds. If you left the Earth going the speed of light, then came back around and landed, you would perceive time as moving normally, but when you returned it would seem as if time sped up for everybody on the Earth, and all of your friends and family would be much, much older.

The speed of light is not constant in all materials, though, and can be slowed down. Here’s an excellent article on how researchers can slow down the speed of light by passing it through different materials, with the slowest speed being 38 miles per hour!

To learn more about the speed of light – and there is a lot, lot more to learn, check out the Astronomy Cast questions shows from October 26, 2008June 4, 2009 and September 26, 2008, or the Physics section in the Guide to Space.

Sources:
Wikipedia
NASA

What is a Subduction Zone?

Transform Plate Boundary
Tectonic Plate Boundaries. Credit:

IF you don’t know anything about plate tectonics you might be wondering about what is a subduction zone. A subduction zone is a region of the Earth’s crust where tectonic plates meet. Tectonic plates are massive pieces of the Earth’s crust that interact with each other. The places where these plates meet are called plate boundaries. Plate boundaries occur where plates separate, slide alongside each other or collide into each other. Subduction zones happen where plates collide.

When two tectonic plates meet it is like the immovable object meeting the unstoppable force. However tectonic plates decide it by mass. The more massive plate, normally a continental will force the other plate, an oceanic plate down beneath it. This is the subduction zone. When the other plate is forced down the process is called subduction. The plate enters into the magma and eventually it is completely melted. That is how the surface of the earth makes way for the crust created over time at other plate boundaries.

Subduction zones have key characteristics that help geologist and seismologist identify them. The first is mountain formation. Subduction zones always have mountain ranges caused by plate subduction. The next is volcanic activity as a plate is subducted the pressure and heat turns it into magma. These pockets of magma find paths to the surface and create volcanoes. A good example is the subduction zone near Chile. The final sign is deep marine trenches. These are the best evidence of a subduction zone as they are visible evidence of the crease formed by subduction of a plate. The most famous is the Mariana Trench.

There are some interesting theories about why Subduction occurs in the Earth’s crust. One common theory is that subduction was initiated by major impacts by asteroids or comets early in Earth’s history. This makes a lot of sense due to the geologic evidence of large impacts scattered around the world.

Understanding how subduction zones work is important because it helps scientist to identify areas of high volcanic and seismic activity. Monitoring these areas can help them warn people who live near them of imminent events and also people who could be affected by the side effects of such events such as ash clouds or tsunamis.

Subduction continues to be one of the most powerful and dynamic processes on planet Earth and as technology improves we can come to understand more about this amazing process.

We have written many articles about the subduction zone for Universe Today. For example, here is one on the Ring of Fire and plate boundaries.

You should also check out plate tectonics and subduction.

If you’d like more info on the subduction zone, check out the U.S. Geological Survey Website. And here’s a link to NASA’s Earth Observatory.

We’ve also recorded related episodes of Astronomy Cast about Plate Tectonics. Listen here, Episode 142: Plate Tectonics.

Sources:
http://en.wikipedia.org/wiki/Subduction
http://myweb.cwpost.liu.edu/vdivener/notes/subd_zone.htm

Subduction is a process in geology where one tectonic plates slides underneath another one and merges into the Earth’s mantle. The denser plate is the one that slips under the less dense plate; the younger plate is the less dense one. The process is not a smooth one. The tectonic plates grate against each other, which often causes earthquakes. The plate that slips under does not stay that way. Due to the heat caused by it rubbing against the other plate as well as the natural heat of the mantle, the plate melts and turns into magma. The area where subduction occurs is known as the subduction zone.

When one plate begins to slip underneath another one a trench is formed. The earthquakes that result due to the plates grinding against each other often cause magma to spill out through the trench in submarine volcanoes. Various formations such as mountain ranges, islands, and trenches are caused by subduction and the volcanoes and earthquakes it triggers. In addition to causing earthquakes, subduction can also trigger tsunamis.

When the older plate is holding a continent however, it does not sink, which is reassuring. Instead, the less dense material slips into a trench behind the denser oceanic crust where it gets stuck. The pressure continues to build until the trench flips over and the less dense plate slips underneath the one with the continent.

It is possible for a whole tectonic plate to disappear. This happens when the plate goes through subduction faster than new material can be added to the plate through seafloor spreading. The spreading pushes the plate slowly toward the subduction zone until the whole thing disappears. When this happens, the other tectonic plates rearrange to cover the area.

Subduction zones are mainly located in the Pacific Ocean. This is because seafloor spreading – the process by which new oceanic crust is created – occurs mostly in the Pacific. Thus the new material pushes the older plates outward and then they need to undergo subduction. This also explains why so many earthquakes originate in the Pacific Ocean near the Ring of Fire. That is where the subduction zones are concentrated.

Continental plates also converge, but this is not considered subduction because these plates do not have different densities and thicknesses to subduct. Landforms such as the Himalayas are formed from these convergences though.