New Images from Planck Reveal Star Formation Processes

An active star-formation region in the Orion Nebula, as seen By Planck. Credits: ESA/LFI & HFI Consortia

[/caption]
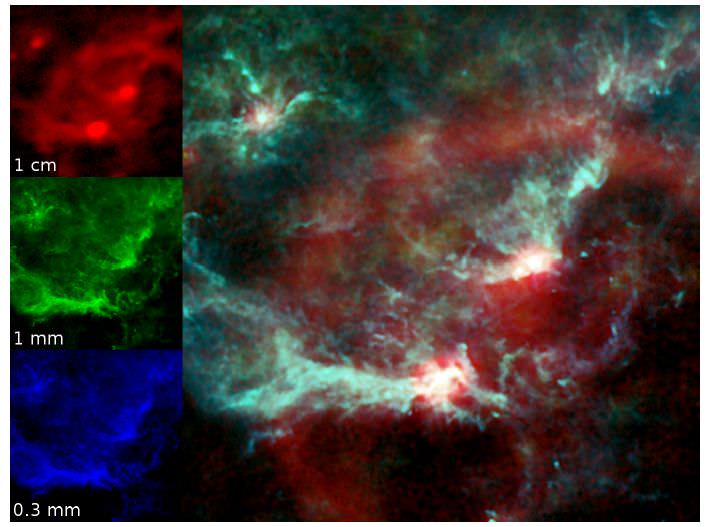
While most newborn stars are hidden beneath a blanket of gas and dust, the Planck space observatory – with its microwave eyes – can peer beneath that shroud to provide new insights into star formation. The latest images released by the Planck team bring to light two different star forming regions in the Milky Way, and in stunning detail, reveal the different physical processes at work.

“Seeing” across nine different wavelengths, Planck took at look at star forming regions in the constellations of Orion and Perseus. The top image shows the interstellar medium in a region of the Orion Nebula where stars are actively forming in large numbers. “The power of Planck’s very wide wavelength coverage is immediately apparent in these images,” said Peter Ade of Cardiff University, co-Investigator on Planck. “The red loop seen here is Barnard’s Loop, and the fact that it is visible at longer wavelengths tells us that it is emitted by hot electrons, and not by interstellar dust. The ability to separate the different emission mechanisms is key for Planck’s primary mission.”

A comparable sequence of images, below, showing a region where fewer stars are forming near the constellation of Perseus, illustrates how the structure and distribution of the interstellar medium can be distilled from the images obtained with Planck.

This sequence of images, showing a region where fewer stars are forming near the constellation of Perseus, illustrates how the structure and distribution of the interstellar medium can be distilled from the images obtained with Planck. Credit: ESA / HFI and LFI Consortia

At wavelengths where Planck’s sensitive instruments observe, the Milky Way emits strongly over large areas of the sky. This emission arises primarily from four processes, each of which can be isolated using Planck. At the longest wavelengths, of about a centimeter, Planck maps the distribution of synchrotron emission due to high-speed electrons interacting with the magnetic fields of our Galaxy. At intermediate wavelengths of a few millimeters the emission is dominated by ionized gas being heated by newly formed stars. At the shortest wavelengths, of around a millimeter and below, Planck maps the distribution of interstellar dust, including the coldest compact regions in the final stages of collapse towards the formation of new stars.

“The real power of Planck is the combination of the High and Low Frequency Instruments which allow us, for the first time, to disentangle the three foregrounds,” said Professor Richard Davis of the University of Manchester’s Jodrell Bank Centre for Astrophysics. “This is of interest in its own right but also enables us to see the Cosmic Microwave Background far more clearly.”

Once formed, the new stars disperse the surrounding gas and dust, changing their own environment. A delicate balance between star formation and the dispersion of gas and dust regulates the number of stars that any given galaxy makes. Many physical processes influence this balance, including gravity, the heating and cooling of gas and dust, magnetic fields and more. As a result of this interplay, the material rearranges itself into ‘phases’ which coexist side-by-side. Some regions, known as ‘molecular clouds,’ contain dense gas and dust, while others, referred to as ‘cirrus’ (which look like the wispy clouds we have here on Earth), contain more diffuse material.

Location of the Planck images in Orion and Perseus. ESA / HFI and LFI Consortia, STSci/DSS/IRAS (background image)

Since Planck can look across such a wide range of frequencies, it can, for the first time, provide data simultaneously on all the main emission mechanisms. Planck’s wide wavelength coverage, which is required to study the Cosmic Microwave Background, proves also to be crucial for the study of the interstellar medium.

“The Planck maps are really fantastic to look at,” said Dr. Clive Dickinson, also of the University of Manchester. “These are exciting times.”

Planck maps the sky with its High Frequency Instrument (HFI), which includes the frequency bands 100-857 GHz (wavelengths of 3mm to 0.35mm), and the Low Frequency Instrument (LFI) which includes the frequency bands 30-70 GHz (wavelengths of 10mm to 4mm).

The Planck team will complete its first all-sky survey in mid-2010), and the spacecraft will continue to gather data until the end of 2012, during which time it will complete four sky scans. To arrive at the main cosmology results will require about two years of data processing and analysis. The first set of processed data will be made available to the worldwide scientific community towards the end of 2012.

Source: ESA and Cardiff University

Universe Puzzle No. 11

How did you do in last week’s Universe Puzzle?

Do you enjoy these puzzles? What do you particularly like? Dislike? Would like to see changed? Would like to see more of? Let me know please!

Once again, this week’s puzzle requires you to cudgel your brains a bit and do some lateral thinking (five minutes spent googling likely won’t be enough). But, as with all Universe Puzzles, this is a puzzle on a “Universal” topic – astronomy and astronomers; space, satellites, missions, and astronauts; planets, moons, telescopes, and so on.

Where is the green valley? What are the hills/mountain range(s)/ridges which border it? How did it get its name?

UPDATE: Answer has been posted below.

The green valley I had in mind is indeed the region in a color-magnitude diagram of galaxies, between the red sequence and blue cloud. In this case five minutes spent googling would have given you this answer (so not really a Universe Puzzle).

It got its name because, first, between red and blue comes green, and second because one way of representing the number of galaxies per unit area in a chart (or graph) of their color vs luminosity is to draw contours (if the chart is representing hundreds of thousands of galaxies then plotting them all as points becomes visually bland, shall we say). And what does a chart with contour lines on it remind you of? A topographic map! So the red sequence and blue cloud would be ridges or mountains, and in between would be a …. valley.

At the time I accessed it, the Wikipedia entry is a good summary (with Wikipedia you have to be very careful that the contents of an entry haven’t changed!)

Check back next week for another Universe Puzzle!

GOODS, Under Astronomers’ AEGIS, Produce GEMS

No, not really (but I got all three key words into the title in a way that sorta makes sense).

Astronomers, like most scientists, just love acronyms; unfortunately, like most acronyms, on their own the ones astronomers use make no sense to non-astronomers.

And sometimes not even when written in full:
GOODS = Great Observatories Origins Deep Survey; OK that’s vaguely comprehensible (but what ‘origins’ is it about?)
AEGIS = All-wavelength Extended Groth strip International Survey; hmm, what’s a ‘Groth’?
GEMS = Galaxy Evolution from Morphology and SEDs; is Morphology the study of Morpheus’ behavior? And did you guess that the ‘S’ stood for ‘SEDs’ (not ‘Survey’)?

But, given that these all involve a ginormous amount of the ‘telescope time’ of the world’s truly great observatories, to produce such visually stunning images as the one below (NOT!), why do astronomers do it?

GEMS tile#58 (MPIfA)


Astronomy has made tremendous progress in the last century, when it comes to understanding the nature of the universe in which we live.

As late as the 1920s there was still debate about the (mostly faint) fuzzy patches that seemed to be everywhere in the sky; were the spiral-shaped ones separate ‘island universes’, or just funny blobs of gas and dust like the Orion nebula (‘galaxy’ hadn’t been invented then)?

Today we have a powerful, coherent account of everything we see in the night sky, no matter whether we use x-ray eyes, night vision (infrared), or radio telescopes, an account that incorporates the two fundamental theories of modern physics, general relativity and quantum theory. We say that all the stars, emission and absorption nebulae, planets, galaxies, supermassive black holes (SMBHs), gas and plasma clouds, etc formed, directly or indirectly, from a nearly uniform, tenuous sea of hydrogen and helium gas about 13.4 billion years ago (well, maybe the SMBHs didn’t). This is the ‘concordance LCDM cosmological model’, known popularly as ‘the Big Bang Theory’.

But how? How did the first stars form? How did they come together to form galaxies? Why did some galaxies’ nuclei ‘light up’ to form quasars (and others didn’t)? How did the galaxies come to have the shapes we see? … and a thousand other questions, questions which astronomers hope to answer, with projects like GOODS, AEGIS, and GEMS.

The basic idea is simple: pick a random, representative patch of sky and stare at it, for a very, very long time. And do so with every kind of eye you have (but most especially the very sharp ones).

By staring across as much of the electromagnetic spectrum as possible, you can make a chart (or graph) of the amount of energy is coming to us from each part of that spectrum, for each of the separate objects you see; this is called the spectral energy distribution, or SED for short.

By breaking the light of each object into its rainbow of colors – taking a spectrum, using a spectrograph – you can find the tell-tale lines of various elements (and from this work out a great deal about the physical conditions of the material which emitted, or absorbed, the light); “light” here is shorthand for electromagnetic radiation, though mostly ultraviolet, visible light (which astronomers call ‘optical’), and infrared (near, mid, and far).

By taking really, really sharp images of the objects you can classify, categorize, and count them by their shape, morphology in astronomer-speak.

And because the Hubble relationship gives you an object’s distance once you know its redshift, and as distance = time, sorting everything by redshift gives you a picture of how things have changed over time, ‘evolution’ as astronomers say (not to be confused with the evolution Darwin made famous, which is a very different thing).

GOODS

The great observatories are Chandra, XMM-Newton, Hubble, Spitzer, and Herschel (space-based), ESO-VLT (European Southern Observatory Very Large Telescope), Keck, Gemini, Subaru, APEX (Atacama Pathfinder Experiment), JCMT (James Clerk Maxwell Telescope), and the VLA. Some of the observing commitments are impressive, for example over 2 million seconds using the ISAAC instrument (doubly impressive considering that ground-based facilities, unlike space-based ones, can only observe the sky at night, and only when there is no Moon).

There are two GOODS fields, called GOODS-North and GOODS-South. Each is a mere 150 square arcminutes in size, which is tiny, tiny, tiny (you need five fields this size to completely cover the Moon)! Of course, some of the observations extend beyond the two core 150 square arcminutes fields, but every observatory covered every square arcsecond of either field (or, for space-based observatories, both).

GOODS-N ACS fields (GOODS/STScI)

GOODS-N is centered on the Hubble Deep Field (North is understood; this is the first HDF), at 12h 36m 49.4000s +62d 12′ 58.000″ J2000.
GOODS-S ACS fields (GOODS/STScI)

GOODS-S is centered on the Chandra Deep Field-South (CDFS), at 3h 32m 28.0s -27d 48′ 30″ J2000.

The Hubble observations were taken using the ACS (Advanced Camera for Surveys), in four wavebands (bandpasses, filters), which are approximately the astronomers’ B, V, i, and z.

Extended Groth Strip fields (AEGIS)

AEGIS

The ‘Groth’ refers to Edward J. Groth who is currently at the Physics Department of Princeton University. In 1995 he presented a ‘poster paper’ at the 185th meeting of the American Astronomical Society entitled “A Survey with the HST“. The Groth strip is the 28 pointings of the Hubble’s WFPC2 camera in 1994, centered on 14h 17m +52d 30′. The Extended Groth Strip (EGS) is considerably bigger than the GOODS fields, combined. The observatories which have covered the EGS include Chandra, GALEX, the Hubble (both NICMOS and ACS, in addition to WFPC2), CFHT, MMT, Subaru, Palomar, Spitzer, JCMT, and the VLA. The total area covered is 0.5 to 1 square degree, though the Hubble observations cover only ~0.2 square degrees (and only 0.0128 for the NICMOS ones). Only two filters were used for the ACS observations (approximately V and I).

I guess you, dear reader, can work out why this is called an ‘All wavelength’ and ‘International Survey’, can’t you?

GEMS' ACS fields (MPIfA)

GEMS

GEMS is centered on the CDFS (Chandra Deep Field-South, remember?), but covers a much bigger area than GOODS-S, 900 square arcminutes (the largest contiguous field so far imaged by the Hubble at the time, circa 2004; the COSMOS field is certainly larger, but most of it is monochromatic – I band only – so the GEMS field is the largest contiguous color one, to date). It is a mosaic of 81 ACS pointings, using two filters (approximately V and z).

Its SEDs component comes largely from the results of a previous large project covering the same area, called COMBO-17 (Classifying Objects by Medium-Band Observations – a spectrophotometric 17-band survey).

Sources: GOODS (STScI), GOODS (ESO), AEGIS, GEMS, ADS
Special thanks to reader nedwright for catching the error re GEMS (and thanks to to readers who have emailed me with your comments and suggestions; much appreciated)

Astronomy Without A Telescope – The Nice Way To Build A Solar System

When considering how the solar system formed, there are a number of problems with the idea of planets just blobbing together out of a rotating accretion disk. The Nice model (and OK, it’s pronounced ‘niece’ – as in the French city) offers a better solution.

In the traditional Kant/Laplace solar nebula model you have a rotating protoplanetary disk within which loosely associated objects build up into planetesimals, which then become gravitationally powerful centres of mass capable of clearing their orbit and voila planet!

It’s generally agreed now that this just can’t work since a growing planetesimal, in the process of constantly interacting with protoplanetary disk material, will have its orbit progressively decayed so that it will spiral inwards, potentially crashing into the Sun unless it can clear an orbit before it has lost too much angular momentum.

The Nice solution is to accept that most planets probably did form in different regions to where they orbit now. It’s likely that the current rocky planets of our solar system formed somewhat further out and have moved inwards due to interactions with protoplanetary disk material in the very early stages of the solar system’s formation.

It is likely that within 100 million years of the Sun’s ignition, a large number of rocky protoplanets, in eccentric and chaotic orbits, engaged in collisions – followed by the inward migration of the last four planets left standing as they lost angular momentum to the persisting gas and dust of the inner disk. This last phase may have stabilised them into the almost circular, and only marginally eccentric, orbits we see today.

The hypothesized collision between 'Earth Mk 1' and Theia may have occurred late in rocky planet formation creating the Earth as we know it with its huge Moon of accreted impact debris

Meanwhile, the gas giants were forming out beyond the ‘frost line’ where it was cool enough for ices to form. Since water, methane and CO2 were a lot more abundant than iron, nickel or silicon – icy planetary cores grew fast and grew big, reaching a scale where their gravity was powerful enough to hold onto the hydrogen and helium that was also present in abundance in the protoplanetary disk. This allowed these planets to grow to an enormous size.

Jupiter probably began forming within only 3 million years of solar ignition, rapidly clearing its orbit, which stopped it from migrating further inward. Saturn’s ice core grabbed whatever gases Jupiter didn’t – and Uranus and Neptune soaked up the dregs. Uranus and Neptune are thought to have formed much closer to the Sun than they are now – and in reverse order, with Neptune closer in than Uranus.

And then, around 500 million years after solar ignition, something remarkable happened. Jupiter and Saturn settled into a 2:1 orbital resonance – meaning that they lined up at the same points twice for every orbit of Saturn. This created a gravitational pulse that kicked Neptune out past Uranus, so that it ploughed in to what was then a closer and denser Kuiper Belt.

The result was a chaotic flurry of Kuiper Belt Objects, many being either flung outwards towards the Oort cloud or flung inwards towards the inner solar system. These, along with a rain of asteroids from a gravitationally disrupted asteroid belt, delivered the Late Heavy Bombardment which pummelled the inner solar system for several hundred million years – the devastation of which is still apparent on the surfaces of the Moon and Mercury today.

Then, as the dust finally settled around 3.8 billion years ago and as a new day dawned on the third rock from the Sun – voila life!

Hubble, Renewed, Reinvigorated, Raring to Go

Hubble Ultra-Deep Field (WFC3) Click for zoomable image


Note: To celebrate the 20th anniversary of the Hubble Space Telescope, for ten days, Universe Today has featured highlights from two year slices of the life of the Hubble, focusing on its achievements as an astronomical observatory. Today’s article looks at the last two years, to April 2010.

The stakes for the fifth, and final, Hubble servicing mission couldn’t have been higher; not only were two new instruments to be installed (a relatively straight-forward task), not only was much of key infrastructure to be replaced (batteries, fine-guidance sensors, thermal blankets), but intricate repairs had to be performed on the two most complicated instruments (ACS and STIS), something not in the design, something difficult enough in a well-appointed lab on Earth much less done by astronauts in bulky space suits. The servicing mission was postponed, as it became clear that the work to be done was more extensive; but in May 2009 STS-125, involving five full days of space walks and 11 days in space, met all the objectives.

And a little under four months later, after extensive testing and calibration, the Hubble was back in the astronomy business.

This image is the Hubble Ultra-Deep Field (HUDF), as seen by WFC3 in the infrared (now that Hubble Zoo is live, you will have a chance to analyze fields like this yourself!)
[/caption]

MACS J0025.4-1222 (NASA, ESA, CXC, M. Bradac (UC, Santa Barbara), S. Allen (Stanford) Click for zoomable

MACS J0025.4-1222 is not as well known as the Bullet Cluster, but perhaps it should be. One of the really big, open questions in astronomy today is the nature of dark matter; observations of the Bullet Cluster point to dark matter being a form of matter that does not interact with normal (baryonic) matter, except gravitationally. But perhaps the Bullet Cluster is just an anomaly, or perhaps we don’t really understand what’s going on? In astronomy, as in all science, independent verification is key, and what better way to provide that, for dark matter, than to observe another interacting cluster? “Revealing the Properties of Dark Matter in the Merging Cluster MACS J0025.4-1222” is the paper to read, and Hubble’s ACS provided many of the key observations.
Fomalhaut's exoplanet (NASA, ESA, P. Kalas (UC, Berkeley))

A direct image of an exoplanet, and an estimate of its orbit; the coronagraph on ACS blocked out most of the light of Fomalhaut so its planet – Fomalhaut b – could be seen.

Arp194 (NASA, ESA, Hubble Heritage Team (STScI/AURA)) Click for zoomable image

WFPC2 was removed during SM4 (and replaced by WFC3); this was Hubble’s workhorse camera for some 16 years, the camera which just kept on working. It is fitting then that one of its last images is of Arp 194, dubbed ‘the fountain of youth’.

Happy Birthday Hubble!

Previous articles:
Hubble’s Late Teen Years: It Was the Best of Times, It Was the Worst of Times
Hubble Turns Sixteen, and Just Keeps on Working
Hubble Enters its Teen Years, More Powerful, More Ambitious
Hubble’s 20th: At Least as Good as Any Human Photographer
Hubble’s 10th Birthday Gift: Measurement of the Hubble Constant
Hubble at 8: So Many Discoveries, So Quickly
Hubble’s 20 Years: Now We Are Six
Hubble’s 20 Years: Time for 20/20 Vision
Hubble: It Was Twenty Years Ago Today

Sources: HubbleSite, European Homepage for the NASA/ESA Hubble Space Telescope, The SAO/NASA Astrophysics Data System

Shock Waves, Volcanic Bombs From Eyjafjallajokull

The volcano in Iceland keeps producing eye-popping effects. Now that the ash isn’t spewing quite so dramatically,the mouth of the volcano itself is visible. Here’s close-up aerial footage of the crater at Eyjafjallajokull, with glowing red lava and shockwaves of the eruptions in the ash cloud. Incredible.

If you haven’t yet seen images taken by Astronomer Snaevarr Gudmundsson from Iceland, he was just a few kilometers away from the volcano last Saturday, at the height of the action — including lighting in the plume. So check them out.

There are many other great images on across the webs — take a look at The Daily Mail website of the eruption with a unique backdrop of a stunning aurora, or these on Discovery News.

Hubble’s Birthday Gift to Us: Mystic Mountain

This brand new Hubble photo is of a small portion of one of the largest seen star-birth regions in the galaxy, the Carina Nebula. Credit: NASA, ESA, and M. Livio and the Hubble 20th Anniversary Team (STScI)

[/caption]

Happy 20th Birthday to the Hubble Space Telescope! While we should be showering HST with gifts, instead the telescope provides this present to us: an amazing view of what has been nicknamed “Mystic Mountain. ” It is just a small portion of one of the largest known star-birth regions in the galaxy, the Carina Nebula. Three light-year-tall towers of cool hydrogen laced with dust rise from the wall of the nebula. The scene is reminiscent of Hubble’s classic “Pillars of Creation” photo from 1995, but even more striking. “Mystic Mountain has clouds of gas and dust, that have not only baby stars, but also baby solar systems,” said John Grunsfeld, Hubble-hugger, repairman and now the Deputry Director of the Space Telescope Science Institute. “4.5 billion years ago, this may be what our solar system looked like.”

Would you like to wish Hubble a happy birthday?

Hubble fans worldwide are being invited to take an interactive journey with Hubble. They can also visit Hubble Site to share the ways the telescope has affected them. Follow the “Messages to Hubble” link to send an e-mail, post a Facebook message, or send a cell phone text message. Fan messages will be stored in the Hubble data archive along with the telescope’s science data. For those who use Twitter, you can follow @HubbleTelescope or post tweets using the Twitter hashtag #hst20.

These two images of a three-light-year-high pillar of star birth demonstrate how observations taken in visible and infrared light by NASA's Hubble Space Telescope reveal dramatically different and complementary views of an object. Credit: NASA, ESA, and M. Livio and the Hubble 20th Anniversary Team (STScI) › Larger image

Hubble launched on April 24, 1990.

“Hubble is undoubtedly one of the most recognized and successful scientific projects in history,” said Ed Weiler, associate administrator for the Science Mission Directorate at NASA Headquarters in Washington. “Last year’s space shuttle servicing mission left the observatory operating at peak capacity, giving it a new beginning for scientific achievements that impact our society.”

This morning during interviews on NASA TV, Grunsfeld and Weiler said they both felt fortunate to work with Hubble, a telescope who’s legacy will live on, no matter how much longer the telescope operates.

“I’m lucky to have worked on a project that will outlive me,” Weiler said.

“The discovery that I think is so incredible, and could not be imaged was that Hubble has now analyzed the constituents of an atmosphere of a planet around another star,” said Grunsfeld. “It is as if we were exploring that planet – and that’s what Hubble does for us, allows us to visit places we’ll never be able to go.”

On that note, take a 3-D trip into the Carina Nebula with the video below:

Astronomy Cast Ep. 181: Rotation

Rotation. Credit: Michael Owen, John Blondin (North Carolina State Univ.)

Everything in the Universe is spinning. In fact, without this rotation, life on Earth wouldn’t exist. We need the conservation of angular momentum to flatten out galaxies and solar systems, to make planets possible. Let’s find out about the physics involved with everything that spins, and finally figure out the difference between centripetal and centrifugal force.

Click here to download the episode.

Or subscribe to: astronomycast.com/podcast.xml with your podcatching software.

Rotation show notes and transcript.

Click on Hubble: Galaxy Zoo Now Includes HST Images

The Hubble Space Telescope is 20 years old on Saturday and, to mark this anniversary, all the world’s space and astronomy fans have a chance to become part of the Hubble team.

As part of the birthday celebrations NASA’s Space Telescope Science Institute and the online astronomy project Galaxy Zoo are making some 200,000 Hubble images of galaxies available to the public at Galaxy Zoo (www.galaxyzoo.org). They hope that volunteers looking for their own favorite galaxies will join forces to give the venerable telescope a present – classifications of each galaxy which will help astronomers understand how the Universe we see around us formed.

But there’s more to it than that; remember Hanny and the Voorwerp? The Green Peas? Mitch’s mysterious star? For every unexpected Galaxy Zoo discovery there are likely a dozen Hubble Zoo ones.

“The large surveys that Hubble has completed allow us to trace the Universe’s evolution better than ever before,” said University of Nottingham astronomer and Galaxy Zoo team member Dr. Steven Bamford. “The vast majority of these galaxies will never have been viewed by anyone, and yet we need human intuition to make the most of what they are telling us”.

More than 250,000 people have already contributed to Galaxy Zoo since its launch in 2007, but so far they have been looking only at the ‘local’ Universe, up to a hundred million or so light-years away. The galaxies in HubbleZoo are from some of the big surveys, such as GOODS, and the images were processed by the Galaxy Zoo team alongside Roger Griffith at JPL and the Space Telescope Science Institute (see this article, from my Universe Today series on the Hubble, for more details on GOODS).

“Hubble will enable us to look back in time, to the era when many of the galaxies we see today were forming,” said Dr. Chris Lintott of Oxford University, Galaxy Zoo principal investigator. “As a kid I always wanted a time machine for my birthday, but this is the next best thing!”

“We never dreamt that people would find so many fascinating objects in the original Galaxy Zoo,” said Yale University astronomer Dr. Kevin Schawinski. “Who knows what’s hiding in the Hubble images?” Lintott added: “As we recovered from the launch of the original Galaxy Zoo, we knew we’d want to have a look at Hubble. Now we realize the images are better and the galaxies weirder than we ever thought they would be.”

And how will you, dear zooite-to-be, contribute, and find a hidden gem among the Hubble galaxies? Once you log in, you will asked to answer simple questions about what you are seeing, for example, identifying the number of spiral arms visible, or spotting galaxies in the process of merging. And if you spot something odd, you can bring it to the attention of other zooites, and the Zoo astronomers.

Arp147 (Credit: NASA, ESA, and M. Livio (STScI))

“Every galaxy is special in its own way,” said Stuart Lynn of Oxford University, Galaxy Zoo team member, “but some are worthy of individual attention. Anyone combing through the data using our site could make a spectacular discovery, and that would be the best birthday present of all.”

Galaxy SDSS J100213.52+020645.9 (SDSS)

Galaxy SDSS J100213.52+020645.9 (Hubble)

Sources: NASA, HubbleSite, Oxford University, Galaxy Zoo Forum The two images above, of a galaxy called SDSS J100213.52+020645.9, highlight the sharpness and depth of the Hubble’s images (the SDSS telescope and the Hubble have primary mirrors of approximately the same diameter).

Mini Space Shuttle Launches on Secret Mission

Launch of the X37-B. Credit: Alan Walters (awaltersphoto.com) for Universe Today

A secret Air Force space plane launched on an Atlas V Thursday night at 7:52 p.m. EDT (2352 GMT) on a classified mission. The vehicle, the umanned X-37B Orbital Test Vehicle, looks like a mini space shuttle and has the capability to remain in orbit for 270 days. The purpose of this vehicle – for this mission and for the future – is unknown, but the Air Force says this newest and most advanced re-entry spacecraft will demonstrate autonomous orbital flight, reentry and landing.

Although the mission is secret, the launch was open to the media and was webcast live by the United Launch Alliance, and included live Twitter updates from the Air Force Space Command. Shortly after main engine cutoff, however, the webcast ended and no more updates were provided about the rocket and the vehicle’s activities.

[/caption]
The mission duration has not been disclosed, but the Air Force said technologies to be tested during the flight include advanced guidance, navigation and control, thermal protection systems, avionics, high temperature structures and seals, reusable insulation and lightweight electromechanical flight systems.

Liftoff occurred on time; and the stages separated 4 minutes and 31 seconds into the flight, and engine cutoff came at about 17 minutes after launch.

X-37B. Credit: US Air Force

The X-37B is 9 meters long and 4.5 meter wide (29 X 15 ft) and its payload bay is 2.1 by 1.2 meters (7 by 4 feet). The vehicle was built at Boeing Phantom Works, based on an orbital and re-entry demonstrator design initially developed by NASA, then handed over to the Pentagon.

Rumors of an X-37B launch have been circulating since 2008.

Originally the vehicle was scheduled for launch in from the payload bay of the Space Shuttle , but that plan was axed following the Columbia accident.

Comparing the X-37B to the space shuttle, the orbiters 56 meters (184 feet) long, has a wingspan of 23 meters (78 feet), and weighs 2 million kg (4.5 million pounds.)

The space shuttle can haul payloads up to 29,500 pounds, while the OTV can only handle up to 226 kg (500 pounds.)

The X37-B will land on a runway in California and will be controlled remotely from the ground. In the future, the Air Force said they hope to conduct experiments and rendezvous with other spacecraft.

See our preview article about the X37-B.

Enjoy more launch images from Alan Walters:

Launch of the X37- B. Credit: Alan Walters (awaltersphoto.com) for Universe Today.
Launch of the X37-B. Credit: Alan Walters (awaltersphoto.com) for Universe Today