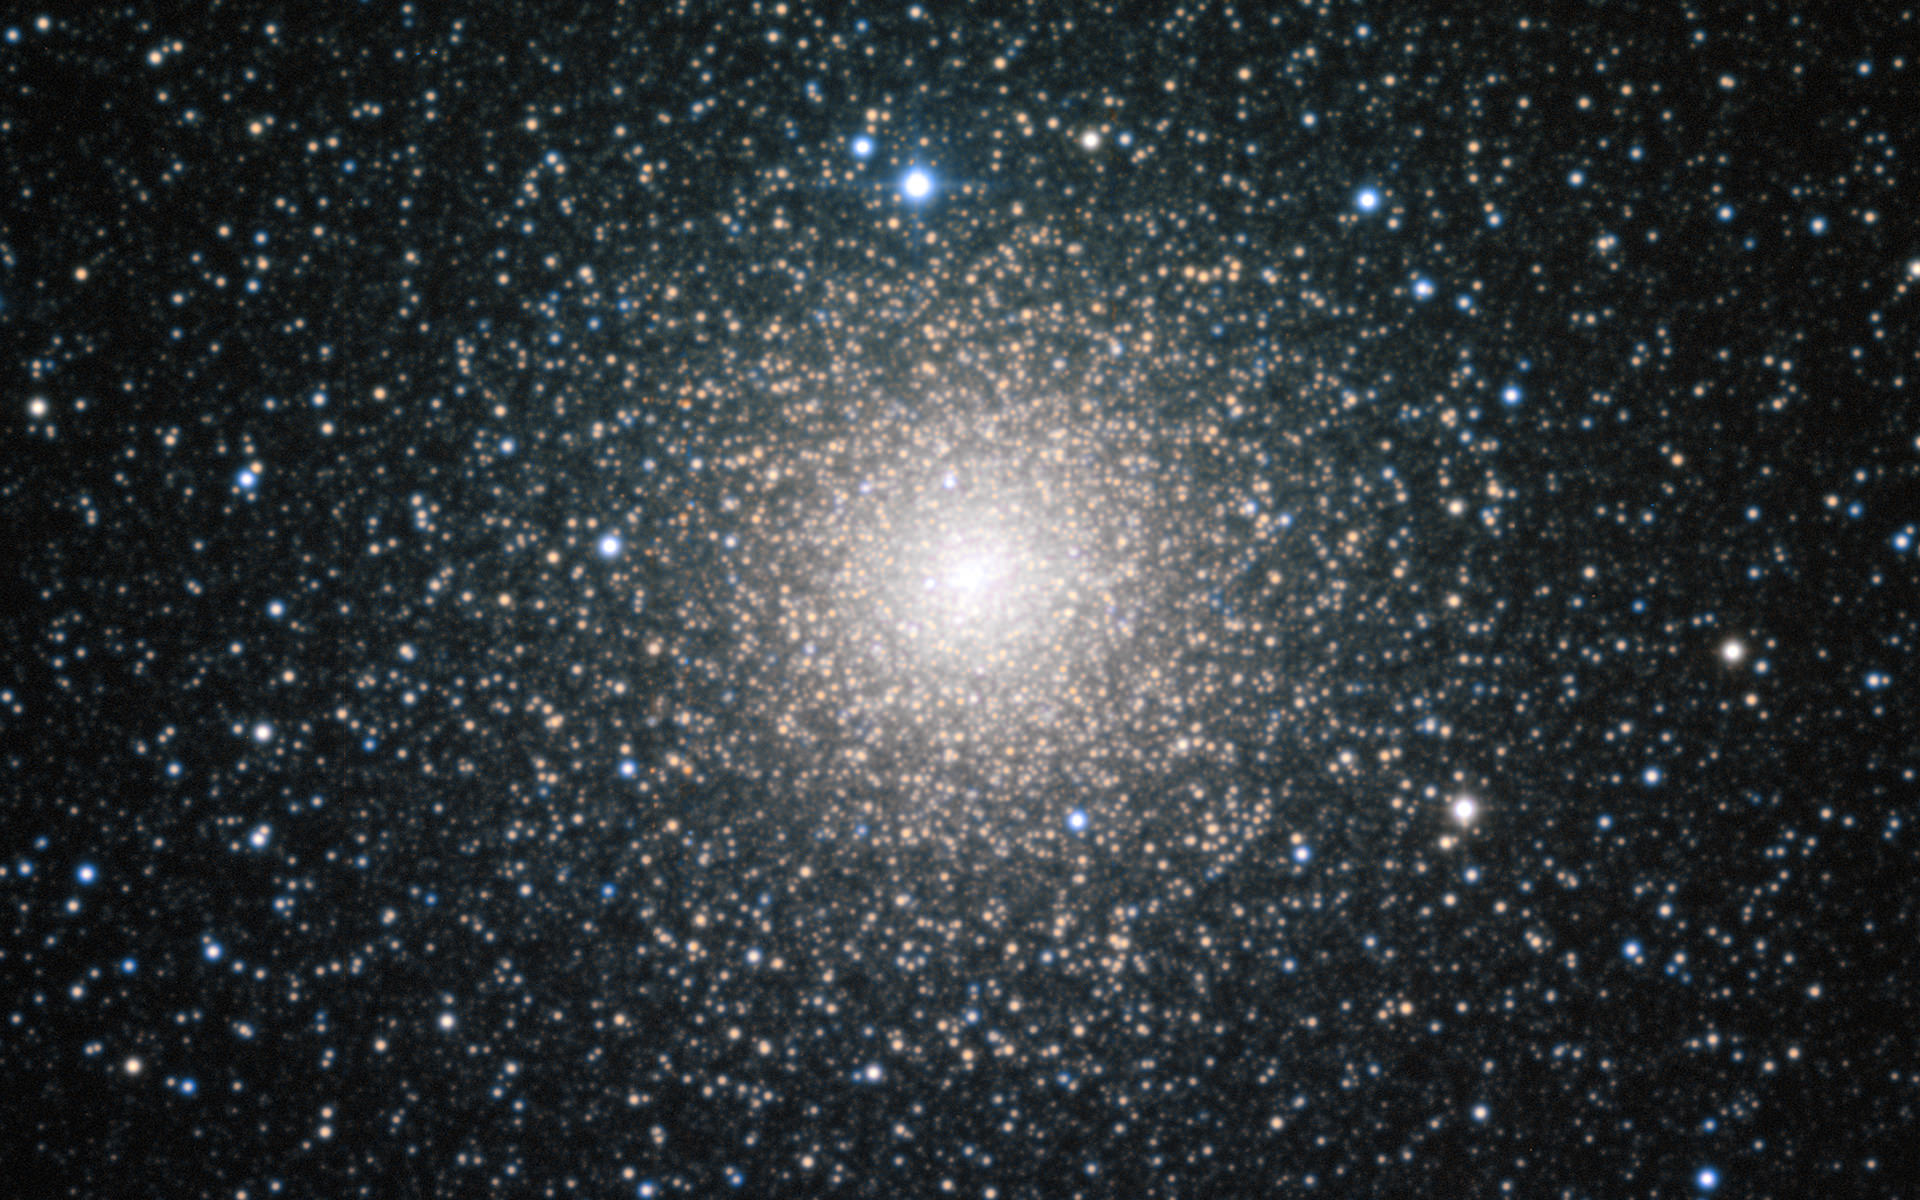
The globular cluster NGC 6388. Blue stragglers may clearly be seen around the edges. More are hidden within the central core. Credit: ESO
A unique and enigmatic variety of stars known as blue stragglers appear to defy the normal stellar aging process. Discovered in globular clusters, they appear much younger than the rest of the stellar population. Since their discovery in 1953, astronomers have been asking the question: how do these stars regain their youth?
For years, two theories have persisted. The first theory suggests that two stars collide, forming a single more massive star. The second theory proposes that blue stragglers emerge from binary pairs. As the more massive star evolves and expands, it blows material onto the smaller star. In both theories, the star grows steadily more massive and bluer – it regains its youth.
But now, a surprising finding may lend credence to the second theory. Astronomers at the Nicolaus Copernicus Astronomical Center in Poland recently observed a blue straggler caught in the midst of forming!
The binary system that was studied, known as M55-V60, is located within the globular cluster M55. Dr. Michal Rozyczka, one of the research scientists on the project, told Universe Today, “The system is a showcase example of a blue straggler formed via the theoretically predicted peaceful mass exchange between its components.”
The team used both photometric (the overall light from the system) and spectroscopic (the light spread out into a range of wavelengths) observations. The photometric data revealed the light curve – the change in brightness due to one star passing in front of the other – of the system. This provided evidence that the astronomers were looking at a binary system.
From the spectroscopic data, shifts in wavelength reveal the velocity (along the line of sight) of a source. The research team noted that the system’s center of mass was moving with respect to the binary system. This will occur in a semi-detached binary system, where mass transfers from one star to the other. As it does this, the center of mass will follow the mass-transfer.
From both photometric and spectroscopic observations (which covered more than 10 years!) the team was able to verify that this object is not only a binary, but a semi-detached binary, residing at the edge of M55.
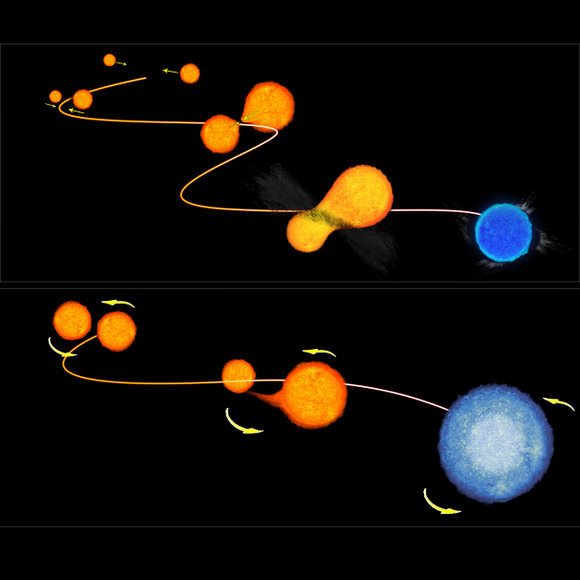
An artist’s conception of how a blue straggler may form from a binary system. Credit: NASA/ESA
“The system is semi-detached with the less massive (secondary) component filling its Roche lobe,” explained Dr. Rozyczka. “The secondary has a tearlike shape, with the tip of the tear directed toward the more massive primary. A stream of gas flows out of the tip along a curved path and hits the primary.”
How do we know that it is in fact a blue straggler? The simple answer is that the secondary star, with is gaining mass, appears bluer than normal. This blue straggler is clearly in the process of forming. It is the second observation of such a formation, with the first being V228 in the globular cluster: 47 Tuc.
This research verifies that semi-detached binaries are a viable formation mechanism for blue stragglers. The binary was discovered by happenstance, in a project aimed at determining accurate ages and distances of nearby clusters. It’s certainly a surprising result from the survey.
The results will be published in Acta Astronomica, a peer-reviewed scientific journal located in Poland (preprint available here).
When we look at the night sky, filled with stars, it’s hard to resist counting. Just with the unaided eye, in dark skies, you can see a few thousand.
How many stars are there in the entire Universe? Before we get to that massive number, let’s consider what you can count with the tools available to you.
Perfect vision in dark skies allows us to see stars down to about magnitude 6. But to really make an accurate census of the total number of stars, you’d need to travel to both the Northern and Southern Hemispheres, since only part of the sky is visible from each portion of the Earth. Furthermore, you’d need to make your count over several months, since a portion of the sky is obscured by the Sun. If you had perfect eyesight and traveled to completely dark skies in both the Northern and Southern Hemispheres, and there was no Moon, you might be able to get to count up almost 9,000 stars.
With a good pair of binoculars, that number jumps to about 200,000, since you can observe stars down to magnitude 9. A small telescope, capable of resolving magnitude 13 stars will let you count up to 15 million stars. Large observatories could resolve billions of stars.
But how many stars are out there? How many stars are there in the Milky Way?
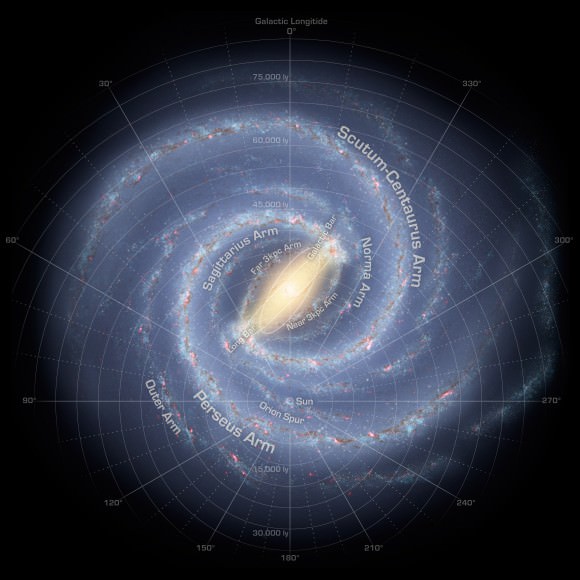
Milky Way. Image credit: NASA
According to astronomers, our Milky Way is an average-sized barred spiral galaxy measuring up to 120,000 light-years across. Our Sun is located about 27,000 light-years from the galactic core in the Orion arm. Astronomers estimate that the Milky Way contains up to 400 billion stars of various sizes and brightness.
A few are supergiants, like Betelgeuse or Rigel. Many more are average-sized stars like our Sun. The vast majority of stars in the Milky Way are red dwarf stars; dim, low mass, with a fraction of the brightness of our Sun.
As we peer through our telescopes, we can see fuzzy patches in the sky which astronomers now know are other galaxies like our Milky Way. These massive structures can contain more or less stars than our own Milky Way.
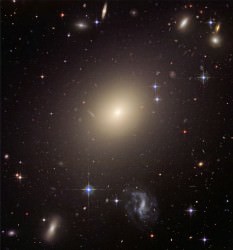
Elliptical galaxy ESO 325-G004. ESO
There are spiral galaxies out there with more than a trillion stars, and giant elliptical galaxies with 100 trillion stars.
And there are tiny dwarf galaxies with a fraction of our number of stars.
So how many galaxies are there?
According to astronomers, there are probably more than 170 billion galaxies in the observable Universe, stretching out into a region of space 13.8 billion light-years away from us in all directions.
And so, if you multiply the number of stars in our galaxy by the number of galaxies in the Universe, you get approximately 1024 stars. That’s a 1 followed by twenty-four zeros.
That’s a septillion stars.
But there could be more than that.
It’s been calculated that the observable Universe is a bubble of space 47 billion years in all directions.
It defines the amount of the Universe that we can see, because that’s how long light has taken to reach us since the Big Bang.
This is a minimum value, the Universe could be much bigger – it’s just that we can’t ever detect those stars because they’re outside the observable Universe. It’s even possible that the Universe is infinite, stretching on forever, with an infinite amount of stars. So add a couple more zeros. Maybe an infinite number of zeroes.
The Hubble Space Telescope is going to be used to settle an argument. It’s a conflict between computer models and what astronomers are seeing in a group of stars in 47 Tucanae.
White dwarfs — the dying embers of stars who have burnt off all their fuel — are cooling off slower than expected in this southern globular cluster, according to previous observations with the telescope’s Wide Field Camera and Advanced Camera for Surveys.
Puzzled astronomers are now going to widen that search in 47 Tucanae (which initially focused on a few hundred objects) to 5,000 white dwarfs. They do have some theories as to what might be happening, though.
White dwarfs, stated lead astronomer Ryan Goldsbury from the University of British Columbia, have several factors that chip in to the cooling rate:
The Hubble Space Telescope. Image credit: NASA, tweaked by D. Majaess.
– High-energy particle production from the white dwarfs;
– What their cores are made up of;
– What their atmospheres are made up of;
– Processes that bring energy from the core to the surface.
Somewhere, somehow, perhaps one of those factors is off.
This kind of thing is common in science, as astronomers create these programs according to the best educated guesses they can make with respect to the data in front of them. When the two sides don’t jive, they do more observations to refine the model.
“The cause of this difference is not yet understood, but it is clear that there is a discrepancy between the data and the models,” stated the Canadian Astronomical Society (CASCA) and the University of British Columbia in a press release.
Since the white dwarfs are in a cluster that presumably formed from the same cloud of gas, it allows astronomers to look at a group of stars at a similar distance and to determine the distribution of masses of stars within the cluster.
“Because all of the white dwarfs in their study come from a single well-studied star cluster, both of these bits of information can be independently determined,” the release added.
You can read the entire article on the previous Hubble research on 47 Tucanae at the Astrophysical Journal.
Today’s announcement took place during the annual meeting of CASCA, which is held this year in Vancouver.
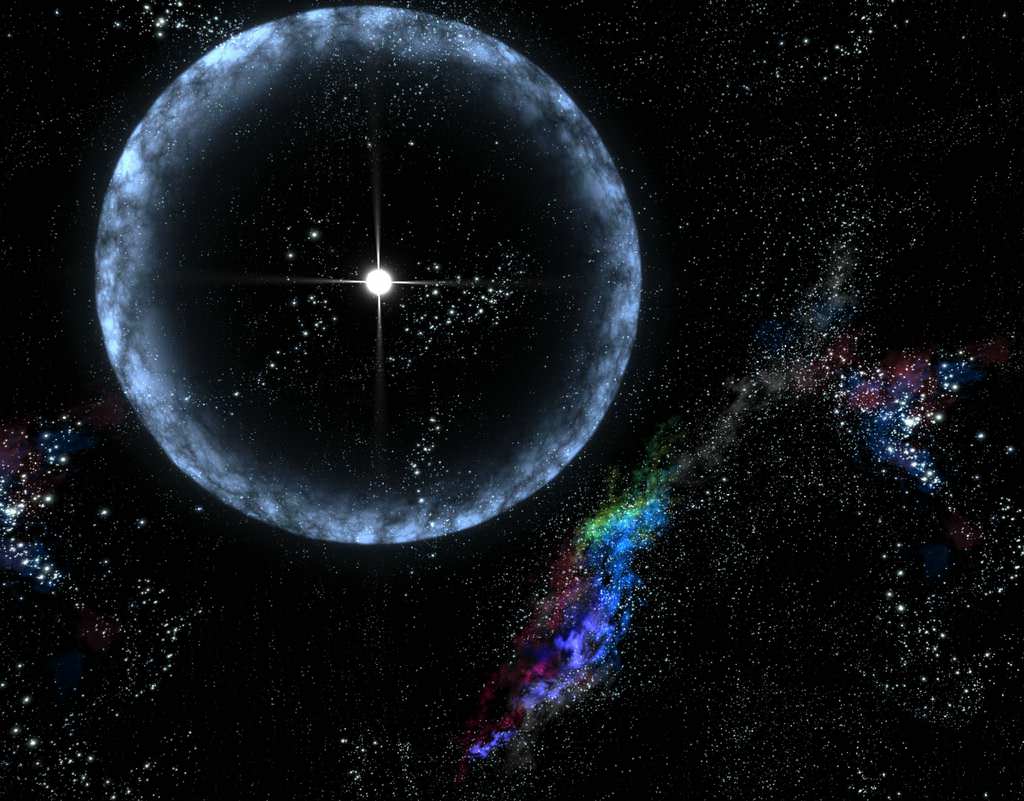
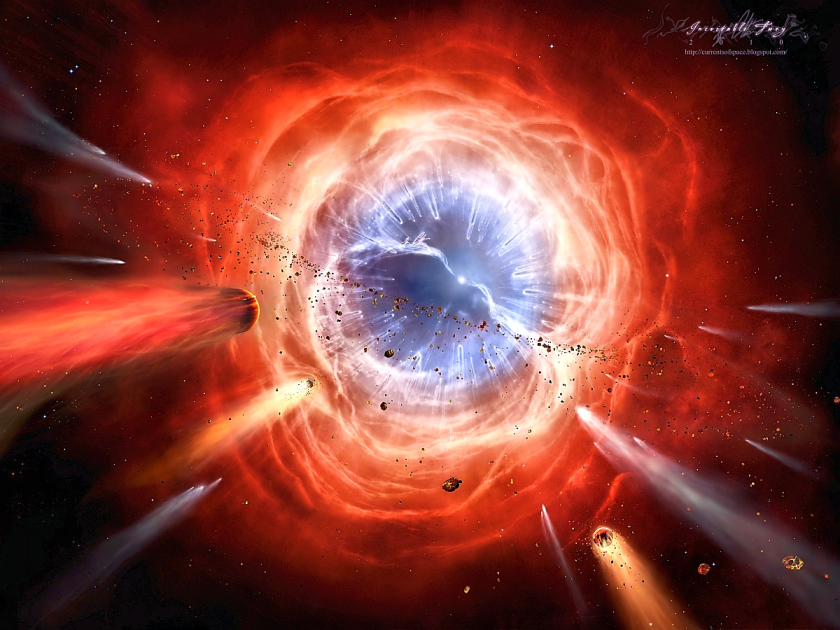
Artist's conception of a neutron star flare. Credit: University of California Santa Cruz
Why would a spinning star suddenly slow down? Even after writing a scientific paper about the phenomenon, astronomers still appear to be in shock-and-awe mode about what they saw.
“I looked at the data and was shocked — the … star had suddenly slowed down,” stated Rob Archibald, a graduate student at McGill University in Montreal. “These stars are not supposed to behave this way.”
Archibald led a group that was observing a neutron star, a type of really, really dense object created after huge stars run out of gas and collapse. The studied star (called 1E 2259+586, if you’re curious) has a massive magnetic field that places it in a subcategory of neutron stars called magnetars.
Anyway, the astronomers were watching over the magnetar with the NASA Swift X-ray telescope, just to get a sense of the star’s rotation and also to keep an eye out for the odd X-ray explosion commonly seen in stars of this type. But to see its spin rate reduce — that was definitely something unexpected.
An artistic impression of a magnetar with a very complicated magnetic field at its interior and a simple small dipolar field outside. Credits: ESA – Author: Christophe Carreau
Previous neutron star observations have showed them suddenly rotating faster (as if spinning up to several hundred times a second wasn’t enough.) This maneuver is called a glitch, and is thought to happen because the neutron has some sort of fluid (sometimes called a “superfluid”) inside that drives the rotation.
So now, the astronomers had evidence of an “anti-glitch”, a star slowing down instead of speeding up. It wasn’t by much (just a third of a part per million in the seven-second rotation rate), but while it happened they also saw X-rays substantially increase from the magnetar. Astronomers believe that something major happened either inside, or near the surface of the star.
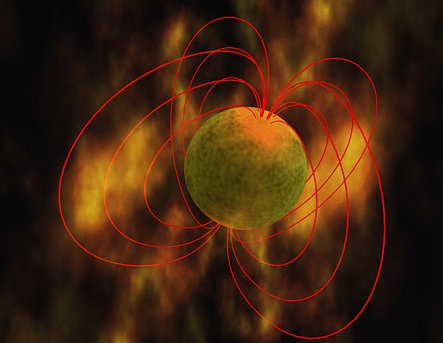
The magnetic field surrounding a magnetar (NASA)
And, astronomers added, if they can figure out what is happening, it could shed some light on what exactly is going on in that dense interior. Maybe the fluid is rotating at different rates, or something else is going on.
“Such behaviour is not predicted by models of neutron star spin-down and, if of internal origin, is suggestive of differential rotation in the magnetar, supporting the need for a rethinking of glitch theory for all neutron stars,” read a paper on the results.
The work was released today (May 29) at the Canadian Astronomical Society (CASCA)’s annual meeting, held this year in Vancouver.
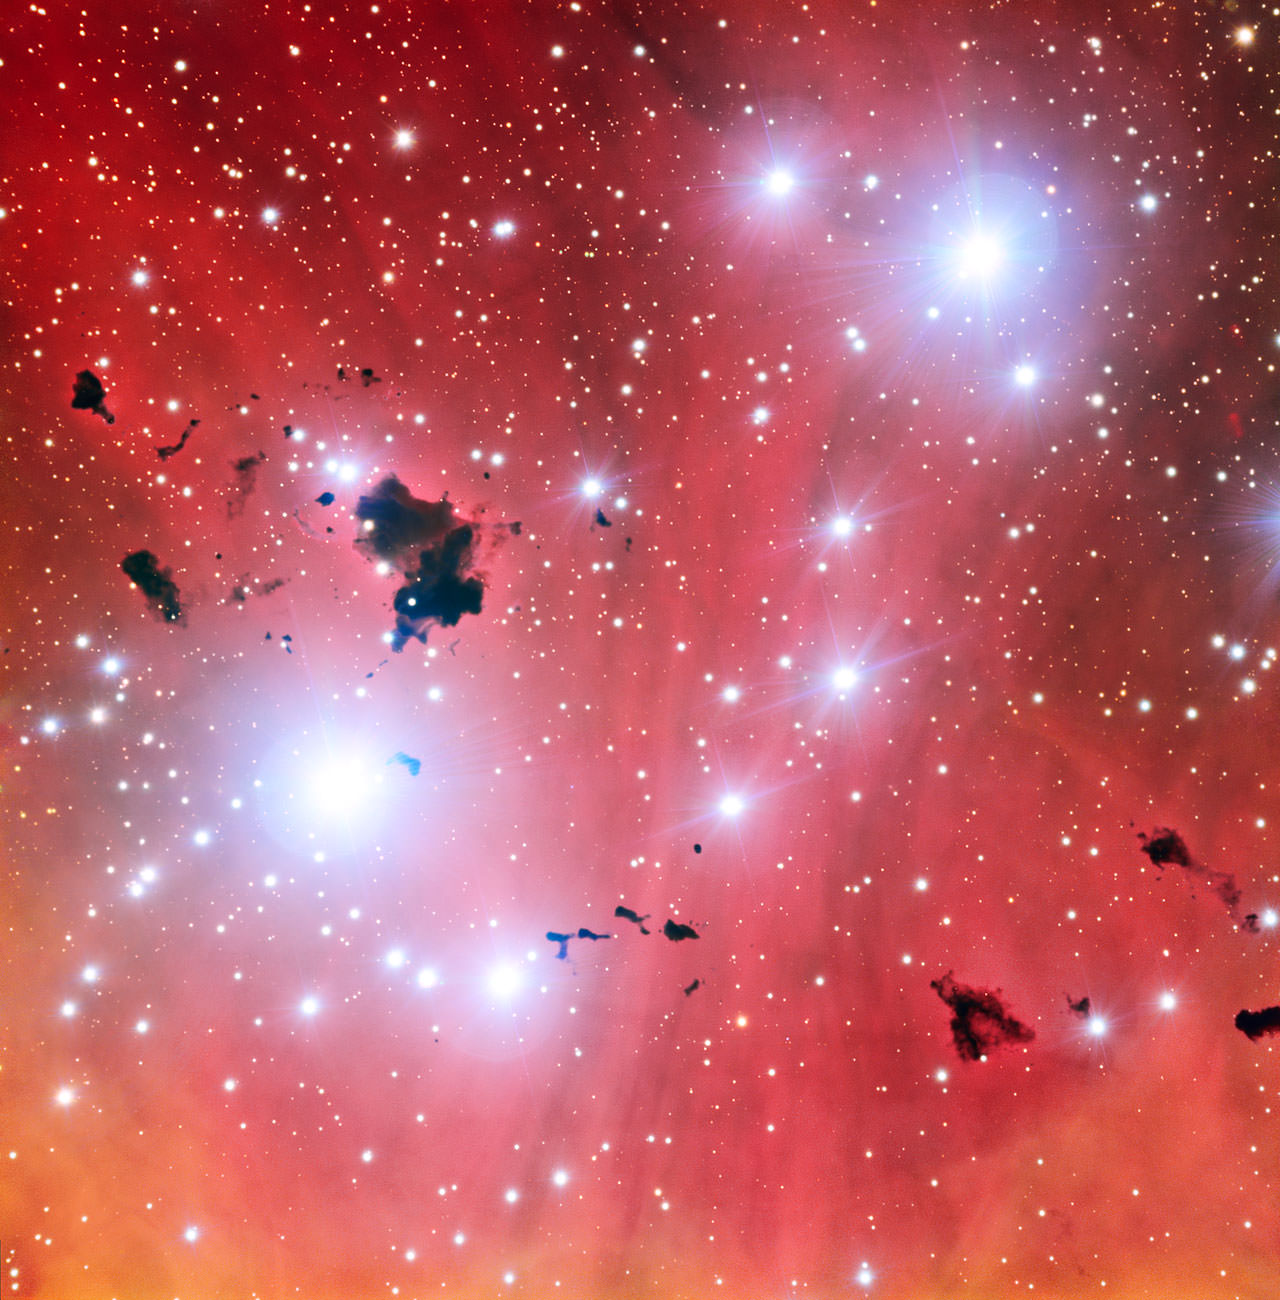
A new view of the spectacular stellar nursery IC 2944 (ESO)
This Saturday will mark 15 years that the European Southern Observatory’s Very Large Telescope (VLT) first opened its eyes on the Universe, and ESO is celebrating its first-light anniversary with a beautiful and intriguing new image of the stellar nursery IC 2944, full of bright young stars and ink-black clouds of cold interstellar dust.
This is the clearest ground-based image yet of IC 2944, located 6,500 light-years away in the southern constellation Centaurus.
Emission nebulae like IC 2944 are composed mostly of hydrogen gas that glows in a distinctive shade of red, due to the intense radiation from the many brilliant newborn stars. Clearly revealed against this bright backdrop are mysterious dark clots of opaque dust, cold clouds known as Bok globules. They are named after Dutch-American astronomer Bart Bok, who first drew attention to them in the 1940s as possible sites of star formation. This particular set is nicknamed the Thackeray Globules.
Larger Bok globules in quieter locations often collapse to form new stars but the ones in this picture are under fierce bombardment from the ultraviolet radiation from nearby hot young stars. They are both being eroded away and also fragmenting, like lumps of butter dropped into a hot frying pan. It is likely that Thackeray’s Globules will be destroyed before they can collapse and form stars.
This new picture celebrates an important anniversary for the the VLT – it will be fifteen years since first light on the first of its four Unit Telescopes on May 25, 1998. Since then the four original giant telescopes have been joined by the four small Auxiliary Telescopes that form part of the VLT Interferometer (VLTI) – one of the most powerful and productive ground-based astronomical facilities in existence.
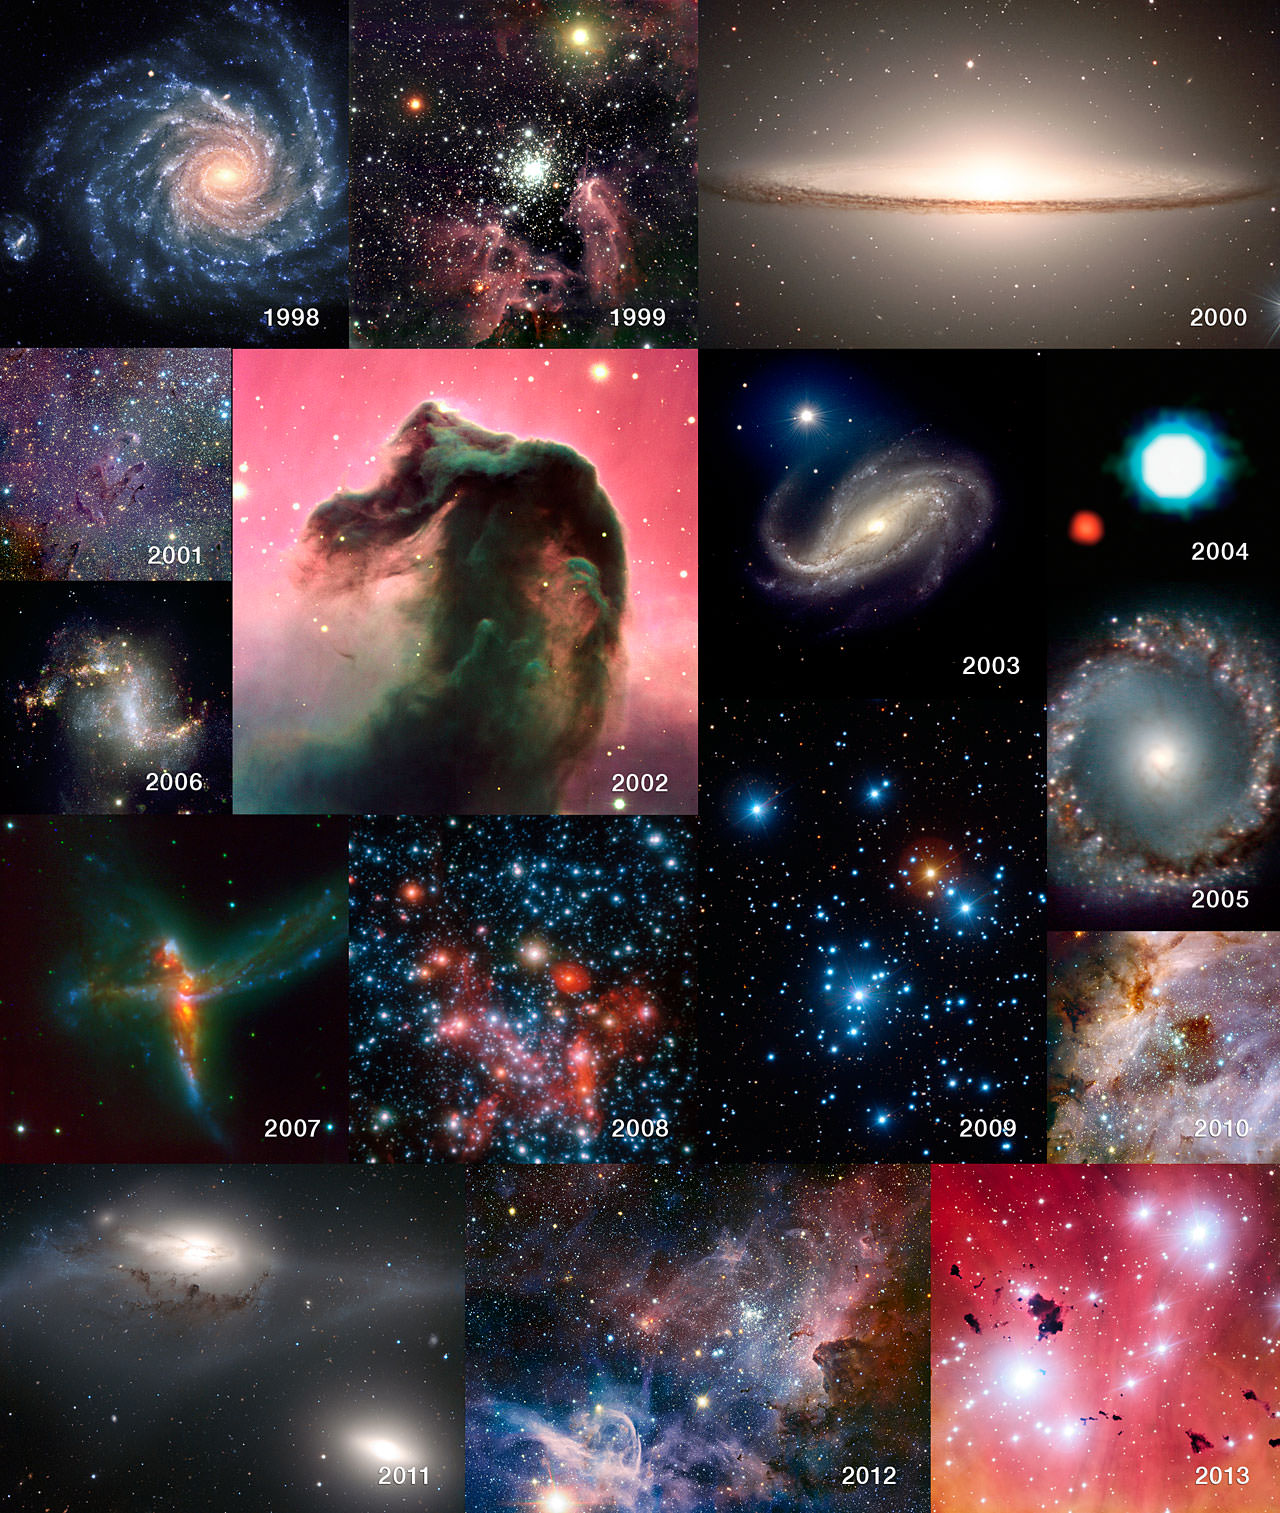
The selection of images below — one per year — gives a taste of the VLT’s scientific productivity since first light in 1998:
A selection of images from 15 years of the VLT (Credits: ESO/P.D. Barthel/M. McCaughrean/M. Andersen/S. Gillessen et al./Y. Beletsky/R. Chini/T. Preibisch)
Read more on the ESO site here, and watch an ESOCast video below honoring the VLT’s fifteen-year milestone:
The Universe can be a very gray place. But this week, we’ll look at a fine example of a class of objects that defies this trend.
Many first time stargazers are surprised when the Trifid or the Orion Nebula fails to exhibit the bright splashy colors seen in Hubble photos. The fault lies not with the Universe, but in our very own eyes.
This is because the light sensitive fovea of our eye has two different types of photoreceptor cells; rods and cones. These act like slow and fast speed film (for those of us old enough to remember actual film!) Under low light conditions, objects have a very black-and-white appearance. It’s only with an increase in brightness that the color receptors in the cone cells of our eye begin to kick in.
One class of stars can induce this effect. They’re known as carbon stars.
A fine example of just such an object rides high in the late spring sky for northern hemisphere observers. This is the variable star Y Canum Venaticorum, also abbreviated as Y CVn or “La Superba” (The magnificent). This name was given to the star by Father Angelo Secchi in the mid-19th century. It is one of the reddest stars in the sky.
Astronomers gauge the “redness” of a star by measuring its magnitude contrast through a blue and visible (green peaking) filters. This is what is known as its B-V index, and the higher the value, the redder the star.
La Superba has a B-V value of +2.5. For contrast, the familiar orange-red stars Antares and Betelgeuse have a B-V value of +1.83 & +1.85, respectively.
Some other classic carbon stars and their B-V values are;
Many of these are also variable stars, and they can appear redder visually near their minimum brightness. In the case of La Superba, it ranges from magnitude +4.8 to +6.3 over a span of 160 days, with a longer super-imposed cycle of about 6 years. We’re just coming off of a peak cycle in late May 2013, and La Superba is easy to spot with binoculars about a third of the way between the brilliant double star Cor Caroli (visited by the Enterprise in the Star Trek: The Next Generation Episode “Allegiance”) and Delta Ursa Majoris.
I’ve shown off carbon stars such as La Superba and Hind’s Crimson Star at public star parties to great effect. They can be an excellent star party “secret weapon” when every other ‘scope down the line is aimed at the Orion nebula.
For a faint constellation, Canes Venatici has lots to offer. One of the best globular clusters in the sky M3 can be found within its borders, as can a handful of decent galaxies. La Superba lies in a rather empty region of the constellation high above the galactic plane. In fact, an area about 15° degrees north of location in the adjoining constellation Ursa Major was picked for the famous Hubble Deep Field image for this very reason.
Burnham’s Celestial Handbook describes La Superba as “one of the reddest of all the naked eye stars, (with) a truly odd and vivid tint in large telescopes.” Astronomer Agnes Clerke described its appearance in 1905 as an “extraordinary vivacity of prismatic rays, separated into dazzling zones of red, yellow, and green by broad spaces of profound obscurity.” (Note: the “spaces” referred to gaps in its spectra).
Through the telescope at low power, we see La Superba as an orange-red ember with shades of white. It’s an easy catch with binoculars, and one of the very few carbon stars that is visible to the naked eye under dark skies. We’d judge that only TX Piscium rivals it in brightness, and only V Hydrae and Hinds appear ruddier. I always like to ask first time observers of colored stars what they see… human eye-brain perception can vary greatly!
The coordinates of La Superba are:
Right Ascension: 12 Hours 45’ 08”
Declination: +45 26’ 25”
La Superba is about 600-800 light years distant. Physically, it is a massive star at three times the mass of our Sun. It’s also a monster in terms of diameter, at four astronomical units in size. If you placed it within our solar system, it would swallow up the orbits of the interior planets out to Mars!
La Superba is thus much less dense than our own Sun, and at a surface temperature of about 2,800K, relatively cool. It is also the brightest “J-type” carbon star in the sky, a rare sub-type characterized by the presence of the isotope carbon-13 in its atmosphere. A carbon star is a sun near the end of its life, accumulating carbon compounds in its outer atmosphere as it fuses heavier elements in one last “hurrah” before shedding its outer layers and forming a white dwarf embedded inside a planetary nebula. Carbon stars are much brighter in the infrared, and we see the very tail end of this absorption in the visible red end of the spectrum. In fact, La Superba is a full 9 magnitudes (nearly 4,000 times) brighter in the near-infrared than in the ultraviolet!
All amazing facts to ponder as we view a star near the end of its career, seeding the cosmos with the very element that makes life possible. Next time you’re out observing, be sure to go “into the red” and check out the fine carbon star!
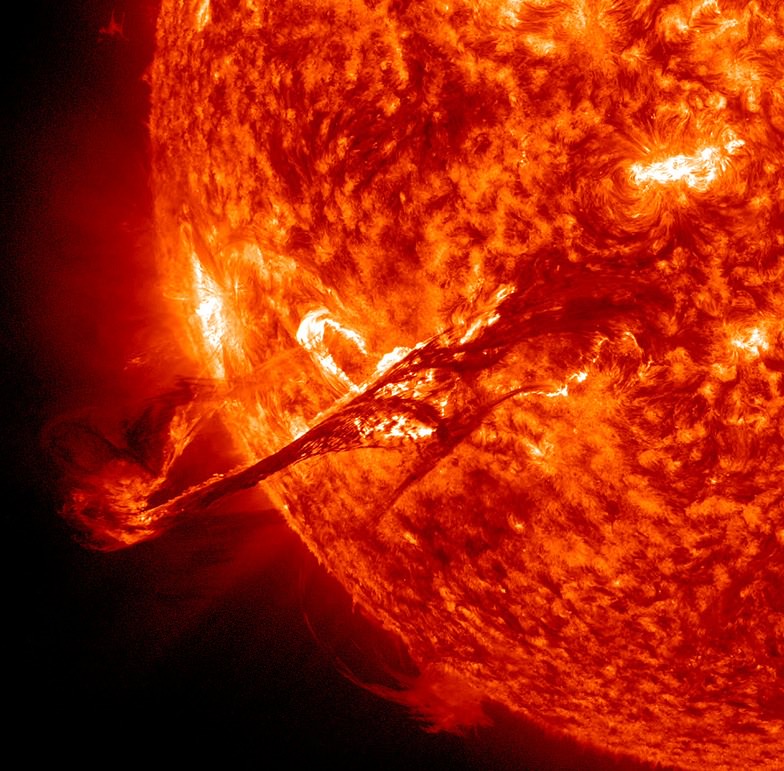
A long, magnetic filament burst out from the Sun after a C-cladd flare on(Aug. 31, 2012 (NASA/SDO/AIA)
We live on a planet dominated by weather. But not just the kind that comes in the form of wind, rain, and snow — we are also under the influence of space weather, generated by the incredible power of our home star a “mere” 93 million miles away. As we orbit the Sun our planet is, in effect, inside its outer atmosphere, and as such is subject to the constantly-flowing wind of charged particles and occasional outbursts of radiation and material that it releases. Although it may sound like something from science fiction, space weather is very real… and the more we rely on sensitive electronics and satellites in orbit, the more we’ll need to have accurate weather reports.
Fortunately, the reality of space weather has not gone unnoticed by the U.S. Federal Government.
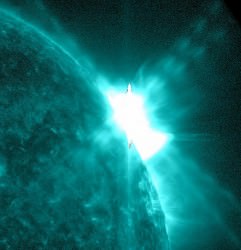
An X1.6 flare eruption on Jan. 27, 2012 (NASA/SDO/AIA)
Today the White House Office of Science and Technology Policy released a new report, Space Weather Observing Systems: Current Capabilities and Requirements for the Next Decade, which is an assessment of the United States government’s capacity to monitor and forecast potentially harmful space weather and how to possibly mitigate the damage from any exceptionally powerful solar storms in the future.
The report was made by a Joint Action Group (JAG) formed by the National Space Weather Program Council (NSWPC).
The impacts of space weather can have serious economic consequences. For example, geomagnetic storms during the 1990’s knocked out several telecommunications satellites, which had to be replaced at a cost of about $200 million each. If another “once in a century” severe geomagnetic storm occurs (such as the 1859 “super storm”), the cost on the satellite industry alone could be approximately $50 – $100 billion. The potential consequences on the Nation’s power grid are even higher, with potential costs of $1 – 2 trillion that could take up to a decade to completely repair.
– Report on Space Weather Observing Systems: Current Capabilities and Requirements for the Next Decade (April 2013)
“In other words,” according to the report, “the Nation is at risk of losing critical capabilities that have significant economic and security impacts should these key space weather observing systems fail to be maintained and replaced.”
The National Space Weather Program is a Federal interagency initiative with the mission of advancing the improvement of space weather services and supporting research in order to prepare the country for the technological, economic, security, and health impacts that may arise from extreme space weather events.
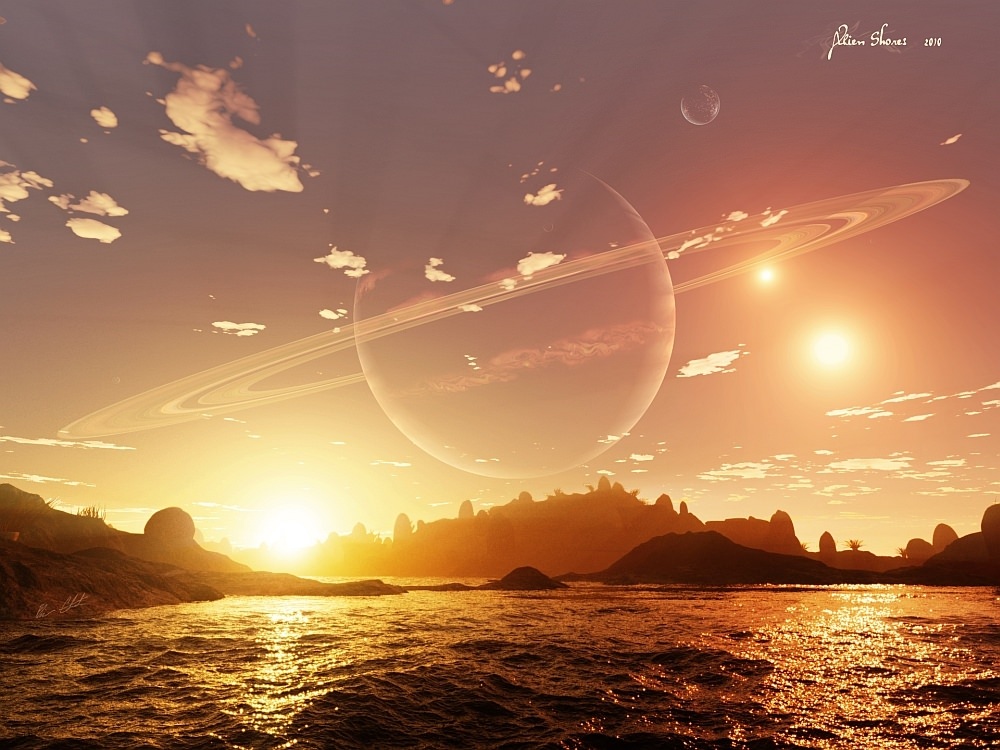
An artist's illustration of a planetary nebula engulfing its orbiting planets (image credit: Regulus36/deviantart, adjusted by DM to mitigate compression effects).
Textbooks often cite that planetary nebulae (PNe, plural) represent an endstate for lower-mass single stars. But conversely, recent research suggests that most PNe stem from binary systems. The lowest mass star theorized to form the typical PN is near 1 solar mass, and thus without a companion the Sun may not surpass the mass limit required to generate the hot glowing (ionized) nebula typically tied to PNe. New research continues to question our original understanding of how the Sun’s life may end.
A new study spearheaded by G. Jacoby aimed in part to test that binary hypothesis by searching for PNe in star clusters occupying M31. The team remarked that, “while the binary interaction model explains some of the anomalies associated with the observed planetary nebula population, this theory awaits final confirmation.”
“The traditional theory states that the progenitors of PNe are low- to intermediate-mass single stars … However, this theory does not provide a natural explanation for the non-spherical morphologies observed for the great majority of PNe, nor their low rate of formation. For these and other inconsistencies, a new paradigm has been developed, wherein most PNe are shaped via the interaction … with a binary companion,” said Jacoby et al. 2013. Continue reading “Astronomers Hint that our Sun won’t Terminate as the Typical Planetary Nebula”
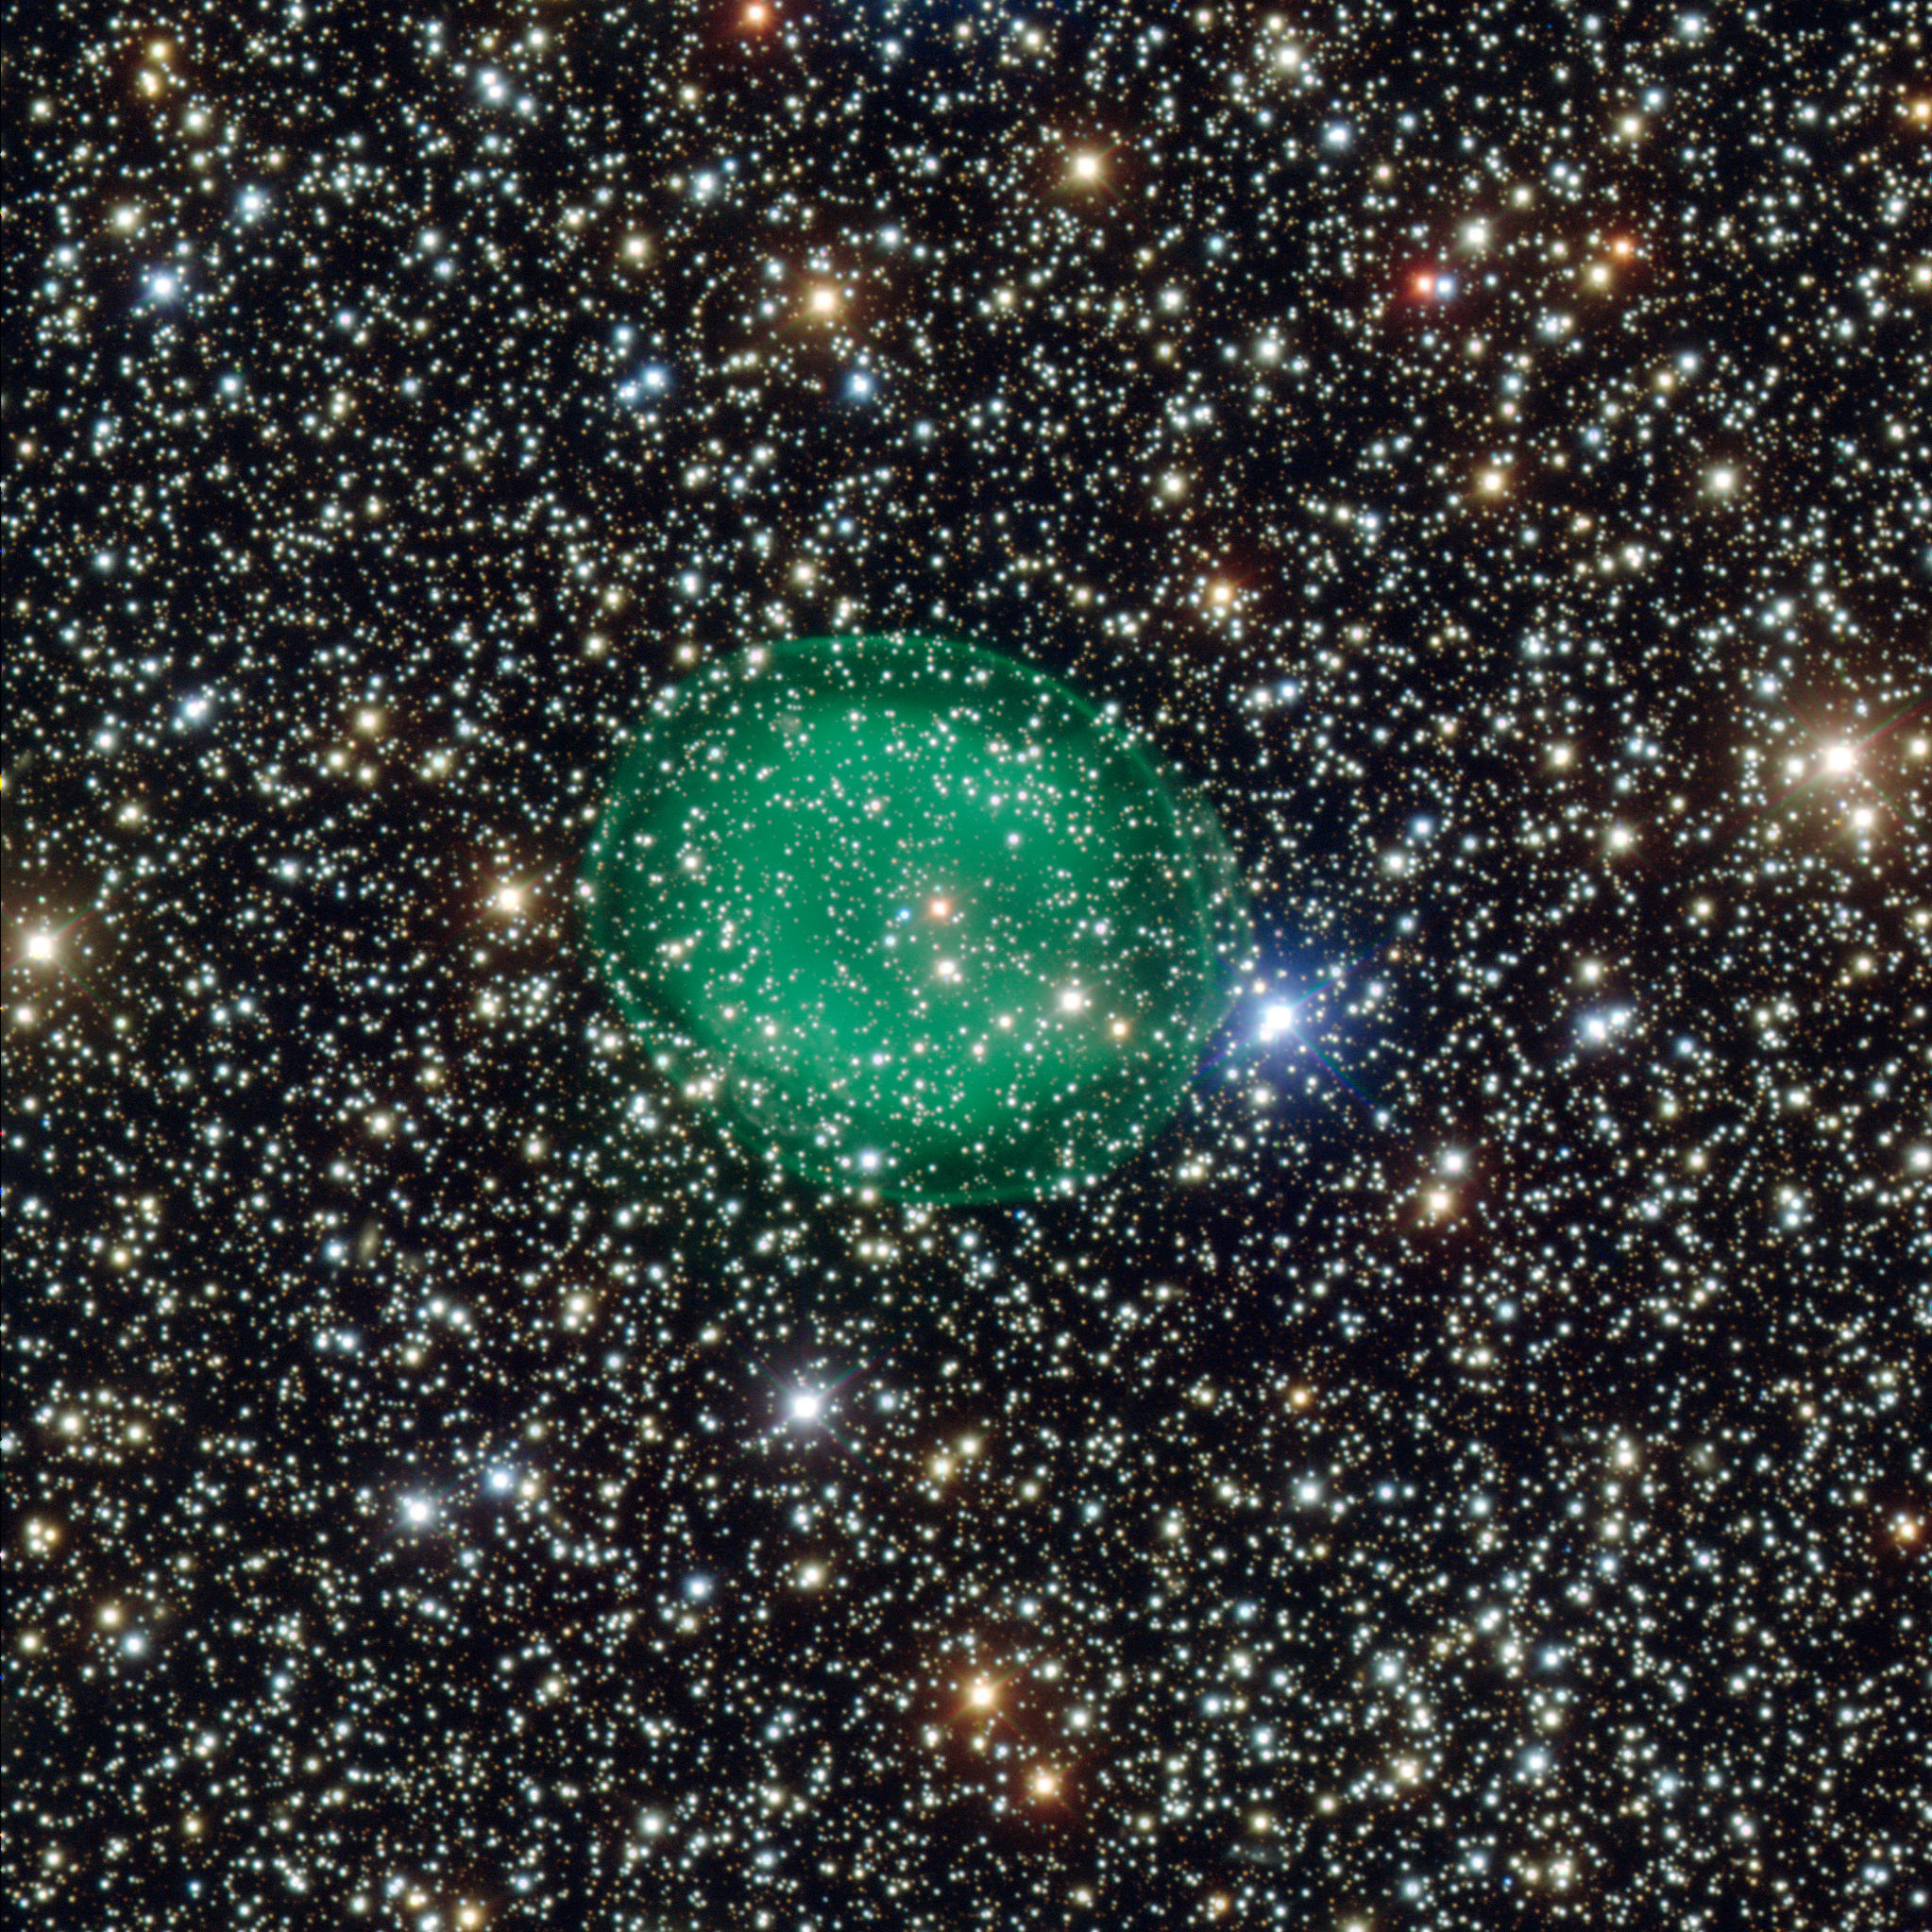
This intriguing picture from ESO’s Very Large Telescope shows the glowing green planetary nebula IC 1295 surrounding a dim and dying star. It is located about 3300 light-years away in the constellation of Scutum (The Shield). This is the most detailed picture of this object ever taken. Credit: ESO
Located on Cerro Paranal in the Atacama Desert of northern Chile, the ESO’s Very Large Telescope was busy using the FORS instrument (FOcal Reducer Spectrograph) to achieve one of the most detailed observations ever taken off a lonely, green planetary nebula – IC 1295. Exposures taken through three different filters which enhanced blue light, visible green light, and red light were melded together to make this 3300 light year distant object come alive.
Located in the constellation of Scutum, this jewel in the “Shield” is a miniscule star that’s at the end of its life. Much like our Sun will eventually become, this white dwarf star is softly shedding its outer layers, like an unfolding flower in space. It will continue this process for a few tens of thousands of years, before it ends, but until then IC 1295 will remain something of an enigma.
“The range of shapes observed up to today has been reproduced by many theoretical works using arguments such as density enhancements, magnetic fields, and binary central systems. Despite this, no complete agreement between models and properties of a given morphological group has been achieved. One of the main reasons for this is selection criteria and completeness of studied samples.” say researchers at Georgia State University. “The samples are usually limited by available images in few bands such as Ha, [NII] and [OIII]. Of course they are also limited by distance, since the further away the object is, the harder it is to resolve its structure. Even with the modern telescopes, obtaining a truly complete sample is far from being achieved.”
Why is this common deep space object like IC 1295 such a mystery? Blame it on its structure. It is comprised of multiple shells.- gaseous layers which once were the star’s atmosphere. As the star aged, its core became unstable and it erupted in unexpected releases of energy – like expansive blisters breaking open. These waves of gas are then illuminated by the ancient star’s ultraviolet radiation, causing it to glow. Each chemical acts as a pigment, resulting in different colors. In the case of IC 1295, the verdant shades are the product of ionised oxygen.
Loading player…
This video sequence starts with a broad panorama of the Milky Way and closes in on the small constellation of Scutum (The Shield), home to many star clusters. The final detailed view shows the strange green planetary nebula IC 1295 in a new image from ESO’s Very Large Telescope. This faint object lies close to the brighter globular star cluster NGC 6712. Credit: ESO/Nick Risinger (skysurvey.org)/Chuck Kimball. Music: movetwo
However, green isn’t the only color you see here. At the heart of this planetary nebula beats a bright, blue-white stellar core. Over the course of billions of years, it will gently cool – becoming a very faint, white dwarf. It’s just all part of the process. Stars similar to the Sun, and up to eight times as large, are all theorized to form planetary nebulae as they extinguish. How long does a planetary nebula last? According to astronomers, it’s a process that could be around 8 to 10 thousand years.
“Athough planetary nebulae (PNe) have been discovered for over 200 years, it was not until 30 years ago that we arrived at a basic understanding of their origin and evolution.” says Sun Kwok of the Institute of Astronomy and Astrophysics. “Even today, with observations covering the entire electromagnetic spectrum from radio to X-ray, there are still many unanswered questions on their structure and morphology.”
A new study describes how the Kepler team aims to remove pseudo-planets from its database. A pseudo-planet can be caused by the superposition of a foreground bright constant target star, and background fainter multiple star systems as shown in the above artist sketch (image credit: regulus36/devianart).
Observations by the Kepler satellite have advanced our knowledge of stars and their orbiting planets, yielding more than 100 confirmed planets and about 3,000 candidates. However, orbiting planets may not be the source for a fraction of those detections.
“There are many things in the sky that can produce transit-like signals that are not planets, and thus we must be sure to identify what really is a planet detected by Kepler,” Stephen Bryson told Universe Today. NASA Ames Research Center scientists Bryson and Jon Jenkins (also at the SETI Institute) are the lead authors on a new paper that aims to identify pseudo-planets detected by Kepler.
Small eclipses present in Kepler brightness measurements for a star (a lightcurve) may be indicative of an orbiting planet blocking light from its host star (see image below). However, under certain circumstances binary stars can mimic that signature.
Consider a Kepler target that is actually a chance superposition of a bright star and a fainter eclipsing binary system, whereby the objects lie at different distances along the sight-line. The figure below illustrates that their combined light can produce a lightcurve that is similar to a transiting planet. The bright foreground star dilutes the typically large eclipses produced by the binary system.
Left, the lightcurve for a star featuring a transiting planet, whereby the planet blocks a minute fraction of the host star’s light (image credit: Institute for Astronomy, University of Hawaii at Manoa). Right, the combined light from a foreground bright star and a fainter eclipsing binary system can mimic a transiting planet (image credit: chart and assembly, D. Majaess – cropped stellar graphics from Collier Cameron 2012, Nature).
“Most of the time these eclipsing binaries are not exactly aligned with our target star,” Bryson added, “and we can carefully examine the pixels to discover that the location of the transit signal is not the target star.” The team developed algorithms to identify pseudo-planets when the stars are individually resolved. Tagging spurious planet detections is important since there are numerous candidates, and yet limited observing time for follow-up efforts.
The team has been refining those algorithms as knowledge of the satellite’s in situ behavior increases. “These algorithms have been developed and used over the last four years. Some details of the techniques in the paper are new and will appear in future versions of the Kepler [software processing] pipeline,” said Bryson.
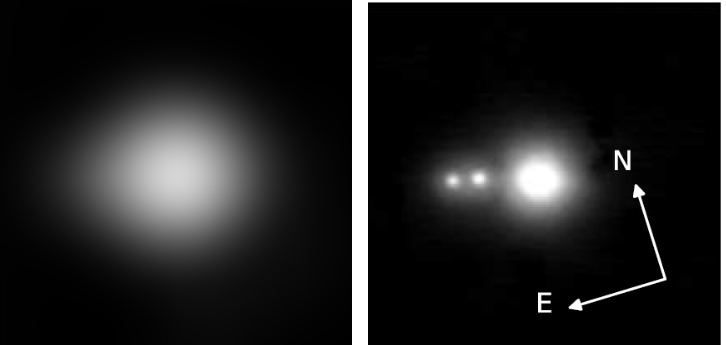
However, if multiple stars fall within the same pixel they are not individually resolved by Kepler, and a separate approach is required to infer their presence. Consider the example highlighted in the image below, where several stars were unresolved by Kepler yet appear in higher resolution images. The matter is exacerbated in part because Kepler’s spatial resolution is not optimal, and thus multiple stars may be confused as a single object. By contrast, certain ground-based telescopes can achieve ~20 times Kepler’s spatial resolution when adaptive optics are implemented.
High-resolution images (right panel) can reveal stars that were unresolved in lower-resolution images (left panel, e.g., Kepler). Unresolved stars dilute eclipses caused by transiting planets, and in certain cases can strongly bias the derived parameters (image credit: right panel from Adams et al. 2012, arXiv/AJ – left panel, image blurred to provide a lower-resolution glimpse of the target, assembly by D. Majaess).
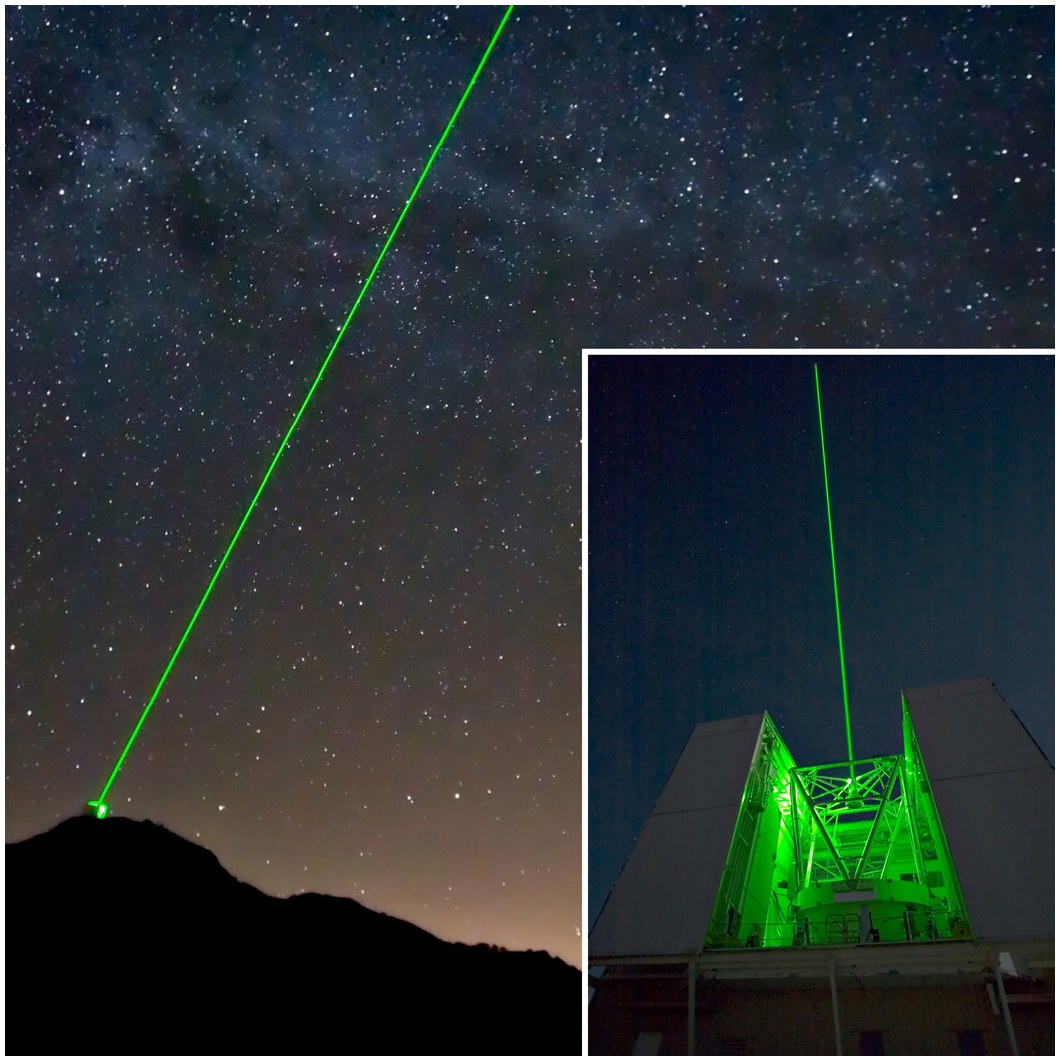
Adams et al. 2012 obtained high-resolution images of 90 Kepler targets, one of which is highlighted above. That team noted that, “Close companions … are of particular concern … Of the [90 Kepler targets surveyed] 20% have at least one companion within [half a Kepler pixel].” The high-resolution images were acquired via the MMT observatory (shown below) and the Palomar Hale-200-inch telescope.
Obviously, the resolution problem becomes more acute when observing rich stellar fields (high densities), such as near the plane of our Galaxy.
“Background eclipsing binaries account for as many as 35% of all planet-like transit signals when we are looking near the Milky Way, because there are many stars in the background,” Bryson told Universe Today. “When we look away from the Milky Way the fraction of background eclipsing binaries falls to about 10% of all planet-like transit signals because there are far fewer background stars of all types.”
However, regarding Kepler’s coarser resolution Bryson underscored that, “[it is] expected with such a large field telescope.” Kepler’s large field is certainly advantageous, as it permits the satellite to monitor 100,000+ stars over more than 100 square degrees of field.
The adaptive optics (AO) system at the MMT observatory provides astronomers with high-resolution images to search the vicinity of Kepler planet candidates for contaminating stars (image credit: Thomas Stalcup, SPIE).
Radial velocity measurements are an ideal means for evaluating planet candidates (and to help yield the mass). The data are pertinent since velocity shifts occur in the spectrum of the host star owing to the planet’s gravity. However, Adams et al. 2012 note that “Many of these objects do not have … radial velocity measurements because of the amount of observing time required, particularly for small planets around relatively faint stars. Another method is needed to confirm these types of planets … High-resolution images are thus a crucial component of any transit follow-up program.”
Identifying unresolved stars is crucial for yet another reason. Note that the fundamental parameters determined for a transiting planet depend in part on the fraction of the host star’s light that is obscured (the eclipse depth). However, if multiple unresolved stars exist they will contribute to the overall brightness, and hence the observed planet eclipse will be diluted and underestimated (see figure 2, above). Indeed, Adams et al. 2012 note that, “Corrections to the planetary parameters based on nearby [contaminating] stars can range from a few to tens of percents, making high resolution images an important tool to understanding the true sizes of other discovered worlds.”
The case of K00098 is a prime example underscoring the importance of identifying unresolved contaminating stars. K00098 features two rather bright stars that were unresolved and unknown prior to the acquisition of high-resolution images. Consequently, previously determined parameters for that star’s transiting planet were incorrect. Concerning K00098, Adams et al. 2012 remarked that, “for K00098, the dilution [of the eclipse depth] … were substantial: the [planet’s] radius increased by 10%, the mass by 60% … and the density changed by 25% [from that published]. Without high resolution images, we would have had a very inaccurate picture of this planet.”
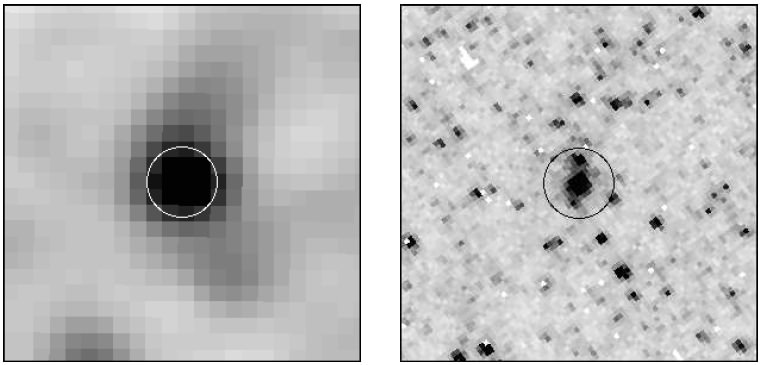
Low and high-resolution images of stars in the galaxy M33. The bright object detected in the low-resolution image is actually several stars, as indicated by the higher-resolution image (right). A similar effect occurs when comparing Kepler (lower-resolution) and AO images (higher-resolution). A single Kepler target can actually constitute multiple stars seen along the sight-line (image credit: Mochejska et al. 2001, arXiv).
Incidentally, unaccounted for light from unresolved stars isn’t merely a problem for exoplanet studies. The issue is rather pertinent when researching the cosmic distance scale and the Hubble constant (expansion rate of the Universe). Consider the images above which feature the same field in M33. The image exhibited on the left is from a ground-based facility, whereas the higher-resolution image displayed on the right is from the Hubble Space Telescope (HST). The brightest star at the center of the image is a Cepheid variable star, which is a pulsating star that is used to establish distances to galaxies. In turn those distances are subsequently employed to determine the Hubble constant. The HST image reveals stars that are unresolved in the ground-based image, and thus the distance inferred from that observation is compromised since the Cepheid appears (spuriously) brighter than it should be.
“Blending [e.g., added light caused by unresolved stars] leads to systematically low distances to galaxies observed with the HST, and therefore to systematically high estimates of the Hubble constant,” remarked Mochejska et al. 2004. However, there is an ongoing debate concerning the importance of such an effect (Ferrarese et al. 2000, Mochejska et al. 2001).
In sum, numerous groups are developing methods to identify pseudo-planets in the Kepler database. Given the large sample and sizable investment of time required to confirm a planet candidate: such efforts are important (e.g., Bryson et al. 2013). Data from the Kepler mission have helped advance our understanding of stars and their orbiting planets, and more is yet to come. If you’d like to help the Kepler team identify planets around other stars: join the Planet Hunters citizen science project.