What Are The Constellations?

milky way constellations
Full panoramic view of the constellations near the Milky Way by Matt Dieterich

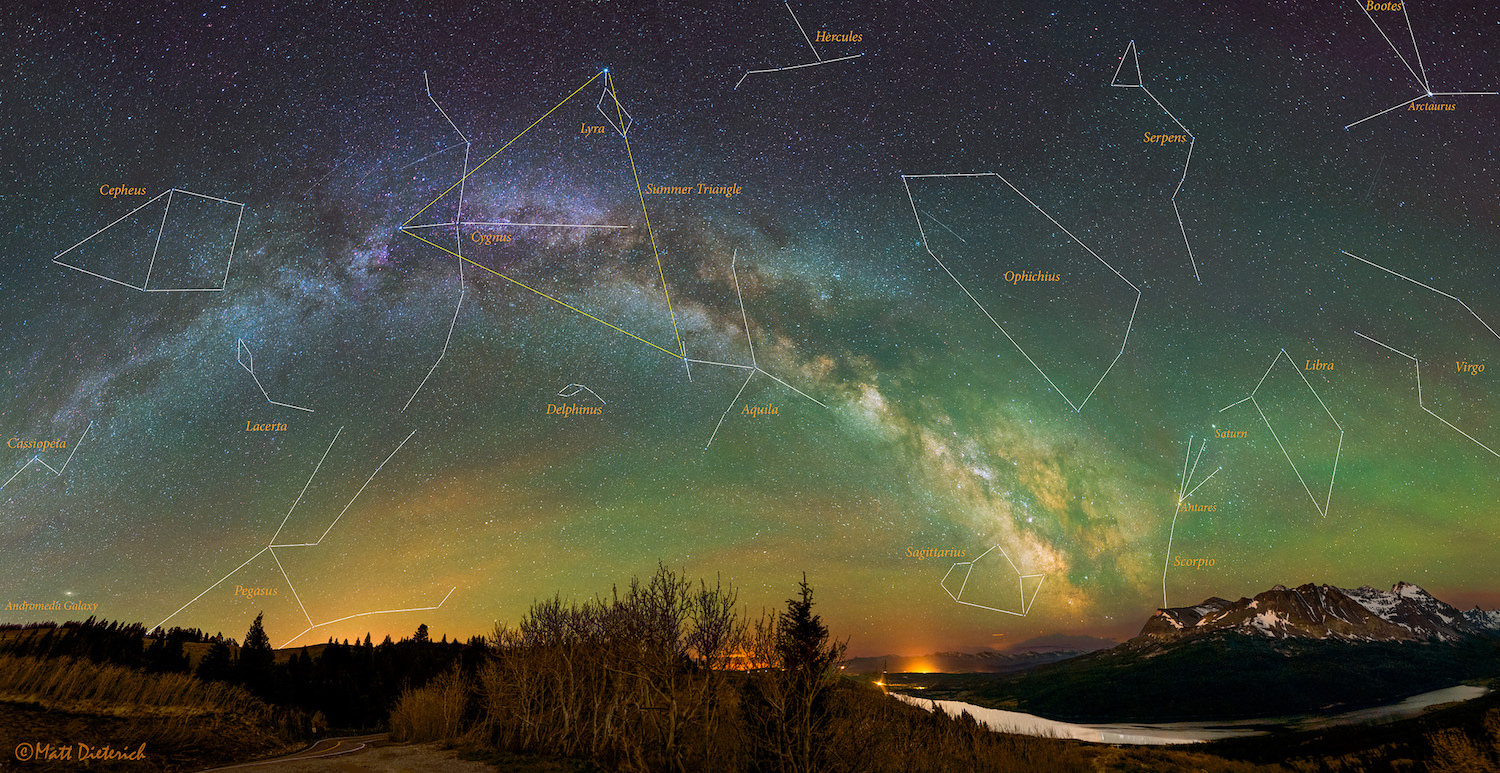
What comes to mind when you look up at the night sky and spot the constellations? Is it a grand desire to explore deep into space? Is it the feeling of awe and wonder, that perhaps these shapes in the sky represent something? Or is the sense that, like countless generations of human beings who have come before you, you are staring into the heavens and seeing patterns? If the answer to any of the above is yes, then you are in good company!

While most people can name at least one constellation, very few know the story of where they came from. Who were the first people to spot them? Where do their names come from? And just how many constellations are there in the sky? Here are a few of the answers, followed by a list of every known constellation, and all the relevant information pertaining to them.

Definition:

A constellation is essentially a specific area of the celestial sphere, though the term is more often associated with a chance grouping of stars in the night sky. Technically, star groupings are known as asterisms, and the practice of locating and assigning names to them is known as asterism. This practice goes back thousands of years, possibly even to the Upper Paleolithic. In fact, archaeological studies have identified markings in the famous cave paintings at Lascaux in southern France (ca. 17,300 years old) that could be depictions of the Pleiades cluster and Orion’s Belt.

There are currently 88 officially recognized constellations in total, which together cover the entire sky. Hence, any given point in a celestial coordinate system can unambiguously be assigned to a constellation. It is also a common practice in modern astronomy, when locating objects in the sky, to indicate which constellation their coordinates place them in proximity to, thus conveying a rough idea of where they can be found.

Closeup of one section of the cave painting at the Lascaux cave complex, showing what could be Pleiades and Orion's Belt. Credit: ancient-wisdom.com
Closeup of the Lascaux cave paintings, showing a bull and what could be the Pleiades Cluster (over the right shoulder) and Orion’s Belt (far left). Credit: ancient-wisdom.com

The word constellation has its roots in the Late Latin term constellatio, which can be translated as “set of stars”. A more functional definition would be a recognizable pattern of stars whose appearance is associated with mythical characters, creatures, or certain characteristics. It’s also important to note that colloquial usage of the word “constellation” does not generally differentiate between an asterism and the area surrounding one.

Typically, stars in a constellation have only one thing in common – they appear near each other in the sky when viewed from Earth. In reality, these stars are often very distant from each other and only appear to line up based on their immense distance from Earth. Since stars also travel on their own orbits through the Milky Way, the star patterns of the constellations change slowly over time.

History of Observation:

It is believed that since the earliest humans walked the Earth, the tradition of looking up at the night sky and assigning names and characters to them existed. However, the earliest recorded evidence of asterism and constellation-naming comes to us from ancient Mesopotamia, and in the form of etchings on clay tablets that are dated to around ca. 3000 BCE.

However, the ancient Babylonians were the first to recognize that astronomical phenomena are periodic and can be calculated mathematically. It was during the middle Bronze Age (ca. 2100 – 1500 BCE) that the oldest Babylonian star catalogs were created, which would later come to be consulted by Greek, Roman and Hebrew scholars to create their own astronomical and astrological systems.

Star map showing the celestial globe of Su Song (1020-1101), a Chinese scientist and mechanical engineer of the Song Dynasty (960-1279). Credit: Wikipedia Commons

In ancient China, astronomical traditions can be traced back to the middle Shang Dynasty (ca. 13th century BCE), where oracle bones unearthed at Anyang were inscribed with the names of star. The parallels between these and earlier Sumerian star catalogs suggest they did no arise independently. Astronomical observations conducted in the Zhanguo period (5th century BCE) were later recorded by astronomers in the Han period (206 BCE – 220 CE), giving rise to the single system of classic Chinese astronomy.

In India, the earliest indications of an astronomical system being developed are attributed to the Indus Valley Civilization (3300–1300 BCE). However, the oldest recorded example of astronomy and astrology is the Vedanga Jyotisha, a study which is part of the wider Vedic literature (i.e. religious) of the time, and which is dated to 1400-1200 BCE.

By the 4th century BCE, the Greeks adopted the Babylonian system and added several more constellations to the mix. By the 2nd century CE, Claudius Ptolemaus (aka. Ptolemy) combined all 48 known constellations into a single system. His treatise, known as the Almagest, would be used by medieval European and Islamic scholars for over a thousand years to come.

Between the 8th and 15th centuries, the Islamic world experienced a burst of scientific development, reaching from the Al-Andus region (modern-day Spain and Portugal) to Central Asia and India. Advancements in astronomy and astrology closely paralleled those made in other fields, where ancient and classical knowledge was assimilated and expanded on.

The Northern Constellations. Credit: Bodel Nijenhuis Collection/Leiden University Library

In turn, Islamic astronomy later had a significant influence on Byzantine and European astronomy, as well as Chinese and West African astronomy (particularly in the Mali Empire). A significant number of stars in the sky, such as Aldebaran and Altair, and astronomical terms such as alidade, azimuth, and almucantar, are still referred to by their Arabic names.

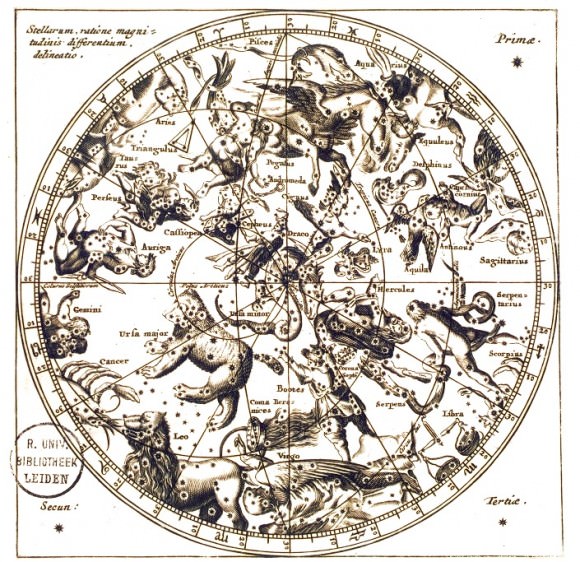
From the end of the 16th century onward, the age of exploration gave rise to circumpolar navigation, which in turn led European astronomers to witness the constellations in the South Celestial Pole for the first time. Combined with expeditions that traveled to the Americas, Africa, Asia, and all other previously unexplored regions of the planet, modern star catalogs began to emerge.

IAU Constellations:

The International Astronomical Union (IAU) currently has a list of 88 accepted constellations. This is largely due to the work of Henry Norris Russell, who in 1922, aided the IAU in dividing the celestial sphere into 88 official sectors. In 1930, the boundaries between these constellations were devised by Eugène Delporte, along vertical and horizontal lines of right ascension and declination.

The IAU list is also based on the 48 constellations listed by Ptolemy in his Almagest, with early modern modifications and additions by subsequent astronomers – such as Petrus Plancius (1552 – 1622), Johannes Hevelius (1611 – 1687), and Nicolas Louis de Lacaille (1713 – 1762).

The modern constellations. color-coded by family, with a dotted line denoting the ecliptic. Credit: NASA/Scientific Visualization Studio
The modern constellations, color-coded by family, with a dotted line denoting the ecliptic. Credit: NASA/Scientific Visualization Studio

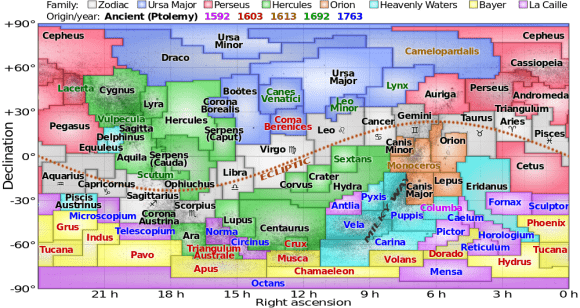
However, the data Delporte used was dated to the late 19th century, back when the suggestion was first made to designate boundaries in the celestial sphere. As a consequence, the precession of the equinoxes has already led the borders of the modern star map to become somewhat skewed, to the point that they are no longer vertical or horizontal. This effect will increase over the centuries and will require revision.

Not a single new constellation or constellation name has been postulated in centuries. When new stars are discovered, astronomers simply add them to the constellation they are closest to. So consider the information below, which lists all 88 constellations and provides information about each, to be up-to-date! We even threw in a few links about the zodiac, its meanings, and dates.

Enjoy your reading!

-A

-B

-C

-D

-E

-F

-G

-H

-I

-L

-M

-N

-O

-P

-R

-S

-T

-U

-V

Messier 1 (M1) – The Crab Nebula

The Crab Nebula (aka. Messier Object 1) is an example of a supernova explosion that emitted cosmic rays. Credit: NASA

In the 18th century, French astronomer Charles Messier kept noting the presence of fixed, diffuse objects in the night sky. Initially, he thought these were comets, which he was attempting to locate at the time. However, astronomers would later discover that these objects were in fact nebulae, galaxies and star clusters. Between the years of 1758 and 1782, Messier compiled a list of approximately 100 of these objects.

His intention was to ensure that other astronomers would not mistake these objects for comets. But in time, this list – known as the Messier Catalog – served a higher purpose. In addition to being a collection of some of the most beautiful objects in the night sky, the catalog was also an important milestone in the discovery and research of Deep Sky objects. The first item in the catalog is the famous Crab Nebula – hence its designation as Messier Object 1, or M1.

Description:

Messier 1 (aka. M1, NGC 1952, Sharpless 244, and the Crab Nebula) is a supernova remnant located in the Perseus Arm of the Milky Way Galaxy, roughly 6500 ± 1600 light years from Earth. Like all supernova remnants, it is an expanding cloud of gas that was created during the explosion of a star. This material is spread over a volume approximately 13 ± 3 ly in diameter, and is still expanding at a velocity of about 1,500 km/s (930 mi/s).

Based on its current rate of expansion, it is assumed that the overall deceleration of the nebula’s expansion must has decreased since the initial supernova. Essentially, after the explosion occurred, the nebula’s pulsar would have began to emit radiation that fed the nebula’s magnetic field, thus expanding it and forcing it outward.

The supernova that produced the Crab Nebula was detected by naked-eye observers around the world in 1054 A.D. This composite image uses data from NASA’s Great Observatories, Chandra, Hubble, and Spitzer, to show that a superdense neutron star is energizing the expanding Nebula by spewing out magnetic fields and a blizzard of extremely high-energy particles. The Chandra X-ray image is shown in light blue, the Hubble Space Telescope optical images are in green and dark blue, and the Spitzer Space Telescope’s infrared image is in red. The size of the X-ray image is smaller than the others because ultrahigh-energy X-ray emitting electrons radiate away their energy more quickly than the lower-energy electrons emitting optical and infrared light. The neutron star is the bright white dot in the center of the image.
The supernova that produced the Crab Nebula was detected by naked-eye observers around the world in 1054 A.D. This composite image uses data from NASA’s Great Observatories, Chandra, Hubble, and Spitzer.

In visible light, the Crab Nebula consists of an oval-shaped mass of filaments – whose spectral emission lines are split into both red and blue-shifted components – which surround a blue central region. The filament are leftover from the outer layers of the former star’s atmosphere, and consist primarily of hydrogen and helium, along with traces of carbon, oxygen, nitrogen and heavier elements. The filaments’ temperatures are typically between 11,000 and 18,000 K.

The blue region, meanwhile, is the result of highly polarized synchrotron radiation, which is emitted by high-energy electrons in a strong magnetic field. The curved path of these electrons is due to the strong magnetic field produced by the neutron star at the center of the nebula (see below). One of the many components of the Crab Nebula is a helium-rich torus which is visible as an east-west band crossing the pulsar region.

The torus accounts for about 25% of the nebula’s visible ejecta and is believed to be made up of 95% helium. As yet, there has been no plausible explanation for the structure of the torus. And while it is very difficult to gauge the total mass of the nebula, official estimates place it at 4.6 ± 1.8 Solar masses – i.e 5.5664 to 12.7232 × 1030 kg.

Crab Pulsar:

At the center of the Crab Nebula are two faint stars, one of which is its progenitor (i.e the one that created it). It is because of this star that M1 is a strong source of radio waves, X-rays and Gamma-ray radiation. The remnant of supernova SN 1054, which was widely observed on Earth in the year 1054, this star was discovered in 1968 and has since been designated as a radio pulsar.

The Crab Nebula Pulsar, M1. Both are sequences of observations that show the expansion of shock waves emanating from the Pulsar interacting with the surrounding nebula. The Crab Pulsar actually pulsates 30 times per second a result of its rotation rate and the relative offset of the magnetic pole. Charndra X-Rays (left), Hubble Visible light (right). (Credit: NASA, JPL-Caltech)
Observation sequences of M1, showing the expansion of shock waves emanating from the Pulsar interacting with the surrounding nebula.  Charndra X-Rays (left), Hubble Visible light (right). (Credit: NASA, JPL-Caltech)

Known as the Crab Pulsar (or NP0532), this rapidly rotating star is believed to be about 28–30 km (17–19 mi) in diameter and emits pulses of radiation – ranging from radio wave and X-ray  – every 33 milliseconds. Like all isolated pulsars, its period is slowing very gradually, and the energy released as the pulsar slows down is enormous. The Crab Pulsar is also the source of the nebula’s synchrotron radiation, which has a total luminosity about 75,000 times greater than that of the Sun.

The pulsar’s extreme energy output also creates an unusually dynamic region at the center of the Crab Nebula. While most astronomical objects only show changes over timescales of many years, the inner parts of the Crab show changes over the course of only a few days. The most dynamic feature in the inner part of the nebula is the point where the pulsar’s equatorial wind slams into the bulk of the nebula, forming a shock front (see above image).

The Crab Pulsar is also surrounded by an expanding gas shell which encompasses its spectroscopic companion star, which in turn orbits the neutron star every 133 days. This pulsar was the first one which was also verified in the optical part of the spectrum.

History of Observation:

The very first recorded information on this supernova event reaches as far back as July 4, 1054 A.D. by Chinese astronomers who marked the presence of a “new star” visible in daylight for 23 days and 653 nights. The event may have also been recorded by the Anasazi, Navajo and Mimbres First Nations of North America in their artwork as well.

Charles Messier, French astronomer, at the age of 40, by Ansiaume. Credit: Public Domain.
Charles Messier, French astronomer, at the age of 40, by Nicolas Ansiaume. Credit: Public Domain.

In more modern times, the nebula was cataloged as a discovery by British amateur astronomer John Bevis in 1731, and independently by Charles Messier on August 28th, 1758 while looking for the return of Comet Halley. Although Bevis had added it to his “Uranographia Britannica”, Messier recognized what he had located had no proper motion, and was therefore not a comet. However, Messier did credit Bevis’ discovery when he learned of it years later.

By September 12th, 1758, Messier hit upon the idea of compiling a catalog of objects that weren’t comets, in order to help other astronomers avoid similar mistakes. Considering M1’s position, only slightly more than a degree from the ecliptic plane, this was a very good idea. Especially since M1 was again confused with Halley’s Comet when it returned in 1835.

The name Crab Nebula was first suggested by William Parsons, the Third Earl of Rosse, who observed it while at Birr Castle in 1884. The name was apparently due to the drawing he made of it, which resembled a crab. When he observed it again in 1848 using a ]telescope with better resolution, he could not confirm the resemblance. But the name had become popular by this point and has stuck ever since.

Our eyes would never see the Crab Nebula or Messier 1 as this Hubble image shows it. Image credit: NASA, ESA, J. Hester and A. Loll (Arizona State University)
Our eyes would never see the Crab Nebula as this Hubble image shows it. Credit: NASA, ESA, J. Hester and A. Loll (Arizona State University)

All of the early observers – including Herschel, Bode, Messier and Lassell – apparently mistook the filamentary structures of the Nebula as an  indication of stellar structure. As Messier himself described it:

“Nebula above the southern horn of Taurus, it doesn’t contain any star; it is a whitish light, elongated in the shape of a flame of a candle, discovered while observing the comet of 1758. See the chart of that comet, Mem. Acad. of the year 1759, page 188; observed by Dr. Bevis in about 1731. It is reported on the English Celestial Atlas.”

Sir Williams Herschel’s writing on the nebula appeared in the 74th volume of the Philosophical Transactions of the Royal Society of London, which was released in 1784. As he described it:

“To these may added the 1st [M1], 3d, 27, 33, 57, 79, 81, 82, 101 [of Messier’s catalog], which in my 7, 10, and 20-feet reflectors shewed a mottled kind of nebulosity, which I shall call resolvable; so that I expect my present telescope will, perhaps, render the stars visible of which I suppose them to be composed…”

Reproduction of the first depiction of the Messier 1 nebula by Lord Rosse (1844) (colour-inverted to appear white-on-black) William Parsons, 3rd Earl of Rosse - http://messier.seds.org/more/m001_rosse.html
Reproduction of the first depiction of the nebula by Lord Rosse (1844). Credit: messier.seds.org

But it was Parsons (aka. Lord Rosse) who first recognized M1 for what we know it as today. As he recorded when viewing it for the first time (in 1844):

“Fig. 81 is also a cluster; we perceive in this [36-inch telescope], however, a considerable change of appearance; it is no longer an oval resolvable [mottled] Nebula; we see resolvable filaments singularly disposed, springing principally from its southern extremity, and not, as is usual in clusters, irregularly in all directions. Probably greater power would bring out other filaments, and it would then assume the ordinary form of a cluster. It is stubbed with stars, mixed however with a nebulosity probably consisting of stars too minute to be recognized. It is an easy object, and I have shown it to many, and all have been at once struck with its remarkable aspect. Everything in the sketch can be seen under moderately favourable circumstances.”

Locating Messier 1:

The Crab Nebula is easily visible in the night sky near the Taurus constellation, whenever light pollution is not an issue. It can be located by identifying Zeta Tauri, a third magnitude star located east/northeast of Aldebaran. With dark sky conditions, it can be seen as a tiny, hazy patch with binoculars and small telescopes with low magnification. If sky conditions are bright, it may be harder to locate with modest equipment.

The constellation Taurus. Credit: iau.org
Messier Object 1 sits between the Taurus, Orion, and Auriga constellations. Credit: iau.org

With a little more magnification, it is seen as a nebulous oval patch, surrounded by haze. In telescopes starting with 4-inch aperture, some detail in its shape becomes apparent, with some suggestion of mottled or streak structure in the inner part of the nebula. To the amateur astronomer, M1 does indeed look similar to a faint comet without a tail.

As Messier 1 is situated only 1 1/2 degrees from the ecliptic, there are frequent conjunctions and occasional transits of planets, as well as occultations by the Moon. And for the sake of simplicity, here are the vital statistics on this Messier Object:

Object Name: Messier 1
Alternative Designations: NGC 1952, M1, Sharpless 244, Crab Nebula
Object Type: Supernova Remnant
Constellation: Taurus
Right Ascension: 05 : 34.5 (h:m)
Declination: +22 : 01 (deg:m)
Distance: 6.3 (kly)
Visual Brightness: 8.4 (mag)
Apparent Dimension: 6×4 (arc min)

We wish you luck in locating it in the night sky. And should you find it, enjoy your observations!

We have written many great articles about the Crab Nebula and Messier Objects here at Universe Today. Here’s What Is The Crab Nebula?, The Peculiar Pulsar in the Crab Nebula, and Top Five Celestial Objects Anyone Can See With A Small Telescope.

Be sure to check out our complete Messier Catalog.

For more information, check out the SEDS Messier Database.

The Orbit of the Planets. How Long Is A Year On The Other Planets?

The Solar System. Image Credit: NASA

Here on Earth, we to end to not give our measurements of time much thought. Unless we’re griping about Time Zones, enjoying the extra day of a Leap Year, or contemplating the rationality of Daylight Savings Time, we tend to take it all for granted. But when you consider the fact that increments like a year are entirely relative, dependent on a specific space and place, you begin to see how time really works.

Here on Earth, we consider a year to be 365 days. Unless of course it’s a Leap Year, which takes place every four years (in which it is 366). But the actual definition of a year is the time it takes our planet to complete a single orbit around the Sun. So if you were to put yourself in another frame of reference – say, another planet – a year would work out to something else. Let’s see just how long a year is on the other planets, shall we?

Continue reading “The Orbit of the Planets. How Long Is A Year On The Other Planets?”

Why Do We Sometimes See a Ring Around the Moon?

Moon halo by Rob Sparks
Moon halo by Rob Sparks. Taken in Tuscon, Arizona with a Canon 6D, Rokinon 14mm f/2.8 lens.

Have you ever looked up on a clear night and noticed there’s a complete ring around the Moon? In fact, if you look closely, the ring can have a rainbow appearance, with bright spots on either side, or above and below. What’s going on with the Moon and the atmosphere to cause this effect?

This ring surrounding the Moon is caused by the refraction of Moonlight (which is really reflected sunlight, of course) through ice crystals suspended in the upper atmosphere between 5-10 km in altitude. It doesn’t have to be winter, since the cold temperatures at high altitudes are below freezing any time of the year. Generally they’re seen with cirrus clouds; the thin, wispy clouds at high altitude.

The ice crystals themselves have a very consistent hexagonal shape, which means that any light passing through them will always refract light – or bend – at the same angle.

640px-Path_of_rays_in_a_hexagonal_prism
Path of rays in a hexagonal prism” by donalbein – Own work. Licensed under CC BY-SA 2.5 via Commons.
Moonlight passes through one facet of the ice crystal, and is then refracted back out at exactly the angle of 22-degrees.

Of course, the atmosphere is filled with an incomprehensible number of crystals, all refracting moonlight off in different directions. But at any moment, a huge number happen to be in just the right position to be refracting light towards your eyes. You just aren’t in a position to see all the other refracted light. In fact, everyone sees their own private halo, because you’re only seeing the crystals that happen to be aligning the light for your specific location. Someone a few meters beside you is seeing their own private version of the halo – just like a rainbow.

A halo rings the bright moon and planet Jupiter (left of moon) Credit: Bob King

The size of the ring is most commonly 22-degrees. This is about the same size as your open hand on your outstretched arm. The Moon itself, for comparison, is the size of your smallest nail when you hold out your hand.

The 22-degree size corresponds to the refraction angle of moonlight.

We see a rainbow because the different colors are refracted at slightly different angles. This is exactly what happens with a rainbow. The moonlight is broken up into its separate colors because they all refract at different angles, and so you see the colors split up like a rainbow.

Lunar halo by Gustav Sanchez
Lunar halo with rainbow. Photo credit: Gustav Sanchez.
Moon dogs (or “mock moons”) are seen as bright spots that can appear on either side of the Moon, when the Moon is closer to the horizon, and at its fullest. These are located on either side of the lunar ring, parallel to the horizon.

In certain conditions, especially in the Arctic, where the ice crystals can be close to the surface, you can get a moon pillar. The light from the Moon reflects off the ice crystals near the surface, creating a glow near the horizon.

Sun pillar by Mary Spicer
This is a Sun pillar (not a moon pillar), but it’s the same general idea. Photo credit: Mary Spicer.

Want to see more? Here’s a great lunar halo photo from NASA’s APOD. And here’s more info from Earth and Sky.

How Long Would It Take To Travel To The Nearest Star?

Artist's concept of an Enzmann starship, a fusion rocket concept proposed in 1964. Credit: Rick Sternbach

We’ve all asked this question at some point in our lives: How long would it take to travel to the stars? Could it be within a person’s own lifetime, and could this kind of travel become the norm someday? There are many possible answers to this question – some very simple, others in the realms of science fiction. But coming up with a comprehensive answer means taking a lot of things into consideration.

Unfortunately, any realistic assessment is likely to produce answers that would totally discourage futurists and enthusiasts of interstellar travel. Like it or not, space is very large, and our technology is still very limited. But should we ever contemplate “leaving the nest”, we will have a range of options for getting to the nearest Solar Systems in our galaxy.

Continue reading “How Long Would It Take To Travel To The Nearest Star?”

How Long Is A Day On The Other Planets Of The Solar System?

Planets and other objects in our Solar System. Credit: NASA.

Here on Earth, we tend to take time for granted, never suspected that the increments with which we measure it are actually quite relative. The ways in which we measure our days and years, for example, are actually the result of our planet’s distance from the Sun, the time it takes to orbit, and the time it takes to rotate on its axis. The same is true for the other planets in our Solar System.

While we Earthlings count on a day being about 24 hours from sunup to sunup, the length of a single day on another planet is quite different. In some cases, they are very short, while in others, they can last longer than years – sometimes considerably! Let’s go over how time works on other planets and see just how long their days can be, shall we?

A Day On Mercury:

Mercury is the closest planet to our Sun, ranging from 46,001,200 km at perihelion (closest to the Sun) to 69,816,900 km at aphelion (farthest). Since it takes 58.646 Earth days for Mercury to rotate once on its axis – aka. its sidereal rotation period – this means that it takes just over 58 Earth days for Mercury to experience a single day.

However, this is not to say that Mercury experiences two sunrises in just over 58 days. Due to its proximity to the Sun and rapid speed with which it circles it, it takes the equivalent of 175.97 Earth days for the Sun to reappear in the same place in the sky. Hence, while the planet rotates once every 58 Earth days, it is roughly 176 days from one sunrise to the next on Mercury.

Images of Mercury's northern polar region, provided by MESSENGER. Credit: NASA/JPL
Images of Mercury’s northern polar region, provided by MESSENGER. Credit: NASA/JPL

What’s more, it only takes Mercury 87.969 Earth days to complete a single orbit of the Sun (aka. its orbital period). This means a year on Mercury is the equivalent of about 88 Earth days, which in turn means that a single Mercurian (or Hermian) year lasts just half as long as a Mercurian day.

What’s more, Mercury’s northern polar regions are constantly in the shade. This is due to it’s axis being tilted at a mere 0.034° (compared to Earth’s 23.4°), which means that it does not experience extreme seasonal variations where days and nights can last for months depending on the season. On the poles of Mercury, it is always dark and shady. So you could say the poles are in a constant state of twilight.

A Day On Venus:

Also known as “Earth’s Twin”, Venus is the second closest planet to our Sun – ranging from 107,477,000 km at perihelion to 108,939,000 km at aphelion. Unfortunately, Venus is also the slowest moving planet, a fact which is made evident by looking at its poles. Whereas every other planet in the Solar System has experienced flattening at their poles due to the speed of their spin, Venus has experienced no such flattening.

Venus has a rotational velocity of just 6.5 km/h (4.0 mph) – compared to Earth’s rational velocity of 1,670 km/h (1,040 mph) – which leads to a sidereal rotation period of 243.025 days. Technically, it is -243.025 days, since Venus’ rotation is retrograde. This means that Venus rotates in the direction opposite to its orbital path around the Sun.

The planet Venus, as imagined by the Magellan 10 mission. Credit: NASA/JPL

So if you were above Venus’ north pole and watched it circle around the Sun, you would see it is moving clockwise, whereas its rotation is counter-clockwise. Nevertheless, this still means that Venus takes over 243 Earth days to rotate once on its axis. However, much like Mercury, Venus’ orbital speed and slow rotation means that a single solar day – the time it takes the Sun to return to the same place in the sky – lasts about 117 days.

So while a single Venusian (or Cytherean) year works out to 224.701 Earth days, it experiences less than two full sunrises and sunsets in that time. In fact, a single Venusian/Cytherean year lasts as long as 1.92 Venusian/Cytherean days. Good thing Venus has other things in common With Earth, because it is sure isn’t its diurnal cycle!

A Day On Earth:

When we think of a day on Earth, we tend to think of it as a simple 24 hour interval. In truth, it takes the Earth exactly 23 hours 56 minutes and 4.1 seconds to rotate once on its axis. Meanwhile, on average, a solar day on Earth is 24 hours long, which means it takes that amount of time for the Sun to appear in the same place in the sky. Between these two values, we say a single day and night cycle lasts an even 24.

At the same time, there are variations in the length of a single day on the planet based on seasonal cycles. Due to Earth’s axial tilt, the amount of sunlight experienced in certain hemispheres will vary. The most extreme case of this occurs at the poles, where day and night can last for days or months depending on the season.

At the North and South Poles during the winter, a single night can last up to six months, which is known as a “polar night”. During the summer, the poles will experience what is called a “midnight sun”, where a day lasts a full 24 hours. So really, days are not as simple as we like to imagine. But compared to the other planets in the Solar System, time management is still easier here on Earth.

A Day On Mars:

In many respects, Mars can also be called “Earth’s Twin”. In addition to having polar ice caps, seasonal variations , and water (albeit frozen) on its surface, a day on Mars is pretty close to what a day on Earth is. Essentially, Mars takes 24 hours 37 minutes and 22 seconds to complete a single rotation on its axis. This means that a day on Mars is equivalent to 1.025957 days.

The seasonal cycles on Mars, which are due to it having an axial tilt similar to Earth’s (25.19° compared to Earth’s 23.4°), are more similar to those we experience on Earth than on any other planet. As a result, Martian days experience similar variations, with the Sun rising sooner and setting later in the summer and then experiencing the reverse in the winter.

However, seasonal variations last twice as long on Mars, thanks to Mars’ being at a greater distance from the Sun. This leads to the Martian year being about two Earth years long – 686.971 Earth days to be exact, which works out to 668.5991 Martian days (or Sols). As a result, longer days and longer nights can be expected last much longer on the Red Planet. Something for future colonists to consider!

Sunrise at Gale Crater on Mars. Gale is at center top with the mound in the middle, called Mt. Sharp (Aeolis Mons.)

A Day On Jupiter:

Given the fact that it is the largest planet in the Solar System, one would expect that a day on Jupiter would last a long time. But as it turns out, a Jovian day is officially only 9 hours, 55 minutes and 30 seconds long, which means a single day is just over a third the length of an Earth day. This is due to the gas giant having a very rapid rotational speed, which is 12.6 km/s (45,300 km/h, or 28148.115 mph) at the equator. This rapid rotational speed is also one of the reasons the planet has such violent storms.

Note the use of the word officially. Since Jupiter is not a solid body, its upper atmosphere undergoes a different rate of rotation compared to its equator. Basically, the rotation of Jupiter’s polar atmosphere is about 5 minutes longer than that of the equatorial atmosphere. Because of this, astronomers use three systems as frames of reference.

System I applies from the latitudes 10° N to 10° S, where its rotational period is the planet’s shortest, at 9 hours, 50 minutes, and 30 seconds. System II applies at all latitudes north and south of these; its period is 9 hours, 55 minutes, and 40.6 seconds. System III corresponds to the rotation of the planet’s magnetosphere, and it’s period is used by the IAU and IAG to define Jupiter’s official rotation (i.e. 9 hours 44 minutes and 30 seconds)

Jupiter and Io. Image Credit: NASA/JPL
Jupiter and Io capturing the Sun. Image Credit: NASA/JPL

So if you could, theoretically, stand on the cloud tops of Jupiter (or possibly on a floating platform in geosynchronous orbit), you would witness the sun rising an setting in the space of less than 10 hours from any latitude. And in the space of a single Jovian year, the sun would rise and set a total of about 10,476 times.

A Day On Saturn:

Saturn’s situation is very similar to that of Jupiter’s. Despite its massive size, the planet has an estimated rotational velocity of 9.87 km/s (35,500 km/h, or 22058.677 mph). As such Saturn takes about 10 hours and 33 minutes to complete a single sidereal rotation, making a single day on Saturn less than half of what it is here on Earth. Here too, this rapid movement of the atmosphere leads to some super storms, not to mention the hexagonal pattern around the planet’s north pole and a vortex storm around its south pole.

And, also like Jupiter, Saturn takes its time orbiting the Sun. With an orbital period that is the equivalent of 10,759.22 Earth days (or 29.4571 Earth years), a single Saturnian (or Cronian) year lasts roughly 24,491 Saturnian days. However, like Jupiter, Saturn’s atmosphere rotates at different speed depending on latitude, which requires that astronomers use three systems with different frames of reference.

System I encompasses the Equatorial Zone, the South Equatorial Belt and the North Equatorial Belt, and has a period of 10 hours and 14 minutes. System II covers all other Saturnian latitudes, excluding the north and south poles, and have been assigned a rotation period of 10 hr 38 min 25.4 sec. System III uses radio emissions to measure Saturn’s internal rotation rate, which yielded a rotation period of 10 hr 39 min 22.4 sec.

This portrait looking down on Saturn and its rings was created from images obtained by NASA's Cassini spacecraft on Oct. 10, 2013. Credit: NASA/JPL-Caltech/Space Science Institute/G. Ugarkovic
This portrait looking down on Saturn and its rings was created from images obtained by NASA’s Cassini spacecraft on Oct. 10, 2013. Credit: NASA/JPL-Caltech/Space Science Institute/G. Ugarkovic

Using these various systems, scientists have obtained different data from Saturn over the years. For instance, data obtained during the 1980’s by the Voyager 1 and 2 missions indicated that a day on Saturn was 10 hours 39 minutes and 24 seconds long. In 2004, data provided by the Cassini-Huygens space probe measured the planet’s gravitational field, which yielded an estimate of 10 hours, 45 minutes, and 45 seconds (± 36 sec).

In 2007, this was revised by researches at the Department of Earth, Planetary, and Space Sciences, UCLA, which resulted in the current estimate of 10 hours and 33 minutes. Much like with Jupiter, the problem of obtaining accurate measurements arises from the fact that, as a gas giant, parts of Saturn rotate faster than others.

A Day On Uranus:

When we come to Uranus, the question of how long a day is becomes a bit complicated. One the one hand, the planet has a sidereal rotation period of 17 hours 14 minutes and 24 seconds, which is the equivalent of 0.71833 Earth days. So you could say a day on Uranus lasts almost as long as a day on Earth. It would be true, were it not for the extreme axial tilt this gas/ice giant has going on.

With an axial tilt of 97.77°, Uranus essentially orbits the Sun on its side. This means that either its north or south pole is pointed almost directly at the Sun at different times in its orbital period. When one pole is going through “summer” on Uranus, it will experience 42 years of continuous sunlight. When that same pole is pointed away from the Sun (i.e. a Uranian “winter”), it will experience 42 years of continuous darkness.

Uranus as seen by NASA's Voyager 2. Credit: NASA/JPL
Uranus as seen by NASA’s Voyager 2. Credit: NASA/JPL

Hence, you might say that a single day – from one sunrise to the next – lasts a full 84 years on Uranus! In other words, a single Uranian day is the same amount of time as a single Uranian year (84.0205 Earth years).

In addition, as with the other gas/ice giants, Uranus rotates faster at certain latitudes. Ergo, while the planet’s rotation is 17 hours and 14.5 minutes at the equator, at about 60° south, visible features of the atmosphere move much faster, making a full rotation in as little as 14 hours.

A Day On Neptune:

Last, but not least, we have Neptune. Here too, measuring a single day is somewhat complicated. For instance, Neptune’s sidereal rotation period is roughly 16 hours, 6 minutes and 36 seconds (the equivalent of 0.6713 Earth days). But due to it being a gas/ice giant, the poles of the planet rotate faster than the equator.

Whereas the planet’s magnetic field has a rotational speed of 16.1 hours, the wide equatorial zone rotates with a period of about 18 hour. Meanwhile, the polar regions rotate the fastest, at a period of 12 hours. This differential rotation is the most pronounced of any planet in the Solar System, and it results in strong latitudinal wind shear.

Reconstruction of Voyager 2 images showing the Great Black spot (top left), Scooter (middle), and the Small Black Spot (lower right). Credit: NASA/JPL

In addition, the planet’s axial tilt of 28.32° results in seasonal variations that are similar to those on Earth and Mars. The long orbital period of Neptune means that the seasons last for forty Earth years. But because its axial tilt is comparable to Earth’s, the variation in the length of its day over the course of its long year is not any more extreme.

As you can see from this little rundown of the different planets in our Solar System, what constitutes a day depends entirely on your frame of reference. In addition to it varying depending on the planet in question, you also have to take into account seasonal cycles and where on the planet the measurements are being taken from.

As Einstein summarized, time is relative to the observer. Based on your inertial reference frame, its passage will differ. And when you are standing on a planet other than Earth, your concept of day and night, which is set to Earth time (and a specific time zone) is likely to get pretty confused!

We have written many interesting articles about how time is measured on other planets here at Universe Today. For example, here’s How Long Is A Year On The Other Planets?, Which Planet Has the Longest Day?, The Rotation of Venus, How Long Is A Day on Mars? and How Long Is A Day On Jupiter?.

If you are looking for more information, check out Our Solar System at Space.com

Astronomy Cast has episodes on all the planets, including Episode 49: Mercury, and Episode 95: Humans to Mars, Part 2 – Colonists

What Is The Plum Pudding Atomic Model?

Diagram of J.J. Thomson's "Plum Pudding Model" of the atom. Credit: boundless.com

Ever since it was first proposed by Democritus in the 5th century BCE, the atomic model has gone through several refinements over the past few thousand years. From its humble beginnings as an inert, indivisible solid that interacts mechanically with other atoms, ongoing research and improved methods have led scientists to conclude that atoms are actually composed of even smaller particles that interact with each other electromagnetically.

This was the basis of the atomic theory devised by English physicist J.J. Thompson in the late 19th an early 20th centuries. As part of the revolution that was taking place at the time, Thompson proposed a model of the atom that consisted of more than one fundamental unit. Based on its appearance, which consisted of a “sea of uniform positive charge” with electrons distributed throughout, Thompson’s model came to be nicknamed the “Plum Pudding Model”.

Though defunct by modern standards, the Plum Pudding Model represents an important step in the development of atomic theory. Not only did it incorporate new discoveries, such as the existence of the electron, it also introduced the notion of the atom as a non-inert, divisible mass. Henceforth, scientists would understand that atoms were themselves composed of smaller units of matter and that all atoms interacted with each other through many different forces.

Atomic Theory to the 19th century:

The earliest known examples of atomic theory come from ancient Greece and India, where philosophers such as Democritus postulated that all matter was composed of tiny, indivisible and indestructible units. The term “atom” was coined in ancient Greece and gave rise to the school of thought known as “atomism”. However, this theory was more of a philosophical concept than a scientific one.

Various atoms and molecules as depicted in John Dalton’s A New System of Chemical Philosophy (1808). Credit: Public Domain

It was not until the 19th century that the theory of atoms became articulated as a scientific matter, with the first evidence-based experiments being conducted. For example, in the early 1800s, English scientist John Dalton used the concept of the atom to explain why chemical elements reacted in certain observable and predictable ways.

Dalton began with the question of why elements reacted in ratios of small whole numbers and concluded that these reactions occurred in whole-number multiples of discrete units – i.e. atoms. Through a series of experiments involving gases, Dalton went on to develop what is known as Dalton’s Atomic Theory. This theory expanded on the laws of conversation of mass and definite proportions – formulated by the end of the 18th century – and remains one of the cornerstones of modern physics and chemistry.

The theory comes down to five premises: elements, in their purest state, consist of particles called atoms; atoms of a specific element are all the same, down to the very last atom; atoms of different elements can be told apart by their atomic weights; atoms of elements unite to form chemical compounds; atoms can neither be created or destroyed in chemical reaction, only the grouping ever changes.

By the late 19th century, scientists also began to theorize that the atom was made up of more than one fundamental unit. However, most scientists ventured that this unit would be the size of the smallest known atom – hydrogen. By the end of the 19th century, the situation would change drastically.

Lateral view of a sort of a Crookes tube with a standing cross. Credit: Wikipedia Commons/D-Kuru
Lateral view of a sort of a Crookes tube with a standing cross. Credit: Wikimedia Commons/D-Kuru

Thompson’s Experiments:

Sir Joseph John Thomson (aka. J.J. Thompson) was an English physicist and the Cavendish Professor of Physics at the University of Cambridge from 1884 onwards. During the 1880s and 1890s, his work largely revolved around developing mathematical models for chemical processes, the transformation of energy in mathematical and theoretical terms, and electromagnetism.

However, by the late 1890s, he began conducting experiments using a cathode ray tube known as the Crookes’ Tube. This consists of a sealed glass container with two electrodes that are separated by a vacuum. When voltage is applied across the electrodes, cathode rays are generated (which take the form of a glowing patch of gas that stretches to the far end of the tube).

Through experimentation, Thomson observed that these rays could be deflected by electric and magnetic fields. He concluded that rather than being composed of light, they were made up of negatively charged particles he called “corpuscles”. Upon measuring the mass-to-charge ration of these particles, he discovered that they were 1ooo times smaller and 1800 times lighter than hydrogen.

This effectively disproved the notion that the hydrogen atom was the smallest unit of matter, and Thompson went further to suggest that atoms were divisible. To explain the overall charge of the atom, which consisted of both positive and negative charges, Thompson proposed a model whereby the negatively charged corpuscles were distributed in a uniform sea of positive charge.

A depiction of the atomic structure of the helium atom. Credit: Creative Commons

These corpuscles would later be named “electrons”, based on the theoretical particle predicted by Anglo-Irish physicist George Johnstone Stoney in 1874. And from this, the Plum Pudding Model was born, so named because it closely resembled the English desert that consists of plum cake and raisins. The concept was introduced to the world in the March 1904 edition of the UK’s Philosophical Magazine, to wide acclaim.

Problems With the Plum Pudding Model:

Unfortunately, subsequent experiments revealed a number of scientific problems with the model. For starters, there was the problem of demonstrating that the atom possessed a uniform positive background charge, which came to be known as the “Thomson Problem”. Five years later, the model would be disproved by Hans Geiger and Ernest Marsden, who conducted a series of experiments using alpha particles and gold foil.

In what would come to be known as the “gold foil experiment“, they measured the scattering pattern of the alpha particles with a fluorescent screen. If Thomson’s model were correct, the alpha particles would pass through the atomic structure of the foil unimpeded. However, they noted instead that while most shot straight through, some of them were scattered in various directions, with some going back in the direction of the source.

Geiger and Marsden concluded that the particles had encountered an electrostatic force far greater than that allowed for by Thomson’s model. Since alpha particles are just helium nuclei (which are positively charged) this implied that the positive charge in the atom was not widely dispersed, but concentrated in a tiny volume. In addition, the fact that those particles that were not deflected passed through unimpeded meant that these positive spaces were separated by vast gulfs of empty space.

The anticipated results of the Gieger-Marsden experiment (left), compared to the actual results (right). Credit: Wikimedia Commons/Kurzon
The anticipated results of the Gieger-Marsden experiment (left), and the actual results (right). Credit: Wikimedia Commons/Kurzon

.

By 1911, physicist Ernest Rutherford interpreted the Geiger-Marsden experiments and rejected Thomson’s model of the atom. Instead, he proposed a model where the atom consisted of mostly empty space, with all its positive charge concentrated in its center in a very tiny volume, that was surrounded by a cloud of electrons. This came to be known as the Rutherford Model of the atom.

Subsequent experiments by Antonius Van den Broek and Neils Bohr refined the model further. While Van den Broek suggested that the atomic number of an element is very similar to its nuclear charge, the latter proposed a Solar-System-like model of the atom, where a nucleus contains the atomic number of positive charge and is surrounded by an equal number of electrons in orbital shells (aka. the Bohr Model).

Though it would come to be discredited in just five years time, Thomson’s “Plum Pudding Model” would prove to be a crucial step in the development of the Standard Model of particle physics. His work in determining that atom’s were divisible, as well as the existence of electromagnetic forces within the atom, would also prove to be major influence on the field of quantum physics.

We have written many interesting articles on the subject of atomic theory here at Universe Today. For instance, here is How Many Atoms Are There In The Universe?, John Dalton’s Atomic Model, What Are The Parts Of The Atom?, Bohr’s Atomic Model,

For more information, be sure to check out Physic’s Worlds pages on 100 years of the electron: from discovery to application and Proton and neutron masses calculated from first principles

Astronomy Cast also has some episodes on the subject: Episode 138: Quantum Mechanics, Episode 139: Energy Levels and Spectra, Episode 378: Rutherford and Atoms and Episode 392: The Standard Model – Intro.

What Are The Uses Of Electromagnets?

The Large Hadron Collider at CERN. Credit: CERN/LHC

Electromagnetism is one of the fundamental forces of the universe, responsible for everything from electric and magnetic fields to light. Originally, scientists believed that magnetism and electricity were separate forces. But by the late 19th century, this view changed, as research demonstrated conclusively that positive and negative electrical charges were governed by one force (i.e. magnetism).

Since that time, scientists have sought to test and measure electromagnetic fields, and to recreate them. Towards this end, they created electromagnets, a device that uses electrical current to induce a magnetic field. And since their initial invention as a scientific instrument, electromagnets have gone on to become a regular feature of electronic devices and industrial processes.

Continue reading “What Are The Uses Of Electromagnets?”