Messier 30 – The NGC 7099 Globular Cluster

The Messier 30 globular cluster, in proximigy to other deep sky objects in the direction of the Capricornus constellation. Credit: Wikisky

Welcome back to Messier Monday! In our ongoing tribute to the great Tammy Plotner, we take a look at the globular cluster known as Messier 30. Enjoy!

During the 18th century, famed French astronomer Charles Messier noted the presence of several “nebulous objects” in the night sky. Having originally mistaken them for comets, he began compiling a list of them so that others would not make the same mistake he did. In time, this list (known as the Messier Catalog) would come to include 100 of the most fabulous objects in the night sky.

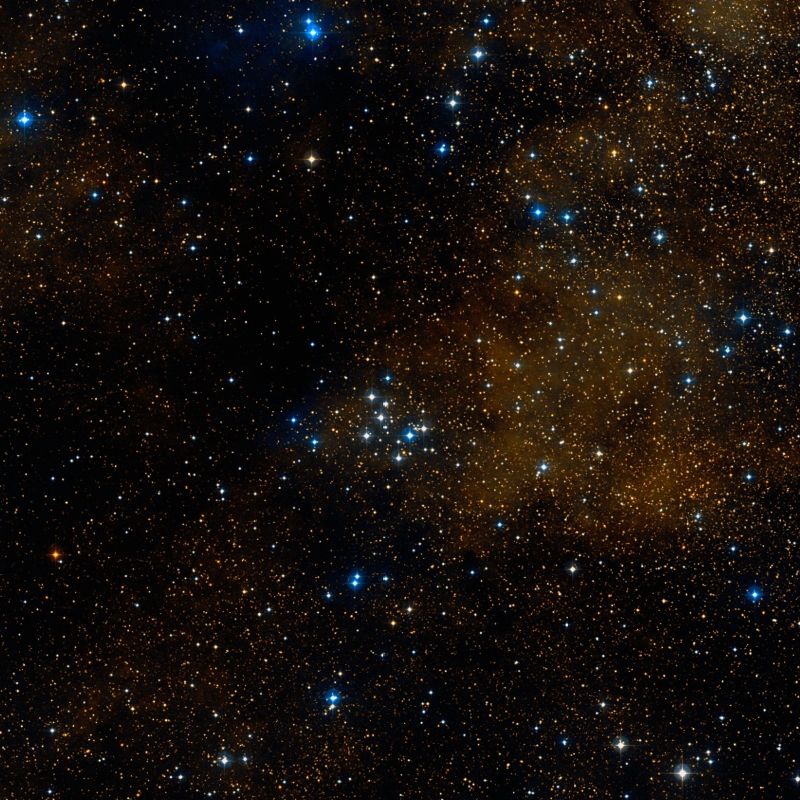
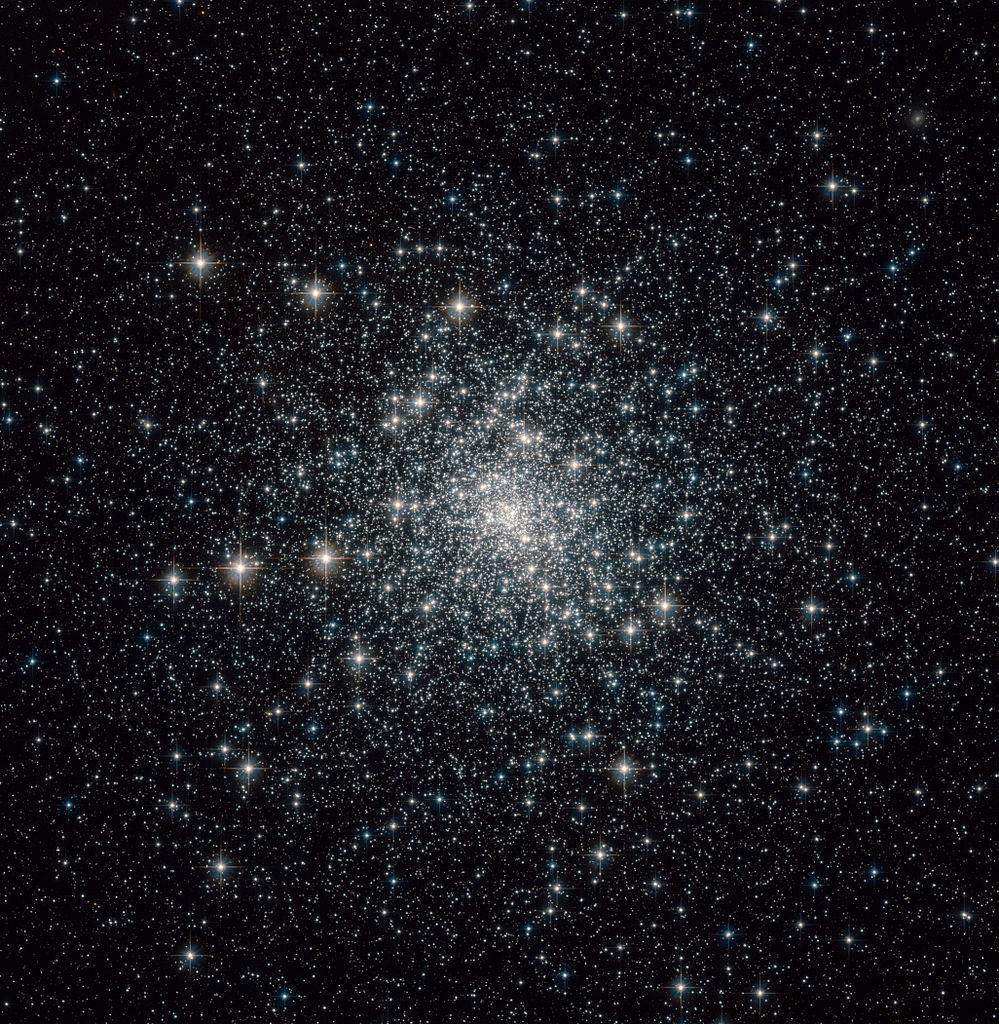
One of these objects is Messier 30, a globular cluster located in the southern constellation of Capricornus. Owing to its retrograde orbit through the inner galactic halo, it is believed that this cluster was acquired from a satellite galaxy in the past. Though it is invisible to the naked eye, this cluster can be viewed using little more than binoculars, and is most visible during the summer months.

Description:

Messier measures about 93 light years across and lies at a distance of about 26,000 light years from Earth, and approaching us at a speed of about 182 kilometers per second. While it looks harmless enough, its tidal influence covers an enormous 139 light years – far greater than its apparent size.

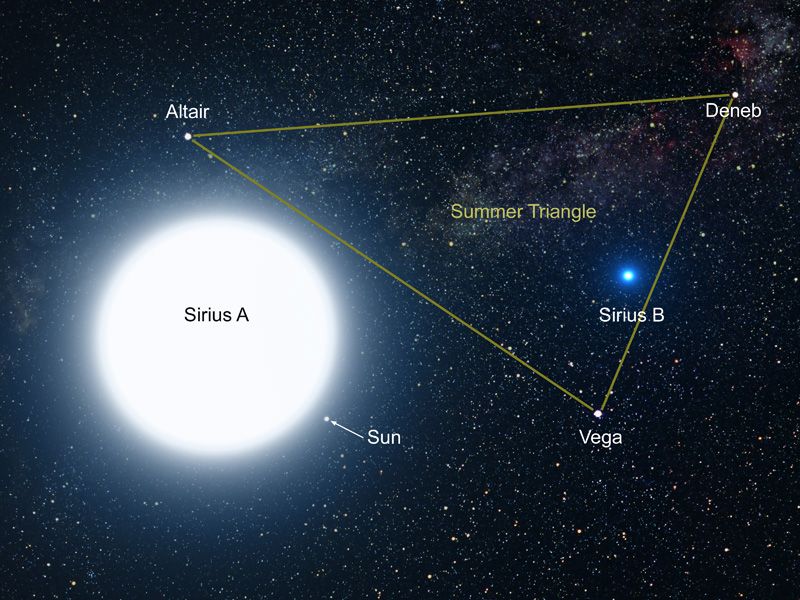
Half of its mass is so concentrated that literally thousands of stars could be compressed in an area that spans no further than the distance between our solar system and Sirius! However, inside this density only 12 variable stars have been found and very little evidence of any stellar collisions, although a dwarf nova has been recorded!

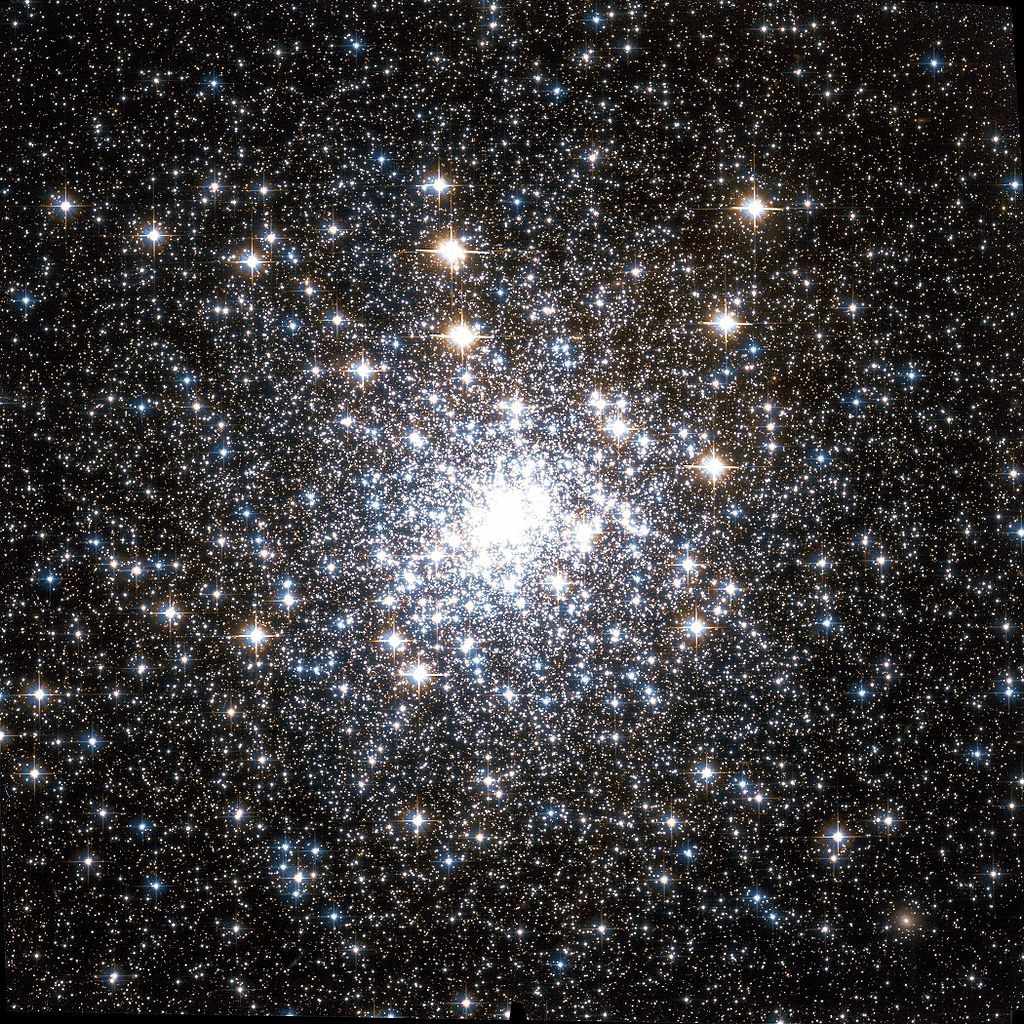
So what’s so special about this little globular? Try a collapsed core – and one that’s even been resolved by Earth-bound telescopes. According to Bruce Jones Sams III, an astrophysicists at Harvard University:

“The globular cluster NGC 7099 is a prototypical collapsed core cluster. Through a series of instrumental, observational, and theoretical observations, I have resolved its core structure using a ground based telescope. The core has a radius of 2.15 arcsec when imaged with a V band spatial resolution of 0.35 arcsec. Initial attempts at speckle imaging produced images of inadequate signal to noise and resolution. To explain these results, a new, fully general signal-to-noise model has been developed. It properly accounts for all sources of noise in a speckle observation, including aliasing of high spatial frequencies by inadequate sampling of the image plane. The model, called Full Speckle Noise (FSN), can be used to predict the outcome of any speckle imaging experiment. A new high resolution imaging technique called ACT (Atmospheric Correlation with a Template) was developed to create sharper astronomical images. ACT compensates for image motion due to atmospheric turbulence.”

Photography is an important tool for astronomers to work with – both land and space-based. By combining results, we can learn far more than just from the results of one telescope observation alone. As Justin H. Howell wrote in a 1999 study:

“It has long been known that the post-core-collapse globular cluster M30 (NGC 7099) has a bluer-inward color gradient, and recent work suggests that the central deficiency of bright red giant stars does not fully account for this gradient. This study uses Hubble Space Telescope Wide Field Planetary Camera 2 images in the F439W and F555W bands, along with ground-based CCD images with a wider field of view for normalization of the noncluster background contribution. The quoted uncertainty accounts for Poisson fluctuations in the small number of bright evolved stars that dominate the cluster light. We explore various algorithms for artificially redistributing the light of bright red giants and horizontal-branch stars uniformly across the cluster. The traditional method of redistribution in proportion to the cluster brightness profile is shown to be inaccurate. There is no significant residual color gradient in M30 after proper uniform redistribution of all bright evolved stars; thus, the color gradient in M30’s central region appears to be caused entirely by post-main-sequence stars.”

Image of Messier 30 (M 30, NGC 7099) was taken by Hubble’s Advanced Camera for Surveys (ACS). Credit: NASA/ESA

So what happens when you dig even deeper with a different type of photography? Just ask the folks from Chandra – like Phyllis M. Lugger, who wrote in her study, “Chandra X-ray Sources in the Collapsed-Core Globular Cluster M30 (NGC 7099)“:

“We report the detection of six discrete, low-luminosity X-ray sources, located within 12” of the center of the collapsed-core globular cluster M30 (NGC 7099), and a total of 13 sources within the half-mass radius, from a 50 ks Chandra ACIS-S exposure. Three sources lie within the very small upper limit of 1.9” on the core radius. The brightest of the three core sources has a blackbody-like soft X-ray spectrum, which is consistent with it being a quiescent low-mass X-ray binary (qLMXB). We have identified optical counterparts to four of the six central sources and a number of the outlying sources, using deep Hubble Space Telescope and ground-based imaging. While the two proposed counterparts that lie within the core may represent chance superpositions, the two identified central sources that lie outside of the core have X-ray and optical properties consistent with being cataclysmic variables (CVs). Two additional sources outside of the core have possible active binary counterparts.”

History of Observation:

When Charles Messier first encountered this globular cluster in 1764, he was unable to resolve individual stars, and mistakenly believed it to be a nebula. As he wrote in his notes at the time:

“In the night of August 3 to 4, 1764, I have discovered a nebula below the great tail of Capricornus, and very near the star of sixth magnitude, the 41st of that constellation, according to Flamsteed: one sees that nebula with difficulty in an ordinary [non-achromatic] refractor of 3 feet; it is round, and I have not seen any star: having examined it with a good Gregorian telescope which magnifies 104 times, it could have a diameter of 2 minutes of arc. I have compared the center with the star Zeta Capricorni, and I have determined its position in right ascension as 321d 46′ 18″, and its declination as 24d 19′ 4″ south. This nebula is marked in the chart of the famous Comet of Halley which I observed at its return in 1759.”

Image of the core region of Messier 30 by the Hubble Space Telescope. Credit: NASA

However, we cannot fault Messier, for his job was to hunt comets and we thank him for logging this object for further study. Perhaps the first clue to M30’s underlying potential came from Sir William Herschel, who often studied Messier’s objects, but did not report his findings formally. In his personal notes he wrote:

“A brilliant cluster, the stars of which are gradually more compressed in the middle. It is insulated, that is, none of the stars in the neighborhood are likely to be connected with it. Its diameter is from 2’40” to 3’30”. The figure is irregularly round. The stars about the centre are so much compressed as to appear to run together. Towards the north, are two rows of bright stars 4 or 5 in a line. In this accumulation of stars, we plainly see the exertion of a central clustering power, which may reside in a central mass, or, what is more probable, in the compound energy of the stars about the centre. The lines of bright stars, although by a drawing made at the time of observation, one of them seems to pass through the cluster, are probably not connected with it.”

So, as telescopes progressed and resolution improved, so did our way of thinking about what we were seeing… By Admiral Smyth’s time, things had improved even more and so had the art of understanding more:

“A fine pale white cluster, under the creature’s caudal fin, and about 20 deg west-north-west of Fomalhaut, where it precedes 41 Capricorni, a star of 5th magnitude, within a degree. This object is bright, and from the straggling streams of stars on its northern verge, has an elliptical aspect, with a central blaze; and there are but few other stars, or outliers, in the field.

“When Messier discovered this, in 1764, he remarked that it was easily seen with a 3 1/2-foot telescope, that it was a nebula, unaccompanied by any star, and that its form was circular. But in 1783 it was attacked by WH [William Herschel] with both his 20-foot Newtonians, and forthwith resolved into a brilliant cluster, with two rows pf stars, four or five in a line, which probably belong to it; and therefore he deemed it insulated. Independently of this opinion, it is situated in a blankish space, one of those chasmata which Lalande termed d’espaces vuides, wherein he could not perceive a star of the 9th magnitude in the achromatic telescope of sixty-seven millimetres aperture. By a modification of his very ingenious gauging process, Sir William considered the profundity of this cluster to be of the 344th order.

“Here are materials for thinking! What an immensity of space is indicated! Can such an arrangement be intended, as a bungling spouter of the hour insists, for a mere appendage to the speck of a world on which we dwell, to soften the darkness of its petty midnight? This is impeaching the intelligence of Infinite Wisdom and Power, in adapting such grand means to so disproportionate an end. No imagination can fill up the picture of which the visual organs afford the dim outline; and he who confidently probes the Eternal Design cannot be many removes from lunacy. It was such a consideration that made the inspired writer claim, “How unsearchable are His operations, and His ways past finding out!”

Throughout all historic observing notes, you’ll find notations like “remarkable” and even Dreyer’s famous exclamation points. Even though M30 may not be the easiest to find, nor the brightest of the Messier objects, it is still quite worthy of your time and attention!

The location of Messier 30, in the direction of the Scorpius constellation. Credit: IAU/Sky & Telescope magazine (Roger Sinnott & Rick Fienberg)

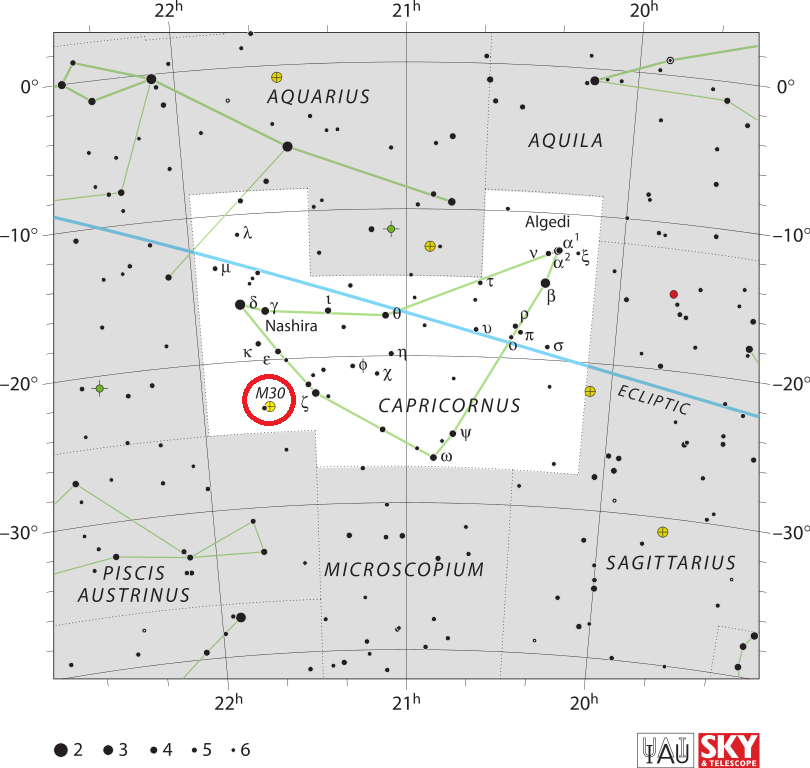
Locating Messier 30:

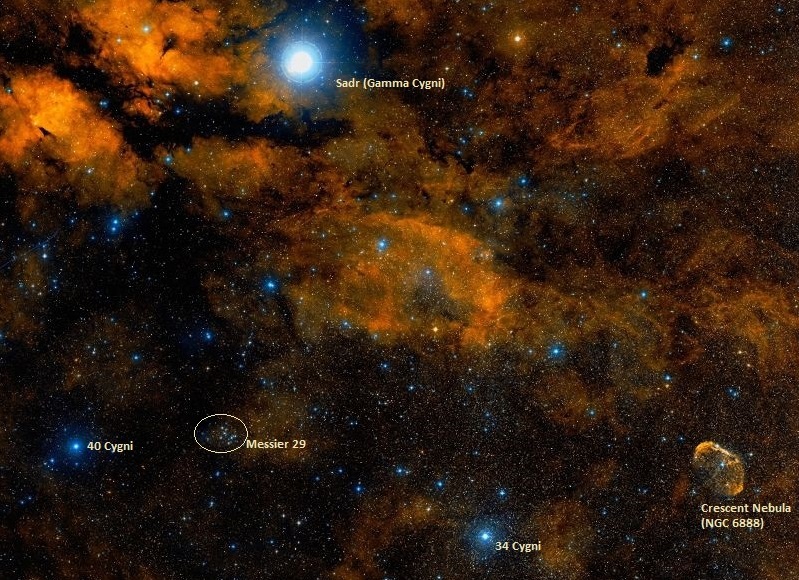
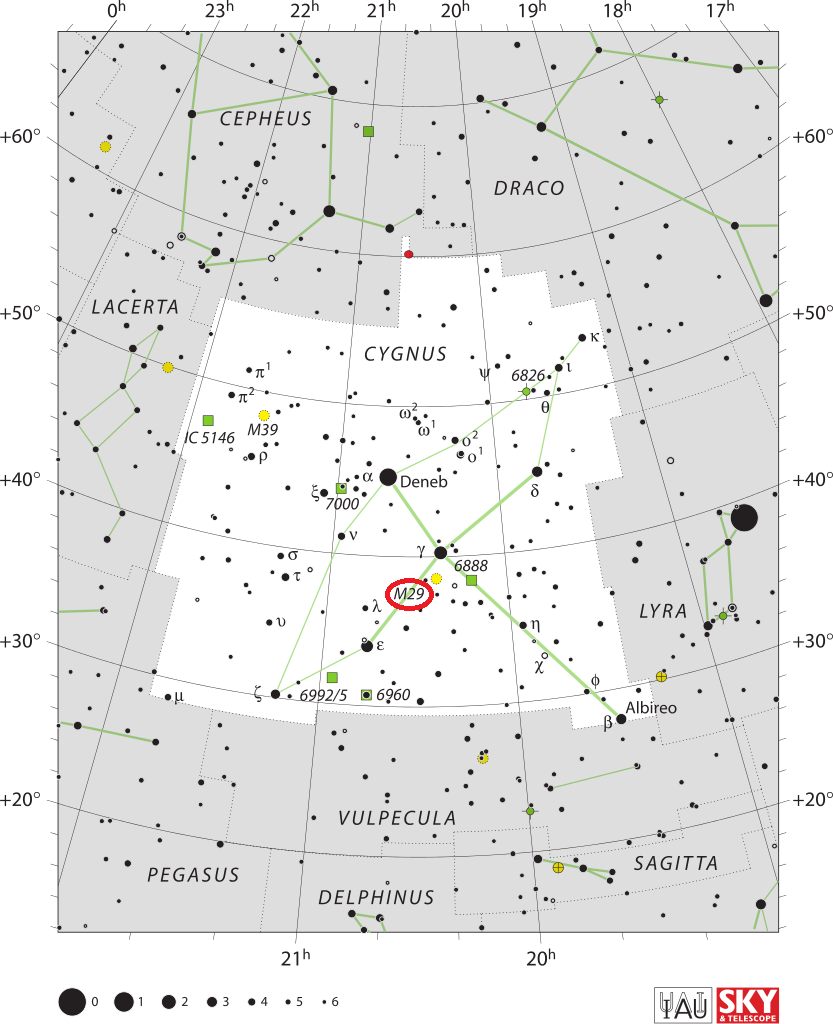
Finding M30 is not an easy task, unless you’re using a GoTo telescope. In any other case, it’s a starhop process, which must begin with identifying the the big grin-shape of the constellation of Capricornus. Once you’ve separated out this constellation, you’ll begin to notice that many of its primary asterism stars are paired – which is a good thing! The northeastern most pair are Gamma and Delta, which is where binocular-users should start.

As you move slowly south and slightly west, you’ll encounter your next wide pair – Chi and Epsilon. The next southwestern set is 36 Cap and Zeta. Now, from here you have two options! You can find Messier 30 a little more than a finger width east(ish) of Zeta (about half a binocular field)… or, you can return to Epsilon and look about one binocular field south (about 3 degrees) for star 41 which will appear just east of Messier 30 in the same field of view.

For the finderscope, star 41 is a critical giveaway to the globular cluster’s position! It won’t be visible to the unaided eye, but even a little magnification will reveal its presence. Using binoculars or a very small telescope, Messier 30 will appear as only a small, faded gray ball of light with a small star beside it. However, with telescope apertures as small as 4″ you’ll begin some resolution on this overlooked globular cluster and larger apertures will resolve it nicely.

And here are the quick facts on Messier 30 to help you get started:

Object Name: Messier 30
Alternative Designations: M30, NGC 7099
Object Type: Class V Globular Cluster
Constellation: Capricornus
Right Ascension: 21 : 40.4 (h:m)
Declination: -23 : 11 (deg:m
Distance: 26.1 (kly)
Visual Brightness: 7.2 (mag)
Apparent Dimension: 12.0 (arc min)

We have written many interesting articles about Messier Objects here at Universe Today. Here’s Tammy Plotner’s Introduction to the Messier Objects, , M1 – The Crab Nebula, M8 – The Lagoon Nebula, and David Dickison’s articles on the 2013 and 2014 Messier Marathons.

Be to sure to check out our complete Messier Catalog. And for more information, check out the SEDS Messier Database.

Sources:

How Do Wind Turbines Work?

In Denmark, wind power accounts for 28% of electrical production and is cheaper than coal power. Credit: denmark.dk

Perhaps you’ve seen them while driving through the countryside. Or maybe you saw them just off the coast, looming large on the horizon with their spinning blades. Then again, you may have seen them on someone’s roof, or as part of a small-scale urban operation. Regardless of the location, wind turbines and wind power are becoming an increasingly common feature in the modern world.

Much of this has to do with the threat of Climate Change, air pollution, and the desire to wean humanity off its dependence on fossil fuels. And when it comes to alternative and renewable energy, wind power is expected to occupy the second-largest share of the market in the future (after solar). But just how exactly do wind turbines work?

Description:

Air turbines are devices that turn the kinetic energy of wind and changes in air flow into electrical energy. In general, they consist of the following components: a rotor, a generator, and a structural support component (which can take the form of either a tower, a rotor yaw mechanism, or both).

NASA’s Ames Research Center and the U.S. Department of Energy’s National Renewable Energy Laboratory (NREL) testing a research wind turbine in the world’s largest wind tunnel in April of 2000. Credit: NASA

A rotor consists of the blades that capture the wind’s energy and a shaft, which converts the wind energy to low-speed rotational energy. The generator – which is connected to the shaft – converts the slow rotation to high into electrical energy using a series of magnets and a conductor (which usually consists of coiled copper wire).

When the magnets rotate around with the copper wire, its produces a difference in electrical potential, creating voltage and an electric current. Lastly, there is the structural support component, which ensures that the turbine either stands at a high enough altitudes to optimally capture changes in wind pressure, and/or face in the direction of wind flow.

Types of Wind Turbines:

At present, there are two main types of wind turbines – Horizontal Axis Wind Turbines (HAWT) and Vertical Axis Wind Turbines (VAWT). As the name would imply, horizontal wind turbines have a main rotor shaft and electrical generator at the top of a tower, with the blades pointed into the wind. The turbine is usually positioned upwind of its supporting tower, since the tower is likely to produce turbulence behind it.

Vertical axis turbines (once again, as the name implies) have the main rotor shaft arranged vertically. Typically, these are smaller in nature, and do not need to be pointed in the direction of the wind in order to rotate. They are thereby being able to take advantage of wind that is variable in terms of direction.

A Darrieus wind turbine, located in Martigny, Switzerland. Credit: Wikipedia Commons/Lysippos

In general, horizontal axis wind turbines are considered more efficient and can produce more power. While the vertical model generates less electricity it can be placed at lower elevations and needs less in the way of components (particularly a yaw mechanism). Wind turbines can also be divided into three general groups based on their design, which includes the Towered, Savonius, and Darrieus models.

The towered model is the most conventional form of HAWT, consisting of a tower (as the name would suggest) and a series of long blades that sit ahead of (and parallel to) the tower. The Savonis is a VAWT model that relies on contoured blades (scoops) to capture wind and spin. They are generally low-efficiency, but have the benefit of being self-starting. These sorts of turbines are often part of rooftop wind operations or mounted on sea vessels.

The Darrieus model, also known as an “Eggbeater” turbine, is named after the French inventor who pioneered the design – Georges Darrieus. This VAWT model employs a series of vertical blades that sit parallel to the vertical support. They are generally low efficiency, require an additional rotor to start turning, produce high-torque, and place high stress on the tower. Hence, they are considered unreliable as designs go.

History of Development:

Wind power has been used for thousands of years to push sails, power windmills, or to generate pressure for water pumps. The earliest known examples come from Central Asia, where windmills used in ancient Persia (Iran) have been dated to between 500 – 900 CE. The technology began to appear in Europe during the Middle Ages, and became a common feature by the 16th century.

The first automatically operated wind turbine, built in Cleveland in 1887 by Charles F. Brush. Credit: Wikipedia Commons

By the 19th century, with the development of electrical power, the first wind turbines capable of generating electricity were built. The first was installed in 1887 by Scottish academic James Blyth to light his holiday home in Marykirk, Scotland. In 1888, American inventor Charles F. Brush built the first automated wind turbine to power his home in Cleveland, Ohio.

By the early 20th century, wind turbines began to become a common means of powering homes in remote areas (such as farmsteads). In 1941, the first megawatt-class wind turbine was installed in Vermont and attached to the local utility grid. In 1951, the UK installed its first utility-grid connected wind turbine in the Orkney Islands.

By the 1970s, research and development into wind turbine technology advanced considerably thanks to the OPEC crisis and protests against nuclear power. In the ensuing decades, associations and lobbyists dedicated to alternative energy began to emerge in western European nations and the United States. By the final decade of the 20th century, similar efforts emerged in India and China due to growing air pollution and rising demand for clean energy.

Wind Power:

Compared to other forms of renewable energy, wind power is considered very reliable and steady, as wind is consistent from year to year and does not diminish during peak hours of demand. Initially, the construction of wind farms was a costly venture. But thanks to recent improvements, wind power has begun to set peak prices in wholesale energy markets worldwide and cut into the revenues and profits of the fossil fuel industry.

Cross-section of a vertical wind turbine. Credit: energy.gov

According to a report issued by the Department of Energy in March of 2015, the growth of wind power in the United States could lead to even more highly skilled jobs in many categories. Titled “Wind Vision: A New Era for Wind Power in the United States”, the document indicates that by 2050, the industry could account for as much as 35% of the US’ electrical production.

In addition, in 2014, the Global Wind Energy Council and Greenpeace International came together to publish a report titled “Global Wind Energy Outlook 2014”. This report stated that worldwide, wind power could provide as much as 25 to 30% of global electricity by 2050. At the time of the report’s writing, commercial installations in more than 90 countries had a total capacity of 318 gigawatts (GW), providing about 3.1% of global supply.

This represents a nearly sixteen-fold increase in the rate of adoption since the year 2000, when wind power accounted for less than 0.2%. Another way to look at it would be to say that the market share of wind power has doubled four times in less than 15 years. This places it second only to solar power, which doubled seven times over in the same period, but still trails wind in terms of its overall market share (at about 1% by 2014).

An offshore wind farm located off the coast of Belgium. Credit: Wikipedia Commons/Hans Hillewaert

In terms of its disadvantages, one consistently raised issue is the effect wind turbines have on local wildlife, and the disturbance their presence has on the local landscape. However, these concerns have often been shown to be inflated by special interest groups and lobbyists seeking to discredit wind power and other renewable energy sources.

For instance, a 2009 study released by the National Renewable Energy Laboratory determined that less than 1 acre per megawatt is disturbed permanently by the construction of large-scale wind farms, and less than 3.5 acres per megawatt are disturbed temporarily. The same study concluded that the impacts are relatively low on bird and bat wildlife, and that the same conclusions hold true for offshore platforms.

All over the world, governments and local communities are looking to wind power in order to meet their energy needs. In an age of rising fuel prices, growing concerns over Climate Change, and improving technology, this is hardly surprising. At its current rate of adoption, it is likely to be one of the largest sources of energy by mid-century.

And be sure to enjoy this video about wind turbines, courtesy of NASA’s Lewis Research Center:

We have written many interesting articles on wind turbines and wind power here at Universe Today. Here’s What is Alternative Energy?, What are Fossil Fuels?, What are the Different Types of Renewable Energy?, Wind Power on the Ocean (with Help from Space), and Could the World Run on Solar and Wind Power?

For more information, check out How Stuff Works’s article about the history and mechanics of wind power and NASA’s Greenspace page.

Astronomy Cast also has some episodes that are relevant to the subject. Here’s Episode 51: Earth and Episode 308: Climate Change.

Sources:

What Are Fossil Fuels?

Fossil fuels, like coal, still account for the majority of energy production worldwide. Credit: energy.gov

The term “fossil fuels” is thrown about quite a lot these days. More often than not, it comes up in the context of environmental issues, Climate Change, or the so-called “energy crisis”. In addition to be a major source of pollution, humanity’s dependence on fossil fuels has led to a fair bit of anxiety in recent decades, and fueled demands for alternatives.

But just what are fossil fuels? While most people tend to think of gasoline and oil when they hear these words, it actually applies to many different kinds of energy sources that are derived from decomposed organic material. How humanity came to be so dependent on them, and what can we look to in order to replace them, are some of the biggest concerns facing us today.

Definition:

Fossil fuels refers to energy sources that are formed as a result of the anaerobic decomposition of living matter that contains energy as a result of ancient photosynthesis. Typically, these organisms have been dead for millions of years, with some dating back as far as the Cryogenian Period (ca. 650 million years ago).

The Bryan Mound Strategic Petroleum Reserve, located in Brazoria Country, Texas. Credit: energy.gov

Fossil fuels contain high percentages of carbon and stored energy in their chemical bonds. They can take the form of petroleum, coal, natural gas, and other combustible, hydrocarbon compounds. Whereas petroleum and natural gas are formed by the decomposition of organisms, coal and methane are the results of the decomposition of terrestrial plants.

In the case of the former, it is believed that large quantities of phytoplankton and zooplankton settled on the bottoms of seas or lakes millions of years ago. Over the course of many millions of years, this organic matter mixed with mud and was buried under heavy layers of sediment. The resulting heat and pressure caused the organic matter to become chemically altered, eventually forming carbon compounds.

In the case of the latter, the source was dead plant matter that was covered in sediment during the Carboniferous period – i.e. the end of Devonian Period to the beginning of the Permian Period (ca. 300 and 350 million years ago). Over time, these deposits either solidified or became gaseous, creating coal fields, methane and natural gases.

Modern Uses:

Coal has been used since ancient times as a fuel, often in furnaces to melt metal ores. Unprocessed and unrefined oil has also been burned for centuries in lamps for the sake of lighting, and semi-solid hydrocarbons (like tar) were used for waterproofing (largely on the bottoms of boats and on docks) and for embalming.

Widespread use of fossil fuels as sources of energy began during the Industrial Revolution (18th – 19th century), where coal and oil began replacing animal sources (i.e. whale oil) to power steam engines. By the time of the Second Industrial Revolution (ca. 1870 – 1914), oil and coal began to be used to power electrical generators.

The invention of the internal combustion engine (i.e. automobiles) increased demands for oil exponentially, as did the development of aircraft. The petrochemical industry emerged concurrently, with petroleum being used to manufacture products ranging from plastics to feedstock. In addition, tar (a leftover product from petroleum extraction) became widely used in the construction of roads and highways.

Fossil fuels became central to modern manufacturing, industry and transportation because of how they produce significant amounts of energy per unit mass. As of 2015, according to the International Energy Agency (IEA) the world’s energy needs are still predominantly provided for by sources like coal (41.3%) and natural gas (21.7%), though oil has dropped to just 4.4%.

The fossil fuel industry also accounts for a major share of the global economy. In 2014, global coal consumption exceeded 3.8 billion metric tons, and accounted for US $46 billion in revenue in the US alone. In 2012, global oil and gas production reached over 75 million barrels per day, while the global revenue generated by the industry reached about US $1.247 trillion.

Countries of the world ranked in terms of their annual production of oil. Credit: Wikipedia Commons/Ali Zifan

The fossil fuel industry also enjoys a great deal of government protection and incentives worldwide. A 2014 report from the IEA indicated that the fossil fuel industry collects $550 billion a year in global government subsidies. However, a 2015 study by the International Monetary Fund (IMF) indicated that the real cost of these subsidies to governments worldwide is around US $5.3 trillion (or 6.5 % of global GDP).

Environmental Effects:

The connection between fossil fuels and air pollution in industrialized nations and major cities has been evident since the Industrial Revolution. Pollutants generated by the burning of coal and oil include carbon dioxide, carbon monoxide, nitrogen oxides, sulfur dioxide, volatile organic compounds and heavy metals, all of which have been linked to respiratory illnesses and increased risks of disease.

The burning of fossil fuels by humans is also the largest source of emissions of carbon dioxide (about 90%) worldwide, which is one of the main greenhouse gases that allows radiative forcing (aka. the Greenhouse Effect) to take place, and contributes to global warming.

In 2013, the National Oceanic and Atmospheric Administration announced that CO² levels in the upper atmosphere reached 400 parts per million (ppm) for the first time since measurements began in the 19th century. Based on the current rate at which emissions are growing, NASA estimates that carbon levels could reach between 550 to 800 ppm in the coming century.

If the former scenario is the case, NASA anticipates a rise of 2.5 °C (4.5 °F) in average global temperatures, which would be sustainable. However, should the latter scenario prove to be the case, global temperatures will rise by an average of 4.5 °C (8 °F), which would make life untenable for many parts of the planet. For this reason, alternatives are being sought out for development and widespread commercial adoption.

Alternatives:

Due to the long-term effects of fossil fuel-use, scientists and researchers have been developing alternatives for over a century. These include concepts like hydroelectric power – which has existed since the late 19th century – where falling water is used to spin turbines and generate electricity.

Since the latter half of the 20th century, nuclear power has also been looked to as an alternative to coal and petroleum. Here, slow-fission reactors (which rely on uranium or the radioactive decay of other heavy elements)  are used to heat water, which in turn generates steam to spin turbines.

Since the mid-2oth century, several more methods have been proposed that range from the simple to the highly sophisticated. These include wind power, where changes in airflow pushes turbines; solar power, where photovoltaic cells convert the Sun’s energy (and sometimes heat) into electricity; geothermal power, which relies on steam tapped from the Earth’s crust to rotate turbines; and tidal power, where changes in the tides push turbines.

The spherical tokamak MAST at the Culham Centre for Fusion Energy (UK). Photo: CCFE

Alternative fuels are also being derived from biological sources, where plant and biological sources are used to replace gasoline. Hydrogen is also being developed as a power source, ranging from hydrogen fuel cells to water being used to powering internal combustion and electric engines. Fusion power is also being developed, where atoms of hydrogen are fused inside reactors to generate clean, abundant energy.

By the middle of the 21st century, fossil fuels are expected to have become obsolete, or at least declined significantly in terms of their use. But from a historical standpoint, they have been associated with the largest and most prolonged explosions in human growth. Whether humanity will survive the long-term effects of this growth – which has included an intense amount of fossil fuel burning and greenhouse gas emissions – remains to be seen.

We have written many articles about fossil fuels for Universe Today. Here’s What is an Enhanced Greenhouse Effect?, Gases in the Atmosphere, What Causes Air Pollution?, What if We Burn Everything?, What is Alternative Energy?, and “Climate Change is Now More Certain Than Ever,” New Report Says

If you’d like more info on Fossil Fuels, check out NASA’s Earth Observatory. And here’s a link to NASA’s Article on Safeguarding our Atmosphere.

Astronomy Cast also has some episodes that are relevant to the subject. Here’s Episode 51: Earth and Episode 308: Climate Change.

Sources:

What is Alternative Energy?

Artist's concept of a space-based solar array. Credit NASA/SAIC

In recent years, alternative energy has been the subject of intense interest and debate. Thanks to the threat of Climate Change, and the fact that average global temperatures continue to rise year after year, the drive to find forms of energy that will reduce humanity’s reliance on fossil fuels, coal, and other polluting methods has naturally intensified.

While most concepts for alternative energy are not new, it has only been in the past few decades that the issue has become pressing. And thanks to improvements in technology and production, the costs of most forms of alternative energy has been dropping while efficiency has been increasing. But just what is alternative energy, and what is the likelihood of it becoming mainstream?

Definition:

Naturally, there is some debate as to what “alternative energy” means and what it can be applied to. On the one hand, the term can refer to forms of energy that do not increase humanity’s carbon footprint. In this respect, it can include things as nuclear facilities, hydroelectric power, and even things like natural gas and “clean coal”.

Residential solar panels in Germany. Credit: Wikimedia Commons/ Sideka Solartechnik.
Residential solar panels in Germany. Credit: Wikimedia Commons/ Sideka Solartechnik

On the other hand, the term is also used to refer to what are currently considered to be non-traditional methods of energy – such as solar, wind, geothermal, biomass, and other recent additions. This sort of classification rules out methods like hydroelectric, which have been around for over a century and are therefore quite common to certain regions of the world.

Another factor is that alternative energy sources are considered to be “clean”, meaning that they don’t produce harmful pollutants. As already noted, this can refer to carbon dioxide but also other emissions like carbon monoxide, sulfur dioxide, nitrogen oxide, and others. Within these parameters, nuclear energy is not considered an alternative energy source because it produces radioactive waste that is highly toxic and must be stored.

In all cases, however, the term is used to refer to forms of energy that will come to replace fossil fuels and coal as the predominant form of energy production in the coming decades.

Types of Alternative Energy:

Strictly speaking, there are many types of alternative energy. Once again, definitions become a bit of a sticking point, and the term has been used in the past to refer to any method that was considered non-mainstream at the time. But applying the term broadly to mean alternatives to coal and fossil fuels, it can include any or all of the following:

Hydroelectricity: This refers to energy generated by hydroelectric dams, where falling water (i.e. rivers or canals) are channeled through an apparatus to spin turbines and generate electricity.

A nuclear power plant, releasing hot steam as a byproduct of its slow fission process. Credit: Wikipedia Commons/Emmelie Callewaert

Nuclear Power: Energy that is produced through slow-fission reactions. Rods of uranium or other radioactive elements heat water to generate steam, which in turn spins turbines to generate electricity.

Solar Power: Energy harnessed directly from the Sun, where photovoltaic cells (usually composed of silicon substrate, and arranged in large arrays) convert the Sun’s rays directly into electrical energy. In some cases, the heat produced by sunshine is harnessed to produce electricity as well, which is known as solar-thermal power.

Wind Power: Energy generated by air flow, where large wind-turbines are spun by wind to generate electricity.

Geothermal Power: Energy generated by heat and steam produced by geological activity in the Earth’s crust. In most cases, this consists of pipes being placed in the ground above geologically active zones to channel steam through turbines, thus generating electricity.

Tidal Power: Energy generated by tidal harnesses located around shorelines. Here, the daily changes in tides causes water to flow back and forth through turbines, generating electricity that is then transferred to power stations along the shore.

Biomass: This refers to fuels that are derived from plants and biological sources – i.e. ethanol, glucose, algae, fungi, bacteria – that could replace gasoline as a fuel source.

Hydrogen: Energy derived from processes involving hydrogen gas. This can include catalytic converters, where water molecules are broken apart and reunited by electrolysis; hydrogen fuel cells, where the gas is used to power internal combustion engines or heated and used to spin turbines; or nuclear fusion, where atoms of hydrogen fuse under controlled conditions to release incredible amounts of energy.

The Mega Ampere Spherical Tokamak (MAST) reactor at the Culham Centre for Fusion Energy (UK). Credit: CCFE

Alternative and Renewable Energy:

In many cases, alternative sources of energy are also renewable. However, the terms are not entirely interchangeable, owing to the fact that many forms of alternative energy rely on a finite resource. For instance, nuclear power relies on uranium or other heavy elements that must be mined.

Meanwhile, wind, solar, tidal, geothermal and hydroelectric power all rely on sources that are entirely renewable. The Sun’s rays are the most abundant energy source of all and, while limited by weather and diurnal patters, are perennial – and therefore inexhaustible from an industry standpoint. Wind is also a constant, thanks to the Earth’s rotation and pressure changes in our atmosphere.

Development:

Currently, alternative energy is still very much in its infancy. However, this picture is rapidly changing, owing to a combination of political pressure, worldwide ecological disasters (drought, famine, flooding, storm activity), and improvements in renewable energy technology.

For instance, as of 2015, the world’s energy needs were still predominantly provided for by sources like coal (41.3%) and natural gas (21.7%). Hydroelectric and nuclear power constituted 16.3% and 10.6%, respectively, while “renewables” (i.e. solar, wind, biomass etc.) made up just 5.7%.

In Denmark, wind power accounts for 28% of electrical production and is cheaper than coal power. Credit: denmark.dk

This represented a significant change from 2013, when the global consumption of oil, coal and natural gas was 31.1%, 28.9%, and 21.4%, respectively.  Nuclear and hydroelectric power made up 4.8% and 2.45, while renewable sources made up just 1.2%.

In addition, there has been an increase in the number of international agreements regarding the curbing of fossil fuel use and the development of alternative energy sources. These include the Renewable Energy Directive signed by the European Union in 2009, which established goals for renewable energy usage for all member states for the year of 2020.

Basically, the agreement stated that the EU fulfill at least 20% of its total energy needs with renewables by 2020, and that at least 10% of their transport fuels come from renewable sources by 2020. In November of 2016, the European Commission revised these targets, establishing that a minimum of 27% of the EUs energy needs come from renewables by 2030.

In 2015, the United Nations Framework Convention on Climate Change (UNFCCC) met in Paris to come up with a framework for greenhouse gas mitigation and the financing of alternative energy that would go into effect by 2020. This led to The Paris Agreement, which was adopted on December 12th, 2015 and opened for signatures on April 22nd (Earth Day), 2016, at the UN Headquarters in New York.

The Krafla a geothermal power station located i0n Iceland. Credit: Wikipedia Commons/Ásgeir Eggertsson

Several countries and states have also been noted fore their leadership in the field of alternative energy development. For instance, in Denmark, wind power provides up to 140% of the country’s demand for electricity, with the surplus being provided to neighboring countries like Germany and Sweden.

Iceland, thanks to its location in the North Atlantic and its active volcanoes, achieved 100% reliance on renewable energy by 2012 through a combination of hydroelectricity and geothermal power. In 2016, Germany’s policy of phasing out reliance on oil and nuclear power resulted in the country reaching a milestone on May 15th, 2016 – where nearly 100% of its demand for electricity came from renewable sources.

The state of California has also made impressive strides in terms of its reliance on renewable energy in recent years. In 2009, 11.6 percent of all electricity in the state came from renewable resources such as wind, solar, geothermal, biomass and small hydroelectric facilities. Thanks to multiple programs that encourage switching to renewable energy sources, this reliance increased to 25% by 2015.

Based on the current rates of adoption, the long-term prospects for alternative energy are extremely positive. According to a 2014 report by the International Energy Agency (IEA), photovoltaic solar power and solar thermal power will account for 27% of global demand by 2050 – making it the single largest source of energy. Similarly, a 2013 report on wind power indicated that by 2050, wind could account for up to 18% of global demand.

The IEA’s World Energy Outlook 2016 also claims that by 2040, natural gas, wind and solar will eclipse coal and oil as the predominant sources of energy. And some even go as far to say that – thanks to developments in solar, wind, and fusion power technology – fossil fuels will become obsolete by 2050.

As with all things, the adoption of alternative energy has been gradual. But thank to the growing problem of Climate Change and rising demand for electricity worldwide, the rate at which clean and alternative methods are being adopted has become exponential in recent years. Sometime during this century, humanity may reach the point of becoming carbon neutral, and not a moment too soon!

We have written many articles about alternative energy for Universe Today. Here’s What are the Different Types of Renewable Energy?, What is Solar Energy?, How Does a Wind Turbine Work?, Could the World Run on Solar and Wind Power?, Where does Geothermal Power Come From? and Compromises Lead to Climate Change Deal.

If you’d like more info on Alternative Energy, check out the Alternative Energy Crops in Space. And here’s a link to Alternative Energy Technologies to Control Climate Change.

We’ve also recorded an episode of Astronomy Cast all about planet Earth. Listen here, Episode 51: Earth.

Sources:

Messier 29 – The NGC 6913 Open Star Cluster

The Messier 29 open star cluster. Credit: Wikisky

Welcome back to Messier Monday! In our ongoing tribute to the great Tammy Plotner, we take a look at the open star cluster known as Messier 29. Enjoy!

During the 18th century, famed French astronomer Charles Messier noted the presence of several “nebulous objects” in the night sky. Having originally mistaken them for comets, he began compiling a list of them so that others would not make the same mistake he did. In time, this list would come to include 100 of the most fabulous objects in the night sky.

One of these objects is Messier 29, an open star cluster located in the northern skies in the direction of the Cygnus constellation. Situated in a highly crowded area of the Milky Way Galaxy, about 4,000 light-years from Earth, this star cluster is slowly moving towards us. Though somewhat isolated in the night sky, it can be easily spotted using binoculars and small telescopes.

Description:

While Messier Object 29 might appear a little bit boring compared to some of its more splashy catalog companions, it really isn’t. This little group of stars is part of the Cygnus OB1 association which just happens to be heading towards us at a speed of 28 kilometers per second (17.4 mps) . If it weren’t obscured by Milky Way dust, the light of its stars would be 1000 times brighter!

Messier 29 and Gamma Cygni (Sadr). Credit: Wikisky

All in all, M29 has around 50 member stars, but this 10 million year old star cluster still has some surprises. The five brightest stars you see are are all giant stars of spectral class B0, and if we were to put one next to our own Sol, it would shine 160,000 times brighter. Image just how “lit up” any planet might be that would reside inside that 11 light year expanse!

Astronomers were curious about Messier 29, too, so they went in search of binary stars. As C. Boeche (et al) wrote in a 2003 study:

“Between 1996 and 2003 we obtained 226 high resolution spectra of 16 stars in the field of the young open cluster NGC 6913, to constrain its main properties and study its internal kinematics. Twelve of the program stars turned out to be members, one of them probably unbound. Nine are binaries (one eclipsing and another double lined) and for seven of them the observations allowed us to derive the orbital elements. All but two of the nine discovered binaries are cluster members. In spite of the young age (a few Myr), the cluster already shows signs that could be interpreted as evidence of dynamical relaxatin and mass segregation.

“However, they may be also the result of an unconventional formation scenario. The dynamical (virial) mass as estimated from the radial velocity dispersion is larger than the cluster luminous mass, which may be explained by a combination of the optically thick interstellar cloud that occults part of the cluster, the unbound state or undetected very wide binary orbit of some of the members that inflate the velocity dispersion and a high inclination for the axis of possible cluster angular momentum. All the discovered binaries are hard enough to survive average close encounters within the cluster and do not yet show signs of relaxation of the orbital elements to values typical of field binaries.”

So why is finding binary stars important? Evolution is the solution, the hunt for Be stars. As S.L. Malchenko of the Crimean Astrophysical Observatory wrote in a 2008 study on Be stars:

“The phenomenon of Be stars has been known for over a century. The fact that at least 20% of B stars have an emission spectrum supports that the definition that this phenomenon is not special but it is rather typical from a large group of objects at a certain stage of evolution. The vagueness of the concept of the Be phenomenon suggests that this definition encompasses a broad group of objects near the main sequence that includes binary systems with different rate of mass exchange. This young open cluster in the Cyg OB1 association, is also know as M29, contains a large number of luminous stars with spectral types around B0. An extreme variation of extinction is found across the young open cluster NGC 6913, extinction in the cluster center is relatively homogeneous, but very large. We observed 10 spectra for 7 B stars and one known Be star in the blue region.”

Close-up of the core region of Messier 29. Credit: Adam Block/Mount Lemmon SkyCenter/University of Arizona

Although you won’t be able to detect it visually, there is also some nebulosity associated with M29, which is another important clue to this star cluster’s evolution. As B. Bhavya of Cochin University of Science and Technology wrote in a 2008 study:

“The Cygnus region is a region of recent star formation activity in the Milky Way and is rich in massive early type stars concentrated in OB associations. The presence of nebulosity and massive stars indicate that the stars have been forming till very recently and the young clusters found here are the result of the recent star formation event. Though the above fact is known, what is not known is that when this star formation process started and how it proceeded in the region. Though one assumes that all the stars in a cluster have the same age, this assumption is not valid when the candidate cluster is very young. In the case of young clusters, there is a chance for a spread in the age of the stars, depending on the duration of star formation. An estimation of this formation time-scale in the clusters formed in a star forming complex, will indicate the duration of star formation and its direction of propagation within the complex. In principle, duration of star formation is defined as the difference between the ages of the oldest and the youngest star formed in the cluster. In practice, the age of the oldest star is assumed as the age of that star which is about to turn-off from the main-sequence (MS) (turn-off age) and the age of the youngest star is the age of the youngest pre-MS star (turn-on age). The turn-off age of many clusters are known, but the turn-on age is not known for most of the clusters.”

History of Observation:

This cool little star cluster was an original discovery of Charles Messier, who first observed it in 1764. As he wrote of the object in his notes at the time:

“In the night of July 29 to 30, 1764, I have discovered a cluster of six or seven very small stars which are below Gamma Cygni, and which one sees with an ordinary refractor of 3 feet and a half in the form of a nebula. I have compared this cluster with the star Gamma, and I have determined its position in right ascension as 303d 54′ 29″, and its declination of 37d 11′ 57″ north.”

Gammy Cygni (the brightest object in the center) and neighboring regions. Credit: Wikipedia Commons/Erik Larsen

In the case of this cluster, it was independently recovered again by Caroline Herschel, who wrote: “About 1 deg under Gamma Cygni; in my telescope 5 small stars thus. My Brother looked at them with the 7 ft and counted 12. It is not in Mess. catalogue.”

William would also return to the cluster as well with his own observations: “Is not sufficiently marked in the heavens to deserve notice, as 7 or 8 small stars together are so frequent about this part of the heavens that one might find them by hundreds.”

So why the confusion? In this circumstance, perhaps Messier was a bit distracted, for it would appear that his logged coordinates were somewhat amiss. Leave it to Admiral Symth to set the records straight:

“A neat but small cluster of stars at the root of the Swan’s neck, and in the preceding branch of the Milky Way, not quite 2deg south of Gamma; and preceding 40 Cygni, a star of the 6th magnitude, by one degree just on the parallel. In the sp [south preceding, SW] portion are the two stars here estimated as double, of which A is 8, yellow; B 11, dusky. Messier discovered this in 1764; and though his description of it is very fair, his declination is very much out: worked up for my epoch it would be north 37d 26′ 15″. But one is only surprised that, with his confined methods and means, so much was accomplished.”

Kudos to Mr. Messier for being able to distinguish a truly related group of stars in a field of so many! Take the time to enjoy this neat little grouping for yourself and remember – it’s heading our way.

Locating Messier 29:

Finding M29 in binoculars or a telescope is quite easy once you recognize the constellation of Cygnus. Its cross-shape is very distinctive and the marker star you will need to locate this open star cluster is Gamma – bright and centermost. For most average binoculars, you will only need to aim at Gamma and you will see Messier 29 as a tiny grouping of stars that resembles a small box.

Messier 29 location. Image: IAU and Sky & Telescope magazine (Roger Sinnott & Rick Fienberg)
The location of Messier 29, in the direction of the Cygus constellation. Credit: IAU and Sky & Telescope magazine (Roger Sinnott & Rick Fienberg)

For a telescope, begin with your finderscope on Gamma, and look for your next starhop marker star about a finger width southwest. Once this star is near the center of your finderscope field, M29 will also be in a low magnification eyepiece field of view. Because it is a very widely spaced galactic open star cluster that only consists of a few stars, it makes an outstanding object that stands up to any type of sky conditions.

Except, of course, clouds! Messier 29 can easily be seen in light polluted areas and during a full Moon – making it a prize object for study for even the smallest of telescopes.

As always, here are the quick facts to help you get started:

Object Name: Messier 29
Alternative Designations: M29, NGC 6913
Object Type: Open Galactic Star Cluster
Constellation: Cygnus
Right Ascension: 20 : 23.9 (h:m)
Declination: +38 : 32 (deg:m)
Distance: 4.0 (kly)
Visual Brightness: 7.1 (mag)
Apparent Dimension: 7.0 (arc min)

We have written many interesting articles about Messier Objects here at Universe Today. Here’s Tammy Plotner’s Introduction to the Messier Objects, , M1 – The Crab Nebula, M8 – The Lagoon Nebula, and David Dickison’s articles on the 2013 and 2014 Messier Marathons.

Be to sure to check out our complete Messier Catalog. And for more information, check out the SEDS Messier Database.

Sources:

The Canis Minor Constellation

View of the night sky in North Carolina, showing the constellations of Orion, Hyades, Canis Major and Canis Minor. Credit: NASA

Welcome back to Constellation Friday! Today, in honor of the late and great Tammy Plotner, we will be dealing with the “little dog” – the Canis Minor constellation!

In the 2nd century CE, Greek-Egyptian astronomer Claudius Ptolemaeus (aka. Ptolemy) compiled a list of all the then-known 48 constellations. This treatise, known as the Almagest, would be used by medieval European and Islamic scholars for over a thousand years to come, effectively becoming astrological and astronomical canon until the early Modern Age.

One of these constellations was Canis Minor, a small constellation in the northern hemisphere. As a relatively dim collection of stars, it contains only two particularly bright stars and only faint Deep Sky Objects. Today, it is one of the 88 constellations recognized by the International Astronomical Union, and is bordered by the Monoceros, Gemini, Cancer and Hydra constellation.

Name and Meaning:

Like most asterisms named by the Greeks and Romans, the first recorded mention of this constellation goes back to ancient Mesopotamia. Specifically, Canis Minor’s brightest stars – Procyon and Gomeisa – were mentioned in the Three Stars Each tablets (ca. 1100 BCE), where they were referred to as MASH.TAB.BA (or “twins”).

The Winter Hexagon, which contains parts of the Auriga, Canis Major, Canis Minor, Gemini, Monoceros, Orion, Taurus, Lepus and Eridanus constellations. Credit: constellation-guide.com

In the later texts that belong to the MUL.APIN, the constellation was given the name DAR.LUGAL (“the star which stands behind it”) and represented a rooster. According to ancient Greco-Roman mythology, Canis Minor represented the smaller of Orion’s two hunting dogs, though they did not recognize it as its own constellation.

In Greek mythology, Canis Minor is also connected with the Teumessian Fox, a beast turned into stone with its hunter (Laelaps) by Zeus. He then placed them in heaven as Canis Major (Laelaps) and Canis Minor (Teumessian Fox). According to English astronomer and biographer of constellation history Ian Ridpath:

“Canis Minor is usually identified as one of the dogs of Orion. But in a famous legend from Attica (the area around Athens), recounted by the mythographer Hyginus, the constellation represents Maera, dog of Icarius, the man whom the god Dionysus first taught to make wine. When Icarius gave his wine to some shepherds for tasting, they rapidly became drunk. Suspecting that Icarius had poisoned them, they killed him. Maera the dog ran howling to Icarius’s daughter Erigone, caught hold of her dress with his teeth and led her to her father’s body. Both Erigone and the dog took their own lives where Icarius lay.

“Zeus placed their images among the stars as a reminder of the unfortunate affair. To atone for their tragic mistake, the people of Athens instituted a yearly celebration in honour of Icarius and Erigone. In this story, Icarius is identified with the constellation Boötes, Erigone is Virgo and Maera is Canis Minor.”

Canis Minor, as depicted by Johann Bode in his 1801 work Uranographia. Credit: Wikipedia Commons/Alessio Govi

To the ancient Egyptians, this constellation represented Anubis, the jackal god. To the ancient Aztecs, the stars of Canis Minor were incorporated along with stars from Orion and Gemini into as asterism known as “Water”, which was associated with the day. Procyon was also significant in the cultural traditions of the Polynesians, the Maori people of New Zealand, and the Aborigines of Australia.

In Chinese astronomy, the stars corresponding to Canis Minor were part of the The Vermilion Bird of the South. Along with stars from Cancer and Gemini, they formed the asterisms known as the Northern and Southern River, as well as the asterism Shuiwei (“water level”), which represented an official who managed floodwaters or a marker of the water level.

History of Observation:

Canis Minor was one of the original 48 constellations included by Ptolemy in his the Almagest. Though not recognized as its own asterism by the Ancient Greeks, it was added by the Romans as the smaller of Orion’s hunting dogs. Thanks to Ptolemy’s inclusion of it in his 2nd century treatise, it would go on to become part of astrological and astronomical traditions for a thousand years to come.

For medieval Arabic astronomers, Canis Minor continued to be depicted as a dog, and was known as “al-Kalb al-Asghar“. It was included in the Book of Fixed Stars by Abd al-Rahman al-Sufi, who assigned a canine figure to his stellar diagram. Procyon and Gomeisa were also named for their proximity to Sirius; Procyon being named the “Syrian Sirius (“ash-Shi’ra ash-Shamiya“) and Gomeisa the “Sirius with bleary eyes” (“ash-Shira al-Ghamisa“).

Monoceros and the obsolete constellation Atelier Typographique. Credit: Library of Congress
The constellation Canis Minor, shown alongside Monoceros and the obsolete constellation Atelier Typographique. Credit: Library of Congress

The constellation was included in Syndey Hall’s Urania’s Mirror (1825) alongside Monoceros and the now obsolete constellation Atelier Typographique. Many alternate names were suggested between the 17th and 19th centuries in an attempt to simplify celestial charts. However, Canis Minor has endured; and in 1922, it became one the 88 modern constellations to be recognized by the IAU.

Notable Features:

Canis Minor contains two primary stars and 14 Bayer/Flamsteed designated stars. It’s brightest star, Procyon (Alpha Canis Minoris), is also the seventh brightest star in the sky. With an apparent visual magnitude of 0.34, Procyon is not extraordinarily bright in itself. But it’s proximity to the Sun – 11.41 light years from Earth – ensures that it appears bright in the night sky.

The star’s name is derived from the Greek word which means “before the dog”, a reference to the fact that it appears to rise before Sirius (the “Dog Star”) when observed from northern latitudes. Procyon is a binary star system, composed of a white main sequence star (Procyon A) and Procyon B, a DA-type faint white dwarf as the companion.

Procyon is part of the Winter Triangle asterism, along with Sirius in Canis Major and Betelgeuse in the constellation Orion. It is also part of the Winter Hexagon, along with the stars Capella in Auriga, Aldebaran in Taurus, Castor and Pollux in Gemini, Rigel in Orion and Sirius in Canis Major.

The stars of the Winter Triangle and the Winter Hexagon. Credit: constellation-guide.com

Next up is Gomeisa, the second brightest star in Canis Minor. This hot, B8-type main sequence star is classified as a Gamma Cassiopeiae variable, which means that it rotates rapidly and exhibits irregular variations in luminosity because of the outflow of matter. Gomeisa is approximately 170 light years from Earth and the name is derived from the Arabic “al-ghumaisa” (the bleary-eyed woman”).

Canis Minor also has a number of Deep Sky Objects located within it, but all are very faint and difficult to observe. The brightest is the spiral galaxy NGC 2485 (apparent magnitude of 12.4), which is located 3.5 degrees northeast of Procyon. There is one meteor shower associated with this constellation, which are the Canis-Minorids.

Finding Canis Minor:

Though it is relatively faint, Canis Minor and its stars can be viewed using binoculars. Start with the brightest, Procyon – aka. Alpha Canis Minoris (Alpha CMi). If you’re unsure of which bright star is, you’ll find it in the center of the diamond shape grouping in the southwest area. Known to the ancients as Procyon – “The Little Dog Star” – it’s the seventh brightest star in the night sky and the 13th nearest to our solar system.

For over 100 years, astronomers have known this brilliant star had a companion. Being 15,000 times fainter than the parent star, Procyon B is an example of a white dwarf whose diameter is only about twice that of Earth. But its density exceeds two tons per cubic inch! (Or, a third of a metric ton per cubic centimeter). While only very large telescopes can resolve this second closest of the white dwarf stars, even the moonlight can’t dim its beauty.

The Winter Triangle. Credit: constellation-guide.com/Stellarium software

Now hop over to Beta CMi. Known by the very strange name of Gomeisa (“bleary-eyed woman”), it refers to the weeping sister left behind when Sirius and Canopus ran to the south to save their lives. Located about 170 light years away from our Solar System, Beta is a blue-white class B main sequence dwarf star with around 3 times the mass of our Sun and a stellar luminosity over 250 times that of Sol.

Gomeisa is a fast rotator, spinning at its equator with a speed of at least 250 kilometers per second (125 times our  Sun’s rotation speed) giving the star a rotation period of about a day. Sunspots would appear to move very quickly there! According to Jim Kaler, Professor Emeritus of Astronomy at the University of Illinois:

“Since we may be looking more at the star’s pole than at its equator, it may be spinning much faster, and indeed is rotating so quickly that it is surrounded by a disk of matter that emits radiation, rendering Gomeisa a “B-emission” star rather like Gamma Cassiopeiae and Alcyone. Like these two, Gomeisa is distinguished by having the size of its disk directly measured, the disk’s diameter almost four times larger than the star. Like quite a number of hot stars (including Adhara, Nunki, and many others), Gomeisa is also surrounded by a thin cloud of dusty interstellar gas that it helps to heat.”

Now hop over to Gamma Canis Minoris, an orange K-type giant with an apparent magnitude of +4.33. It is a spectroscopic binary, has an unresolved companion which has an orbital period of 389 days, and is approximately 398 light years from Earth. And next is Epsilon Canis Minoris, a yellow G-type bright giant (apparent magnitude of +4.99) which is approximately 990 light years from Earth.

The location of Canis Minor in the northern hemisphere. Credit: IAU/Sky&Telescope magazine

For smaller telescopes, the double star Struve 1149 is a lovely sight, consisting of a yellow primary star and a faintly blue companion. For larger telescopes and GoTo telescopes, try NGC 2485 (RA 07 56.7 Dec +07 29), a magnitude 13 spiral galaxy that has a small, round glow, sharp edges and a very bright, stellar nucleus. If you want one that’s even more challenging, try NGC 2508 (RA 08 02 0 Dec +08 34).

Canis Minor lies in the second quadrant of the northern hemisphere (NQ2) and can be seen at latitudes between +90° and -75°. The neighboring constellations are Cancer, Gemini, Hydra, and Monoceros, and it is best visible during the month of March.

We have written many interesting articles about the constellation here at Universe Today. Here is What Are The Constellations?What Is The Zodiac?, and Zodiac Signs And Their Dates.

Be sure to check out The Messier Catalog while you’re at it!

For more information, check out the IAUs list of Constellations, and the Students for the Exploration and Development of Space page on Canes Venatici and Constellation Families.

Sources:

The Canis Major Constellation

Welcome back to Constellation Friday! Today, in honor of the late and great Tammy Plotner, we will be dealing with the “big dog” itself – the Canis Major constellation!

In the 2nd century CE, Greek-Egyptian astronomer Claudius Ptolemaeus (aka. Ptolemy) compiled a list of all the then-known 48 constellations. This treatise, known as the Almagest, would be used by medieval European and Islamic scholars for over a thousand years to come, effectively becoming astrological and astronomical canon until the early Modern Age.

One of these constellations included in Ptolemy’s collection was Canis Major, an asterism located in the southern celestial hemisphere. As one of two constellations representing “the dogs” (which are associated with “the hunter” Orion) this constellation contains many notable stars and Deep Sky Objects. Today, it is one of the 88 constellations recognized by the IAU, and is bordered by Monoceros, Lepus, Columba and Puppis.

Name and Meaning:

The constellation of Canis Major literally translates to “large dog” in Latin. The first recorded mentions of any of the stars associated with this asterism are traced back to Ancient Mesopotamia, where the Babylonians recorded its existence in their Three Star Each tablets (ca. 1100 BCE). In this account, Sirus (KAK.SI.DI) was seen as the arrow aimed towards Orion, while Canis Major and part of Puppis were seen as a bow.

Artist's impression of a white dwarf star in orbit around Sirius (a white supergiant). Credit: NASA, ESA and G. Bacon (STScI)
Artist’s impression of a white dwarf star in orbit around Sirius (a white supergiant). Credit: NASA, ESA and G. Bacon (STScI)

To the ancient Greeks, Canis Major represented a dog following the great hunter Orion. Named Laelaps, or the hound of Prociris in some accounts, this dog was so swift that Zeus elevated it to the heavens. Its Alpha star, Sirius, is the brightest object in the sky (besides the Sun, the Moon and nearest planets). The star’s name means “glowing” or “scorching” in Greek, since the summer heat occurred just after Sirius’ helical rising.

The Ancient Greeks referred to such times in the summer as “dog days”, as only dogs would be mad enough to go out in the heat. This association is what led to Sirius coming to be known as the “Dog Star”. Depending on the faintness of stars considered, Canis Major resembles a dog facing either above or below the ecliptic. When facing below, since Sirius was considered a dog in its own right, early Greek mythology sometimes considered it to be two headed.

Together with the area of the sky that is deserted (now considered as the new and extremely faint constellations Camelopardalis and Lynx), and the other features of the area in the Zodiac sign of Gemini (i.e. the Milky Way, and the constellations Gemini, Orion, Auriga, and Canis Minor), this may be the origin of the myth of the cattle of Geryon, which forms one of The Twelve Lab ours of Heracles.

Sirius and the "Summer Triangle", . Credit: Greg Bacon/ STScI/ESA/NASA
Artist’s impression of Sirius and the “Summer Triangle”. Credit: G. Bacon (STScI)/ESA/NASA

Sirius has been an object of wonder and veneration to all ancient peoples throughout human history. In fact, the Arabic word Al Shi’ra resembles the Greek, Roman, and Egyptian names suggesting a common origin in Sanskrit, in which the name Surya (the Sun God) simply means the “shining one.” In the ancient Vedas this star was known as the Chieftain’s star; and in other Hindu writings, it is referred to as Sukra – the Rain God, or Rain Star.

Sirius was revered as the Nile Star, or Star of Isis, by the ancient Egyptians. Its annual appearance just before dawn at the Summer Solstice heralded the flooding of the Nile, upon which Egyptian agriculture depended. This helical rising is referred to in many temple inscriptions, where the star is known as the Divine Sepat, identified as the soul of Isis.

To the Chinese, the stars of Canis Major were associated with several different asterisms – including the Military Market, the Wild Cockerel, and the Bow and Arrow. All of these lay in the Vermilion Bird region of the zodiac, on of four symbols of the Chinese constellations, which is associated with the South and Summer.  In this tradition, Sirius was known Tianlang (which means “Celestial Wolf”) and denoted invasion and plunder.

This constellation and its most prominent stars were also featured in the astrological traditions of the Maori people of New Zealand, the Aborigines of Australia, and the Polynesians of the South Pacific.

Isis depicted with outstretched wings in an ancient wall painting (ca. 1360 BCE). Credit: Wikipedia Commons/Ägyptischer Maler

History of Observation:

This constellation was one of the original 48 that Ptolemy included in his 2nd century BCE work the Amalgest. It would remain a part of the astrological traditions of Europe and the Near East for millennia. The Romans would later add Canis Minor, appearing as Orion’s second dog, using stars to the north-west of Canis Major.

In medieval Arab astronomy, the constellation became Al Kalb al Akbar, (“the Greater Dog”), which was transcribed as Alcheleb Alachbar by European astronomers by the 17th century. In 1862, Alvan Graham Clark, Jr. made an interesting discovery while testing an 18″ refractor telescope at the Dearborn Observatory at Northwestern University in Illinois.

In the course of observing Sirius, he discovered that the bright star had a faint companion – a white dwarf later named Sirius B (sometimes called “the Pup”). These observations confirmed what Friedrich Bessel proposed in 1844, based on measurements of Sirius A’s wobble. In 1922, the International Astronomical Union would include Canis Major as one of the 88 recognized constellations.

Canis Major as depicted in Urania's Mirror, a set of constellation cards published in London c.1825. Credit: Library of Congress
Canis Major as depicted in Urania’s Mirror, a set of constellation cards published in London c.1825. Credit: Library of Congress

Notable Features:

Canis Major has several notable stars, the brightest being Sirius A. It’s luminosity in the night sky is due to its proximity (8.6 light years from Earth), and the fact that it is a magnitude -1.6 star. Because of this, it produces so much light that it often appears to be flashing in vibrant colors, an effect caused by the interaction of its light with our atmosphere.

Then there’s Beta Canis Majoris, a variable magnitude blue-white giant star whose traditional name (Murzim) means the “The Heralder”. It is a Beta Cephei variable star and is currently in the final stages of using its hydrogen gas for fuel. It will eventually exhaust this supply and begin using helium for fuel instead. Beta Canis Majoris is located near the far end of the Local Bubble – a cavity in the local Interstellar medium though which the Sun is traveling.

Next up is Eta Canis Majoris, known by its traditional name as Aludra (in Arabic, “al-aora”, meaning “the virgin”). This star shines brightly in the skies in spite of its distance from Earth (approx. 2,000 light years from Earth) due to it being many times brighter (absolute magnitude) than the Sun. A blue supergiant, Aludra has only been around a fraction of the time of our Sun, yet is already in the last stages of its life.

Another “major” star in this constellation is VY Canis Majoris (VY CMa), a red hypergiant star located in the constellation Canis Major. In addition to being one of the largest known stars, it is also one of the most luminous ever observed. It is located about 3,900 light years (~1.2 kiloparsecs) away from Earth and is estimated to have 1,420 solar radii.

VY Canis Majoris. The biggest known star.
Size comparison between the Sun and VY Canis Majoris, which once held the title of the largest known star in the Universe. Credit: Wikipedia Commons/Oona Räisänen

Canis Major is also home to several Deep Sky Objects, the most notable being Messier 41 (NGC 2287). Containing about 100 stars, this impressive star cluster contains several red giant stars. The brightest of these is spectral type K3, and located near M41’s center. The cluster is estimated to be between 190 and 240 million years old, and its is believed to be 25 to 26 light years in diameter.

Then there’s the galactic star cluster NGC 2362. First seen by Giovanni Hodierna in 1654 and rediscovered William Herschel in 1783, this magnificent star cluster may be less than 5 million years old and show shows signs of nebulosity – the remains of the gas cloud from which it formed. What makes it even more special is the presence of Tau Canis Major.

Easily distinguished as the brightest star in the cluster, Tau is a luminous supergiant of spectral type O8. With a visual magnitude of 4.39, it is 280,000 times more luminous than Sol. Tau CMa is also brighter component of a spectroscopic binary and studies of NGC 2362 suggest that it will survive longer than the Pleiades cluster (which will break up before Tau does), but not as long as the Hyades cluster.

Then there’s NGC 2354, a magnitude 6.5 star cluster. While it will likely appear as a small, hazy patch to binoculars, NGC 2354 is actually a rich galactic cluster containing around 60 metal-poor members. As aperture and magnification increase, the cluster shows two delightful circle-like structures of stars.

The Canis Major Dwarf Galaxy - the Milky Way's current dinner. Image Credit: APOD
The Canis Major Dwarf Galaxy – currently recognized as being the closet neighbor to the Milky Way. Credit: APOD

For large telescopes and GoTo telescopes, there are several objects worth studying, like the Canis Major Dwarf Galaxy (RA 7 12 30 Dec -27 40 00). An irregular galaxy that is now thought to be the closest neighboring galaxy to our part of the Milky Way, it is located about 25,000 light-years away from our Solar System and 42,000 light-years from the Galactic Center.

It has a roughly elliptical shape and is thought to contain as many stars as the Sagittarius Dwarf Elliptical Galaxy, which was discovered in 2003 and thought to be the closest galaxy at the time. Although closer to the Earth than the center of the galaxy itself, it was difficult to detect because it is located behind the plane of the Milky Way, where concentrations of stars, gas and dust are densest.

Globular clusters thought to be associated with the Canis Major Dwarf galaxy include NGC 1851, NGC 1904, NGC 2298 and NGC 2808, all of which are likely to be a remnant of the galaxy’s globular cluster system before its accretion (or swallowing) into the Milky Way. NGC 1261 is another nearby cluster, but its velocity is different enough from that of the others to make its relation to the system unclear.

Finding Canis Major:

Finding Canis Major is quite easy, thanks to the presence of Sirius – the brightest star to grace the night sky. All you need to do is find Orion’s belt, discern the lower left edge of constellation (the star Kappa Orionis, or Saiph), and look south-west a few degrees. There, shining in all it glory, will be the “Dog Star”, with all the other stars stemming outwards from it.

The location of the Canis Major constellation in the southern sky. Credit: IAU

Unfortunately, Sirius A’s luminosity means that the means that poor “Pup” hardly stands a chance of being seen. At magnitude 8.5 it could easily be caught in binoculars if it were on its own. To find it, you’ll need a mid-to-large telescope with a high power eyepiece and good viewing conditions – a stable evening (not night) when Sirius is as high in the sky as possible. It will still be quite faint, so spotting it will take time and patience.

Between Sirius at the northern tip, and Adhara at the south, you can also spot M41 residing almost about halfway. Using binoculars or telescopes, all one need do is aim about 4 degrees south of Sirius – about one standard field of view for binoculars, about one field of view for the average telescope finderscope, and about 6 fields of view for the average wide field, low power eyepiece.

Thousands of years later, Canis Major remains an important part of our astronomical heritage. Thanks largely to Sirius, for burning so brightly, it has always been seen as a significant cosmological marker. But as our understanding of the cosmos has improved (not to mention our instruments) we have come to find just how many impressive stars and stellar objects are located in this region of space.

We have written many interesting articles about the constellation here at Universe Today. Here is What Are The Constellations?What Is The Zodiac?, and Zodiac Signs And Their Dates.

Be sure to check out The Messier Catalog while you’re at it!

For more information, check out the IAUs list of Constellations, and the Students for the Exploration and Development of Space page on Canes Venatici and Constellation Families.

Sources:


How Strong is the Gravity on Mars?

NASA's Hubble Space Telescope took this close-up of the red planet Mars
What is the gravity on Mars? NASA's Hubble Space Telescope took this close-up of the red planet Mars

The planet Mars has  few things in common. Both planets have roughly the same amount of land surface area, sustained polar caps, and both have a similar tilt in their rotational axes, affording each of them strong seasonal variability. Additionally, both planets present strong evidence of having undergone climate change in the past. In Mars’ case, this evidence points towards it once having a viable atmosphere and liquid water on its surface.

At the same time, our two planets are really quite different, and in a number of very important ways. One of these is the fact that gravity on Mars is just a fraction of what it is here on Earth. Understanding the effect this will likely have on human beings is of extreme importance when it comes time to send crewed missions to Mars, not to mention potential colonists.

Mars Compared to Earth:

The differences between Mars and Earth are all crucial for the existence of life as we know it. For instance, atmospheric pressure on Mars is a tiny fraction of what it is here on Earth – averaging 7.5 millibars on Mars to just over 1000 here on Earth. The average surface temperature is also lower on Mars, ranking in at a frigid -63 °C compared to Earth’s balmy 14 °C.

Artist rendition of the formation of rocky bodies in the solar system - how they form and differentiate and evolve into terrestrial planets. Image credit: NASA/JPL-Caltech
Artist rendition of the interior of Mars. Image credit: NASA/JPL-Caltech

And while the length of a Martian day is roughly the same as it is here on Earth (24 hours 37 minutes), the length of a Martian year is significantly longer (687 days). On top that, the gravity on Mars’ surface is much lower than it is here on Earth – 62% lower to be precise.  At just 0.376 of the Earth standard (or 0.376 g), a person who weighs 100 kg on Earth would weigh only 38 kg on Mars.

This difference in surface gravity is due to a number of factors – mass, density, and radius being the foremost. Even though Mars has almost the same land surface area as Earth, it has only half the diameter and less density than Earth – possessing roughly 15% of Earth’s volume and 11% of its mass.

Calculating Martian Gravity:

Scientists have calculated Mars’ gravity based on Newton’s Theory of Universal Gravitation, which states that the gravitational force exerted by an object is proportional to its mass. When applied to a spherical body like a planet with a given mass, the surface gravity will be approximately inversely proportional to the square of its radius. When applied to a spherical body with a given average density, it will be approximately proportional to its radius.

Fig. 2 Variations of gravity accelerations over Mars's surface. Azimuthal equidistant projection with a central meridian of 0° longitude (right) and 180° (left). Data shown is from MGM2011.
The Mars Gravity Model 2011 (MGM2011), showing variations of gravity accelerations over Mars’s surface. Credit: geodesy.curtin.edu.au

These proportionalities can be expressed by the formula g = m/r2, where g is the surface gravity of Mars (expressed as a multiple of the Earth’s, which is 9.8 m/s²), m is its mass – expressed as a multiple of the Earth’s mass (5.976·1024 kg) – and r its radius, expressed as a multiple of the Earth’s (mean) radius (6,371 km).

For instance, Mars has a mass of 6.4171 x 10²³ kg, which is 0.107 times the mass of Earth. It also has a mean radius of 3,389.5 km, which works out to 0.532 Earth radii. The surface gravity of Mars can therefore be expressed mathematically as: 0.107/0.532², from which we get the value of 0.376. Based on the Earth’s own surface gravity, this works out to an acceleration of 3.711 meters per second squared.

Implications:

At present, it is unknown what effects long-term exposure to this amount of gravity will have on the human body. However, ongoing research into the effects of microgravity on astronauts has shown that it has a detrimental effect on health – which includes loss of muscle mass, bone density, organ function, and even eyesight.

Understanding Mars’ gravity and its affect on terrestrial beings is an important first step if we want to send astronauts, explorers, and even settlers there someday. Basically, the effects of long-term exposure to gravity that is just over one-third the Earth normal will be a key aspect of any plans for upcoming manned missions or colonization efforts.

Artist's concept of a Martian astronaut standing outside the Mars One habitat. Credit: Bryan Versteeg/Mars One
Artist’s concept of a Martian astronaut standing outside the Mars One habitat. Credit: Bryan Versteeg/Mars One

For example, crowd-sourced projects like Mars One make allowances for the likelihood of muscle deterioration and osteoporosis for their participants. Citing a recent study of International Space Station (ISS) astronauts, they acknowledge that mission durations ranging from 4-6 months show a maximum loss of 30% muscle performance and maximum loss of 15% muscle mass.

Their proposed mission calls for many months in space to get to Mars, and for those volunteering to spend the rest of their lives living on the Martian surface. Naturally, they also claim that their astronauts will be “well prepared with a scientifically valid countermeasures program that will keep them healthy, not only for the mission to Mars, but also as they become adjusted to life under gravity on the Mars surface.”  What these measures are remains to be seen.

Learning more about Martian gravity and how terrestrial organisms fare under it could be a boon for space exploration and missions to other planets as well. And as more information is produced by the many robotic lander and orbiter missions on Mars, as well as planned manned missions, we can expect to get a clearer picture of what Martian gravity is like up close.

As we get closer to NASA’s proposed manned mission to Mars, which is currently scheduled to take place in 2030, we can certainly expect that more research efforts will be attempted.

We have written many interesting articles about Mars here at Universe Today. Here’s How Strong is the Gravity on Other Planets?, Martian Gravity to be Tested on Mice, Mars Compared to Earth, Asteroids Can Get Shaken and Stirred by Mars’ Gravity, How Do We Colonize Mars? How Can We Live on Mars?, and How Do We Terraform Mars?

Information on the Mars Gravity Biosatellite. And the kids might like this; a project they can build to demonstrate Mars gravity.

Astronomy Cast also has some wonderful episodes on the subject. Here’s Episode 52: Mars, and Episode 95: Humans to Mars, Part 2 – Colonists.

Sources:

What is an Orrery?

Mechanical orrery by Gilkerson, in Armagh Observatory. Credit: star.arm.ac.uk

For thousands of years, humans have been studying the heavens, seeking to find patterns and predictability in their movements. This tradition goes all the way back to prehistory, where hunter-gatherer societies assigned characteristics to asterisms and celestial bodies. And from the 2nd millennium onward, magi and astronomers began recording the movements of the constellations and the planets through the zodiac.

By classical antiquity, attempts began to create astrolabes and other devices that would allow astronomers to know where the stars and planets were at any given time. These would eventually culminate in the creation of the orrery, a mechanical device that attempts to recreate the Solar System and the movements of its planets and moons around our Sun.

Definition:

Traditionally, an orrery is a mechanical model of the Solar System, or at least the major planets. This device is driven by a clockwork mechanism that simulates the motion of the planets (and, in some cases, major moons) around the Sun. This last feature is key, since most known orreries were produced during the early modern period and after, when the Heliocentric model of the Solar System came to be the accepted one.

Orreries are typically driven by a clockwork mechanism with a globe representing the Sun at the center, and with a planet at the end of each of the arms. They are usually not to scale, partly because of the difficulty of mechanically modeling the distances involved, the eccentricity of various planets’ orbits, and the planets’ massive differences in terms of size.

Though many working planetaria were created during Classical Antiquity, the first orrery of the modern era was produced in 1704 by clock makers George Graham and Thomas Tompion. The name is derived from Charles Boyle, the 4th Earl of Orrery, England, who commissioned famed instrument maker John Rowley to build one in 1713 based on the design of Graham and Tompion.

Early Examples:

The Antikythera mechanism, which is dated to ca. 150 – 100 BCE, may be considered the first orrery that is still in existence. Discovered in the wreck of a ship in 1900 off the Greek island of Antikythera (hence the name), this device consisted of hand-driven mechanisms that represented the diurnal motions of the Sun, the Moon, and the then-known five known planets (Mercury, Venus, Earth, Mars, Jupiter).

The Antikythera Mechanism may be the world's oldest computer. Image: By Marsyas CC BY 2.5
The Antikythera Mechanism may be the world’s oldest computer. Credit: Wikipedia Commons/Marsyas

Reflecting the cosmological view of the Greeks, the device was geocentric in nature and was used as a mechanical calculator designed to determine astronomical positions. According to Roman philosopher Cicero (106 – 43 BCE), the Syrian-born Greek philosopher Posidonius of Rhodes (ca. 135 – 51 BCE ) built a planetary model as well. With the fall of the Roman Empire, the art would not be resurrected until the late Medieval Period.

In 1348, Italian doctor and clock maker Giovanni Dondi built the first known clock-driven mechanism which displayed the position of Moon, Sun, Mercury, Venus, Mars, Jupiter and Saturn along the ecliptic – according to the Ptolemaic (geocentric) model of the Solar system. At present, only a written account survives, but it is extremely detailed in its description of the mechanisms involved.

During the 16th century, two astronomical clocks were built for the court of William IV, Langrave of Hesse-Kassel (in modern day Bavaria, Germany). These showed the motions of the Sun, Moon, Mercury, Venus, Mars, Jupiter and Saturn based on the Ptolemaic system.  These clocks are now on display at the Museum of Physics and Astronomy and the Royal Cabinet of Mathematical and Physical Instruments (in Kassel and Dresden, respectively).

Modern Examples:

Thanks to Copernicus’s proposal of the Heliocentric model of the Universe, Isaac Newton’s Law of Universal Gravitation, and other discoveries that took place during the Scientific Revolution, orreries changed significantly by the early modern period. In essence, the Heliocentric model simplified the apparent orbits of the planets around the Sun, to the point that they could be represented as simple circles or ellipses.

A Philosopher Lecturing on the Orrery (ca. 1766) by Joseph Wright of Derby. Credit: Public Domain

As noted, the first modern orrery was created in 1704 in England by clock makers George Graham and Thomas Tompion. This design was given to instrument maker Jon Rowely, who then produced a copy for the Prince Eugene of Savoy and was commissioned by his patron – Charles Boyle – to build them for himself and his son John – who would go on to become the 5th Earl of Orrery (and the 5th Earl of Cork).

Between 1665 and 1681, while in Paris, Christiaan Huygens created a heliocentric planetary machine that represented a year and the cycles of the then-known planets. He would go on to publish papers describing its functions by 1703. The painting “A Philosopher giving a Lecture on the Orrery in which a lamp is put in place of the Sun”, which Jospeh Wright completed in 1766, features a brass orrery as its centerpiece.

Between 1774 and 1781, Eisinga’s Planetarium was built in Franeker, in the Netherlands by amateur Frisian astronomer Eise Eisinga. Central to the planetarium is an orrery which shows the orbits of the planets across the width of the room’s ceiling. The clockwork machine that powers it has been in almost continuous operation since it first opened.

In 1764, Benjamin Martin invented a new type of orrery that relied on three parts – the planetarium where the planets revolved around the Sun; the tellurion, which showed the inclined axis of the Earth and how it revolved around the Sun; and the lunarium which showed the eccentric rotations of the Moon around the Earth. This allowed for a more accurate representations of the Solar System, which included the planet’s inclinations, relative to the Sun.

Orreries Today:

Today, with immense amounts of low-cost computing power available, software has been developed to calculate the relative positions and motions of Solar System bodies. Examples of these “digital orreries” include a java applet used at the Department of Physics at the University of Texas at Austin, and Orrery, a Solar System Visualizer from The Geometry Center at the University of Minnesota (which relies on Unix).

There is also the Digital Orrery, a special-purpose computer designed to model the long term motions of the outer planets of the Solar System. Constructed in 1985, it was built to answer a long-standing question about the Solar System, which is whether or not it is stable (invariably, the answer was a big no). This device is now at the Smithsonian Institution in Washington, DC.

And in 2013, the first virtual orrery was created by the Cattle Point Foundation at the DARK SKY Urban Star Park, located in Oak Bay, British Columbia. The orrery is called “The Salish Sea Walk of the Planets“, and was built with Google Maps to avoid negatively impacting the park and the nearby Orca and wildlife sanctuaries. This orrery has now extended beyond the Star Park to become the world largest, covering a distance of over 8,500 km (5,300 mi).

Credit: attlepointstarpark.org
The Sun and Cairn, part of “The Salish Sea Walk of the Planets” in Oak Bay, BC. Credit: attlepointstarpark.org

The Sun is located in the Star Park in Oak Bay (shown above) while Pluto (the most distant “planet”) is located in Bamfield on the western side of Vancouver Island, BC. The Kuiper Belt Objects are situated north in the small towns of Ucluelet and Tofino while the farthest object within our Solar System – the Oort Cloud – is across the sea at the Canadian Embassy in Beijing, China.

Meanwhile, physical orreries still exist in many locations. For example, there’s The York Solar System Model Orrery, a special bike path constructed in 1999 and maintained by York University in the UK. Spread out along 10.3 km (6.4 miles) of the old East Coast main-line railway, this scale model of the Solar System contains all the planets of the Solar System, as well as models of the Cassini and Voyager spacecraft.

There is also the “Path of the Planets Uetliberg–Felsenegg“, which follows a hiking trail along the Albis (a chain of hills in Switzerland). The path was designed by Arnold von Rotz to be a 1:1 billion scale model of the Solar System (where 1 meter equals 1 billion km). The path runs from the towns of Uetliberg to Felsenegg (which is about 2 hours away on foot) and opened on April 26th, 1979.

Each planet is represented by a large orb that is mounted to a boulder or affixed inside one (depending on their size) and has a sign that includes the body’s place in the Solar System and their basic info (like equatorial diameter, rotational speed, etc.)

. Credit: uetliberg.ch
The bronze orb representing the Sun along the “Passauer Footpath of the Planets”, in Lower  Bavaria, Germany. Credit: uetliberg.ch

There’s also The Human Orrery, which is located at Armagh Observatory, in Northern Ireland. This orrery allows people to play the part of the planets of Mercury, Venus, Earth, Mars, Jupiter, and Saturn, as well as Ceres and two comets (1P/Halley and 2P/Encke). Due to their immense distance, and the fact the orrery is to scale, Uranus and Neptune are not included.

From our humble beginnings as hunter-gatherers who looked up at the stars and discerned patterns in their appearance, humanity has come a long way in terms of its understanding of the Universe. As we invented devices to look deeper into the night sky, and even explore space directly, our models have matured accordingly, growing in terms of accuracy and complexity.

That tradition continues, with more mission to study and explore the outer Solar System proceeding apace. Future orreries are likely to take advantage of all this, leveraging new technologies and new information to create even more detailed and interesting representations of our cosmic background!

We have written many interesting articles about the planets here at Universe Today. Here’s The Solar System Guide, What is the Geocentric Model of the Universe?, What is the Heliocentric Model of the Universe?, What is the Difference Between the Geocentric and Heliocentric model of the Solar System?, and How Many Planets are in the Solar System?

Source:

How Strong is the Force of Gravity on Earth?

The Geoid 2011 model, based on data from LAGEOS, GRACE, GOCE and surface data. Credit: GFZ

Gravity is a pretty awesome fundamental force. If it wasn’t for the Earth’s comfortable 1 g, which causes objects to fall towards the Earth at a speed of 9.8 m/s², we’d all float off into space. And without it, all us terrestrial species would slowly wither and die as our muscles degenerated, our bones became brittle and weak, and our organs ceased to function properly.

So one can say without exaggerations that gravity is not only a fact of life here on Earth, but a prerequisite for it. However, since human beings seem intent on getting off this rock – escaping the “surly bonds of Earth”, as it were – understanding Earth’s gravity and what it takes to escape it is necessary. So just how strong is Earth’s gravity?

Definition:

To break it down, gravity is a natural phenomena in which all things that possess mass are brought towards one another – i.e. asteroids, planets, stars, galaxies, super clusters, etc. The more mass an object has, the more gravity it will exert on objects around it. The gravitational force of an object is also dependent on distance – i.e. the amount it exerts on an object decreases with increased distance.

Artist's impression of the effect Earth's gravity has on spacetime. Credit: NASA
Artist’s impression of the effect Earth’s gravity has on spacetime. Credit: NASA

Gravity is also one of the four fundamental forces which govern all interactions in nature (along with weak nuclear force, strong nuclear force, and electromagnetism). Of these forces, gravity is the weakest, being approximately 1038 times weaker than the strong nuclear force, 1036 times weaker than the electromagnetic force and 1029 times weaker than the weak nuclear force.

As a consequence, gravity has a negligible influence on matter at the smallest of scales (i.e. subatomic particles). However, at the macroscopic level – that of planets, stars, galaxies, etc. – gravity is the dominant force affecting the interactions of matter. It causes the formation, shape and trajectory of astronomical bodies, and governs astronomical behavior. It also played a major role in the evolution of the early Universe.

It was responsible for matter clumping together to form clouds of gas that underwent gravitational collapse, forming the first stars – which were then drawn together to form the first galaxies. And within individual star systems, it caused dust and gas to coalesce to form the planets. It also governs the orbits of the planets around stars,  of moons around planets, the rotation of stars around their galaxy’s center, and the merging of galaxies.

Universal Gravitation and Relativity:

Since energy and mass are equivalent, all forms of energy, including light, also cause gravitation and are under the influence of it. This is consistent with Einstein’s General Theory of Relativity, which remains the best means of describing gravity’s behavior. According to this theory, gravity is not a force, but a consequence of the curvature of spacetime caused by the uneven distribution of mass/energy.

Artist's impression of the frame-dragging effect in which space and time are dragged around a massive body. Credit: einstein.stanford.edu
Artist’s impression of the frame-dragging effect in which space and time are dragged around a massive body. Credit: einstein.stanford.edu

The most extreme example of this curvature of spacetime is a black hole, from which nothing can escape. Black holes are usually the product of a supermassive star that has gone supernova, leaving behind a white dwarf remnant that has so much mass, it’s escape velocity is greater than the speed of light. An increase in gravity also results in gravitational time dilation, where the passage of time occurs more slowly.

For most applications though, gravity is best explained by Newton’s Law of Universal Gravitation, which states that gravity exists as an attraction between two bodies. The strength of this attraction can calculated mathematically, where the attractive force is directly proportional to the product of their masses and inversely proportional to the square of the distance between them.

Earth’s Gravity:

On Earth, gravity gives weight to physical objects and causes the ocean tides. The force of Earth’s gravity is the result of the planets mass and density – 5.97237 × 1024 kg (1.31668×1025 lbs) and 5.514 g/cm3, respectively. This results in Earth having a gravitational strength of 9.8 m/s² close to the surface (also known as 1 g), which naturally decreases the farther away one is from the surface.

In addition, the force of gravity on Earth actually changes depending on where you’re standing on it. The first reason is because the Earth is rotating. This means that the gravity of Earth at the equator is 9.789 m/s2, while the force of gravity at the poles is 9.832 m/s2. In other words, you weigh more at the poles than you do at the equator because of this centripetal force, but only slightly more.

The International Space Station (ISS), seen here with Earth as a backdrop. Credit: NASA
The International Space Station (ISS), seen here from an undocked crew mission with Earth as a backdrop. Credit: NASA

Finally, the force of gravity can change depending on what’s under the Earth beneath you. Higher concentrations of mass, like high-density rocks or minerals can change the force of gravity that you feel. But of course, this amount is too slight to be noticeable. NASA missions have mapped the Earth’s gravity field with incredible accuracy, showing variations in its strength, depending on location.

Gravity also decreases with altitude, since you’re further away from the Earth’s center. The decrease in force from climbing to the top of a mountain is pretty minimal (0.28% less gravity at the top of Mount Everest), but if you’re high enough to reach the International Space Station (ISS), you would experience 90% of the force of gravity you’d feel on the surface.

However, since the station is in a state of free fall (and also in the vacuum of space) objects and astronauts aboard the ISS are capable of floating around. Basically, since everything aboard the station is falling at the same rate towards the Earth, those aboard the ISS have the feeling of being weightless – even though they still weight about 90% of what they would on Earth’s surface.

Earth’s gravity is also responsible for our planet having an “escape velocity” of 11.186 km/s (or 6.951 mi/s). Essentially, this means that a rocket needs to achieve this speed before it can hope to break free of Earth’s gravity and reach space. And with most rocket launches, the majority of their thrust is dedicated to this task alone.

Because of the difference between Earth’s gravity and the gravitational force on other bodies – like the Moon (1.62 m/s²; 0.1654 g) and Mars (3.711 m/s²; 0.376 g) – scientists are uncertain what the effects would be to astronauts who went on long-term missions to these bodies.

While studies have shown that long-duration missions in microgravity (i.e. on the ISS) have a detrimental effect on astronaut health (including loss of bone density, muscle degeneration, damage to organs and to eyesight) no studies have been conducted regarding the effects of lower-gravity environments. But given the multiple proposals made to return to the Moon, and NASA’s proposed “Journey to Mars“, that information should be forthcoming!

As terrestrial beings, we humans are both blessed and cursed by the force of Earth’s gravity. On the one hand, it makes getting into space rather difficult and expensive. On the other, it ensures our health, since our species is the product of billions of years of species evolution that took place in a 1 g environment.

If we ever hope to become a truly space-faring and interplanetary species, we better figure out how we’re going to deal with microgravity and lower-gravity. Otherwise, none of us are likely to get off-world for very long!

We have written many articles about the Earth for Universe Today. Here’s Where Does Gravity Come From?, Who Discovered Gravity?, Why is the Earth Round?, Why Doesn’t the Sun Steal the Moon?, Could We Make Artificial Gravity?, and The “Potsdam Gravity Potato” Shows Variations in Earth’s Gravity.

Want more resources on the Earth? Here’s a link to NASA’s Human Spaceflight page, and here’s NASA’s Visible Earth.

We have also recorded an episode of Astronomy Cast about Earth, as part of our tour through the Solar System – Episode 51: Earth, and Episode 318: Escape Velocity.

Sources: