A photo of the full moon, taken from Apollo 11 on its way home to Earth, from about 18,520 km (10,000 nm) away. Credit: NASA
The Moon has been around since the earliest days of the Solar System. To human beings, there has never been a time when we couldn’t look up in the night sky and either see the Moon hanging there, or know that it would be back the very next night (i.e. a New Moon). And thanks to the development of modern astronomy and space exploration, our understanding of the Moon has grown immensely.
For instance, we know that the Moon formed early in Earth’s history, and that it may have played an important role in the development of life here on Earth. We’ve also learned that Moon is tidally-locked with Earth, which means that one side is constantly facing towards it. But how long is a day on the Moon? With one side facing the Earth and the other side facing out, what constitutes a single day on the lunar surface?
To break it down simply, a day on the Moon lasts as long as 29.5 Earth days. In other words, if you were standing on the surface of the Moon, it would take 29.5 days for the Sun to move all the way across the sky and return to its original position again. However, as with all bodies in the Solar System, distinguishing between different types of days (based on different types of periods) is necessary.
Orbit and Rotation:
Since ancient times, lunar calendars have been based on thirteen months of 28 days each, reflecting the lunar cycle. But as astronomers have discovered from centuries of studying the Moon’s behavior, the Moon’s orbital period (i.e. the time it takes for the Moon to complete a single orbit around the Earth) is actually the equivalent of about 27.3 Earth days – or 27 days 7 hours 43 minutes and 11.5 seconds, to be precise.
And while the Moon rotates on its own axis, the speed at which it rotates (aka. it’s sidereal rotation) is very slow. In fact, it takes the Moon the equivalent of 27.3 Earth days to complete a single rotation on its axis, the same amount of time it takes to complete a single orbit around Earth. What this means is that the Moon is tidally-locked with Earth.
In other words, the Moon always points the same face towards the Earth, which is why human beings are so familiar with the “face” of the Moon, and refer to the side that faces away from us as the “the dark side”. Therefore, if you were standing on the surface of the Moon, you would always see the Earth in exactly the same position, while the stars and the Sun would continue to move around in the sky.
Sidereal vs. Synodic Day:
However, the Moon’s sidereal rotation is not where we get a the value of a single lunar day from. While it takes 27.3 days for it to orbit the Earth, we have to keep in mind that the Earth is also orbiting the Sun. The Earth returns to its same position in orbit every 365 days. So in order for the Sun to catch up to its same position in the sky from the perspective of the Moon, it has to turn a little more.
The extra 2.2 days is the time for the Moon to catch up in its rotation. And while the amount of time the Moon takes to complete one turn on its axis with respect to the stars is 27.3 days (a sidereal day), the amount of time it takes for the Sun to return to the same position in the sky is called a synodic day, and that’s what takes 29.5 days.
Ergo, a single day on the Moon, with respect to the Sun returning to the same position in the sky, is actually about as long as an average month here on Earth. So if people are planning on living there someday, and aren’t living in the permanently shadowed craters that exist in the southern and norther polar regions, that’s something they might have to get used to.
As with all the bodies of the Solar System, it all comes down to a matter of perspective. And if you’re living on the Moon, your perspective on what constitutes a day will be vastly different from that of a person who was born on Earth.
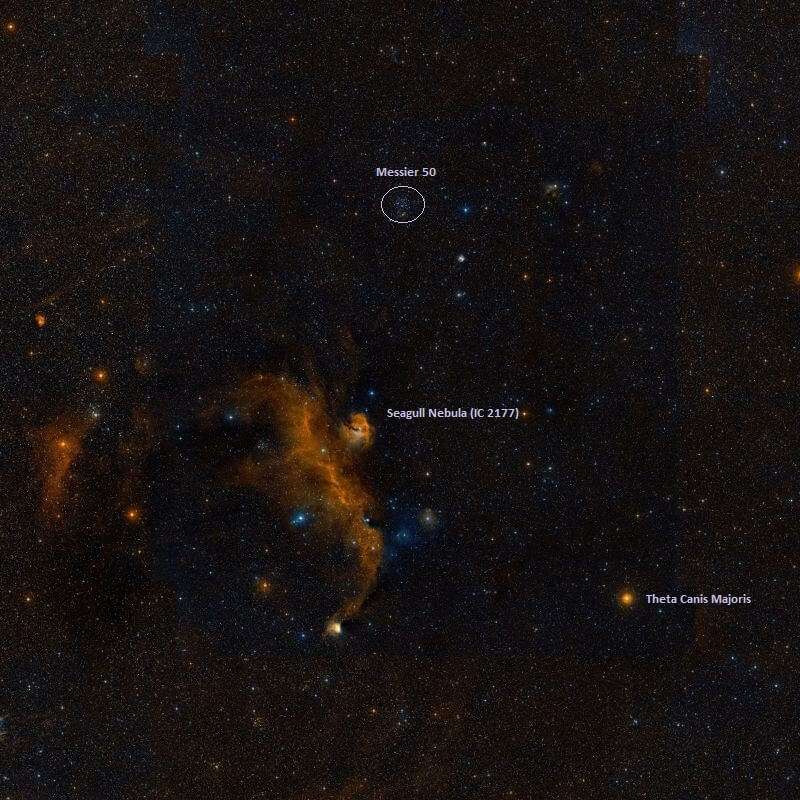
The Messier 50 open star cluster, shown in proximity to the Seagull Nebula (IC 2177). Credit: Wikisky
Welcome back to Messier Monday! We continue our tribute to our dear friend, Tammy Plotner, by looking at the open star cluster of Messier 50. Enjoy!
In the 18th century, while searching the night sky for comets, French astronomer Charles Messier kept noting the presence of fixed, diffuse objects in the night sky. In time, he would come to compile a list of approximately 100 of these objects, with the purpose of making sure that astronomers did not mistake them for comets. However, this list – known as the Messier Catalog – would go on to serve a more important function.
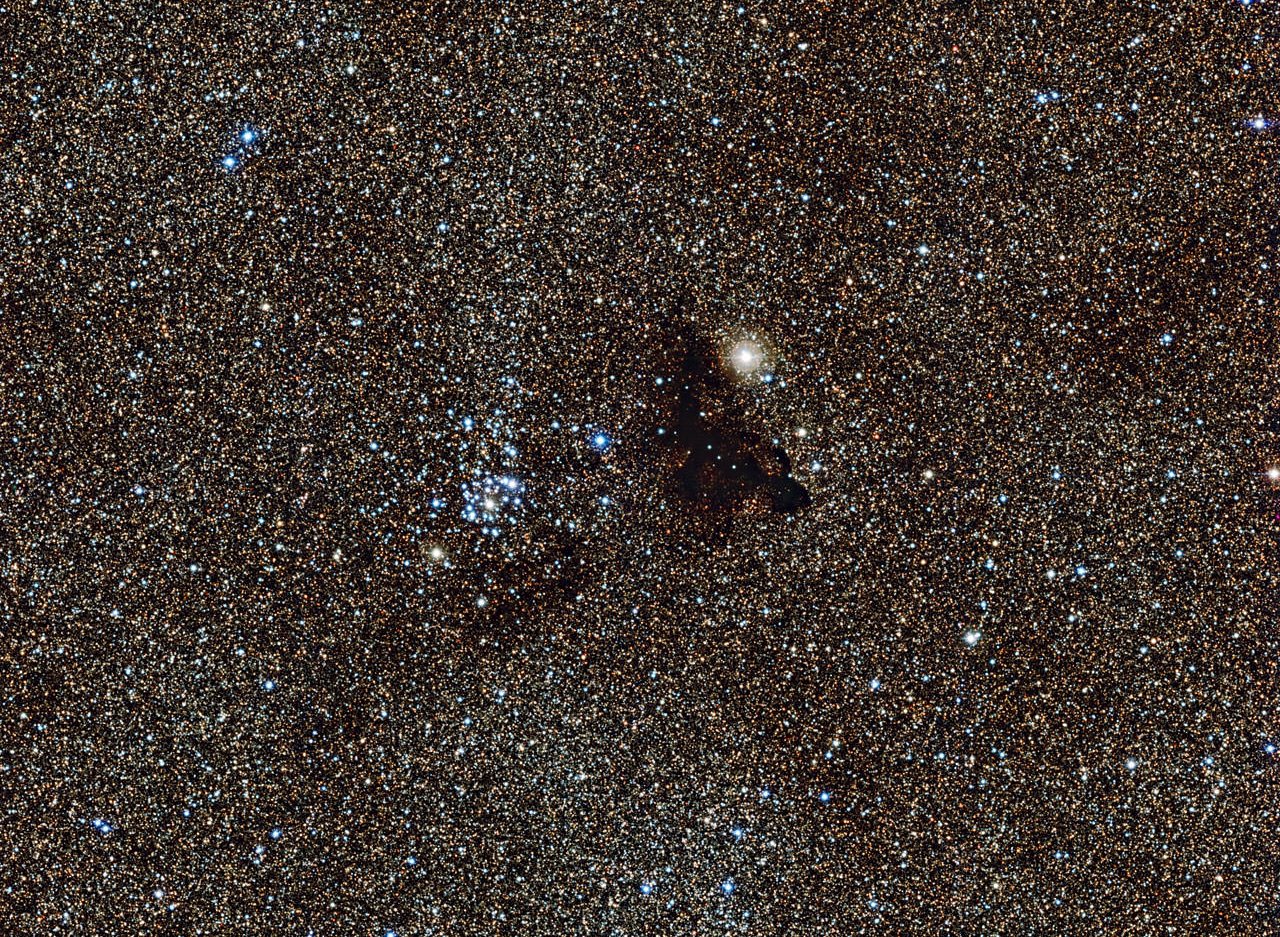
One of these objects is the open star cluster known as Messier 50 (aka. NGC 2323). Located at a distance of about 3,200 light-years from Earth, this object sits near the border between the Monoceros and Canis Major constellations. It is described as a ‘heart-shaped’ figure, occupies an area about half the size of the full Moon, and is easy to find because of its proximity to Sirius (the brightest star in the night sky).
Description:
Located about 3,200 light years from our solar system, this stellar gathering could be perhaps as much as 20 light years across, but the central concentration is believed to only span across roughly 10 light years. While that doesn’t seem that large, it’s lit by the candlepower of what could be 200 stars! And picking such a group of stars out of a well-known OB1 association isn’t easy. It requires photometry. As J.J. Claria (et al) remarked in a 1997 study:
“UBV and DDO photoelectric photometry in the field of the open cluster NGC 2323 is presented. The analysis yields 109 probable members; one of them being a red giant, and 3 possible members. The basic cluster parameters are derived. NGC 2323 appears not to be physically connected to the CMa OB1 association.”
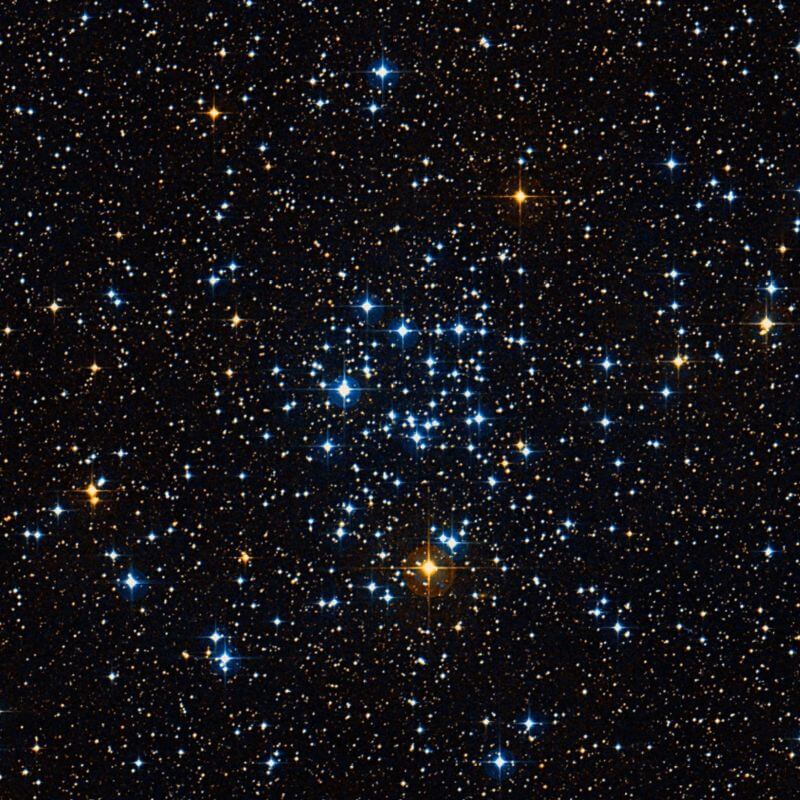
Close up of the Messier 50 open star cluster. Credit: Wikisky
In this region of the sky are vast molecular clouds compressing into star forming regions known as OB1 associations. The stars spawned by these vast clouds form into open clusters containing dozens to thousands of members and, over time, disassociate with not only the molecular cloud, but their sibling star clusters as well. Sure, it took 100-120 million years for it to happen, but as the group of stars cut away from the field, each member also aged differently.
By studying open clusters like M50 and its relative M35, we can learn more about the dynamics of star clusters which formed roughly at the same time in the same area. As Jasonjot Kalirai (et al) indicated in their 2003 study:
“The color-magnitude diagrams for the clusters exhibit clear main sequences stretching over 14 mag in the (V, B-V)-plane. Comparing these long main sequences with those of earlier clusters in the survey, as well as with the Hyades, has allowed for accurate distances to be established for each cluster. Analysis of the luminosity and mass functions suggests that, despite their young ages, both clusters are somewhat dynamically relaxed, exhibiting signs of mass segregation. This is especially interesting in the case of NGC 2323, which has an age of only 1.3 times the dynamical relaxation time. The present photometry is also deep enough to detect all of the white dwarfs in both clusters. We discuss some interesting candidates that may be the remnants of quite massive (M>=5Msolar) progenitor stars. The white dwarf cooling age of NGC 2168 is found to be in good agreement with the main-sequence turnoff age. These objects are potentially very important for setting constraints on the white dwarf initial-final mass relationship and the upper mass limit for white dwarf production.”
So, did age or movement produce the colorful display of stars we can observe in M50 – or was it simply the chemical ingredients responsible? According to a 2005 study conducted by Bragaglia and Monica:
“We describe a long-term project aimed at deriving information on the chemical evolution of the Galactic disk from a large sample of open clusters. The main property of this project is that all clusters are analyzed in a homogeneous way to guarantee the robustness of the ranking in age, distance, and metallicity. Special emphasis is devoted to the evolution of the earliest phases of the Galactic disk evolution, for which clusters have superior reliability with respect to other types of evolution indicators. The project is twofold: on one hand we derive the age, distance, and reddening (and indicative metallicity) by interpreting deep and accurate photometric data with stellar evolution models, and on the other hand, we derive the chemical abundances from high-resolution spectroscopy. The importance of quantifying the theoretical uncertainties by deriving the cluster parameters with various sets of stellar models is emphasized. Stellar evolution models assuming overshooting from convective regions appear to better reproduce the photometric properties of the cluster stars. The examined clusters show a clear metallicity dependence on the galactocentric distance and no dependence on age. The tight relation between cluster age and magnitude difference between the main-sequence turnoff and the red clump is confirmed.”
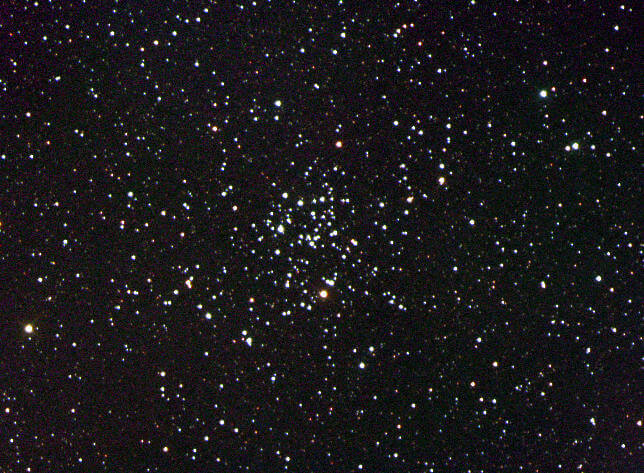
The M50 open cluster. Credit: Ole Nielsen
History of Observation:
While M50 was possibly discovered by G.D. Cassini 1711, it was independently recovered by Charles Messier on the night of April 5th, 1772. In his notes, he wrote of his discovery:
“Cluster of small stars, more or less brilliant, above the right loins of the Unicorn, above the star Theta of the ear of Canis Major, & near a star of 7th magnitude. It was while observing the Comet of 1772 that M. Messier observed this cluster. He has reported it on the chart of that comet, on which its trace has been drawn.”
It would later be observed by William Hershel, but not until his son John cataloged it before anyone began to notice colors in the stars. However, Admiral Smyth did!
“This is an irregularly round and very rich mass, occupying with its numerous outliers more than the field, and composed of stars from the 8th to the 16th magnitudes; and there are certain spots of splendour which indicate minute masses beyond the power of my telescope. The most decided points are, a red star towards the southern verge, and a pretty little equilateral triangle of 10th sizers, just below, or north of it. The double star here noted was carefully estimated under a full knowledge of the vertical and parallel lines of the field of view: this was made triple by H. [John Herschel], whose 2357 of the Fifth Series it is; but he must be mistaken in calling it Struve 748, which is Theta Orionis. It is sufficiently conspicuous as a double star, and though I perceive an infinitesimal point exactly om the vertical of A, I cannot ascertain whether it is H.’s C. This superb object was discovered by Messier in 1771 [actually 1772], and registered “a mass of small stars more or less brilliant.” It is 9 deg north-north-east of Sirius, and rather more than one-third of the distance between that star and Procyon.”
Locating Messier 50:
Because M50 is such a big and bright open star cluster, it’s relatively easy to find with complicated starhop instructions. Actually, the constellation of Monoceros is more difficult! Begin by identifying the brightest star in northern hemisphere skies – Alpha Canis Major – Sirius. Roughly a handspan to the northeast you’ll see another prominent bright star – Alpha Canis Minor – Procyon.
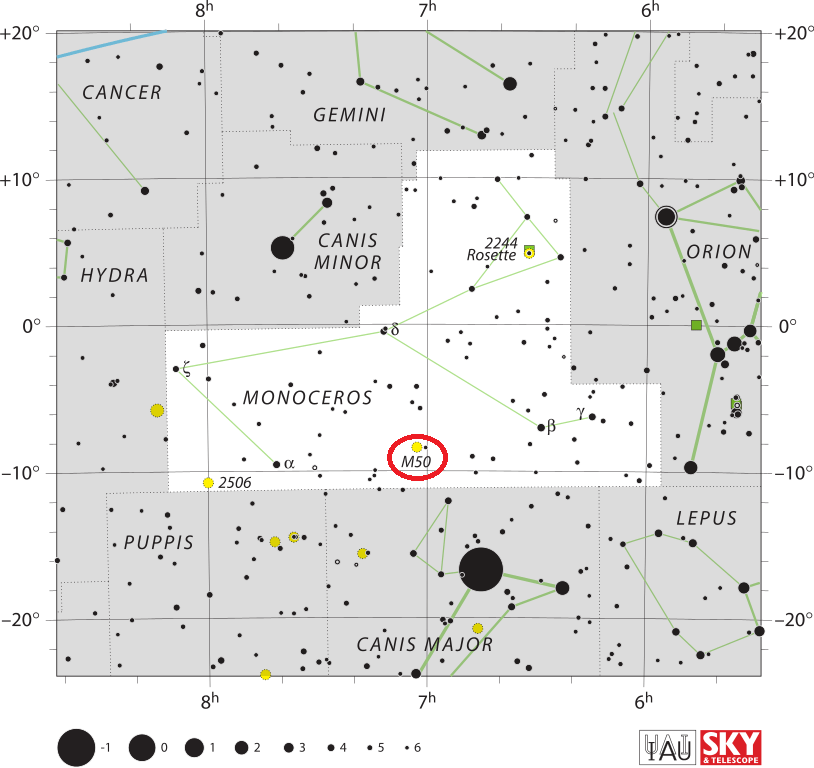
The location of Messier 50 in the Monoceros constellation. Credit: IAU/Sky & Telescope magazine (Roger Sinnott & Rick Fienberg)
Between these two lay the faint and indistinguishable constellation of Monoceros, and slightly southwest of the center point is Messier 50. In small binoculars and a telescope finderscope, you’ll quickly spot a compression in the starfield, and may even be able to see it as a slight contrast change with the unaided eye. In larger binoculars and small telescopes, it blooms into a cloud of stars, well resolved against the grainy backdrop of fainter stars.
In large aperture telescopes, even more stars resolve and colors begin to appear. Because of magnitude and the nature of star clusters, Messier 50 makes an outstanding target for high light pollution areas, moonlit nights and even less than perfect sky conditions.
Enjoy your own “colorful” observations of this rich and beautiful star cluster!
And as always, here are the quick facts on this Messier Object to help you get started:
Object Name: Messier 50 Alternative Designations: M50, NGC 2323 Object Type: Open Galactic Star Cluster Constellation: Monoceros Right Ascension: 07 : 03.2 (h:m) Declination: -08 : 20 (deg:m) Distance: 3.2 (kly) Visual Brightness: 5.9 (mag) Apparent Dimension: 16.0 (arc min)
Welcome to another edition of Constellation Friday! Today, in honor of the late and great Tammy Plotner, we take a look at the “Raven” – the Corvus constellation. Enjoy!
In the 2nd century CE, Greek-Egyptian astronomer Claudius Ptolemaeus (aka. Ptolemy) compiled a list of all the then-known 48 constellations. This treatise, known as the Almagest, would be used by medieval European and Islamic scholars for over a thousand years to come, effectively becoming astrological and astronomical canon until the early Modern Age.
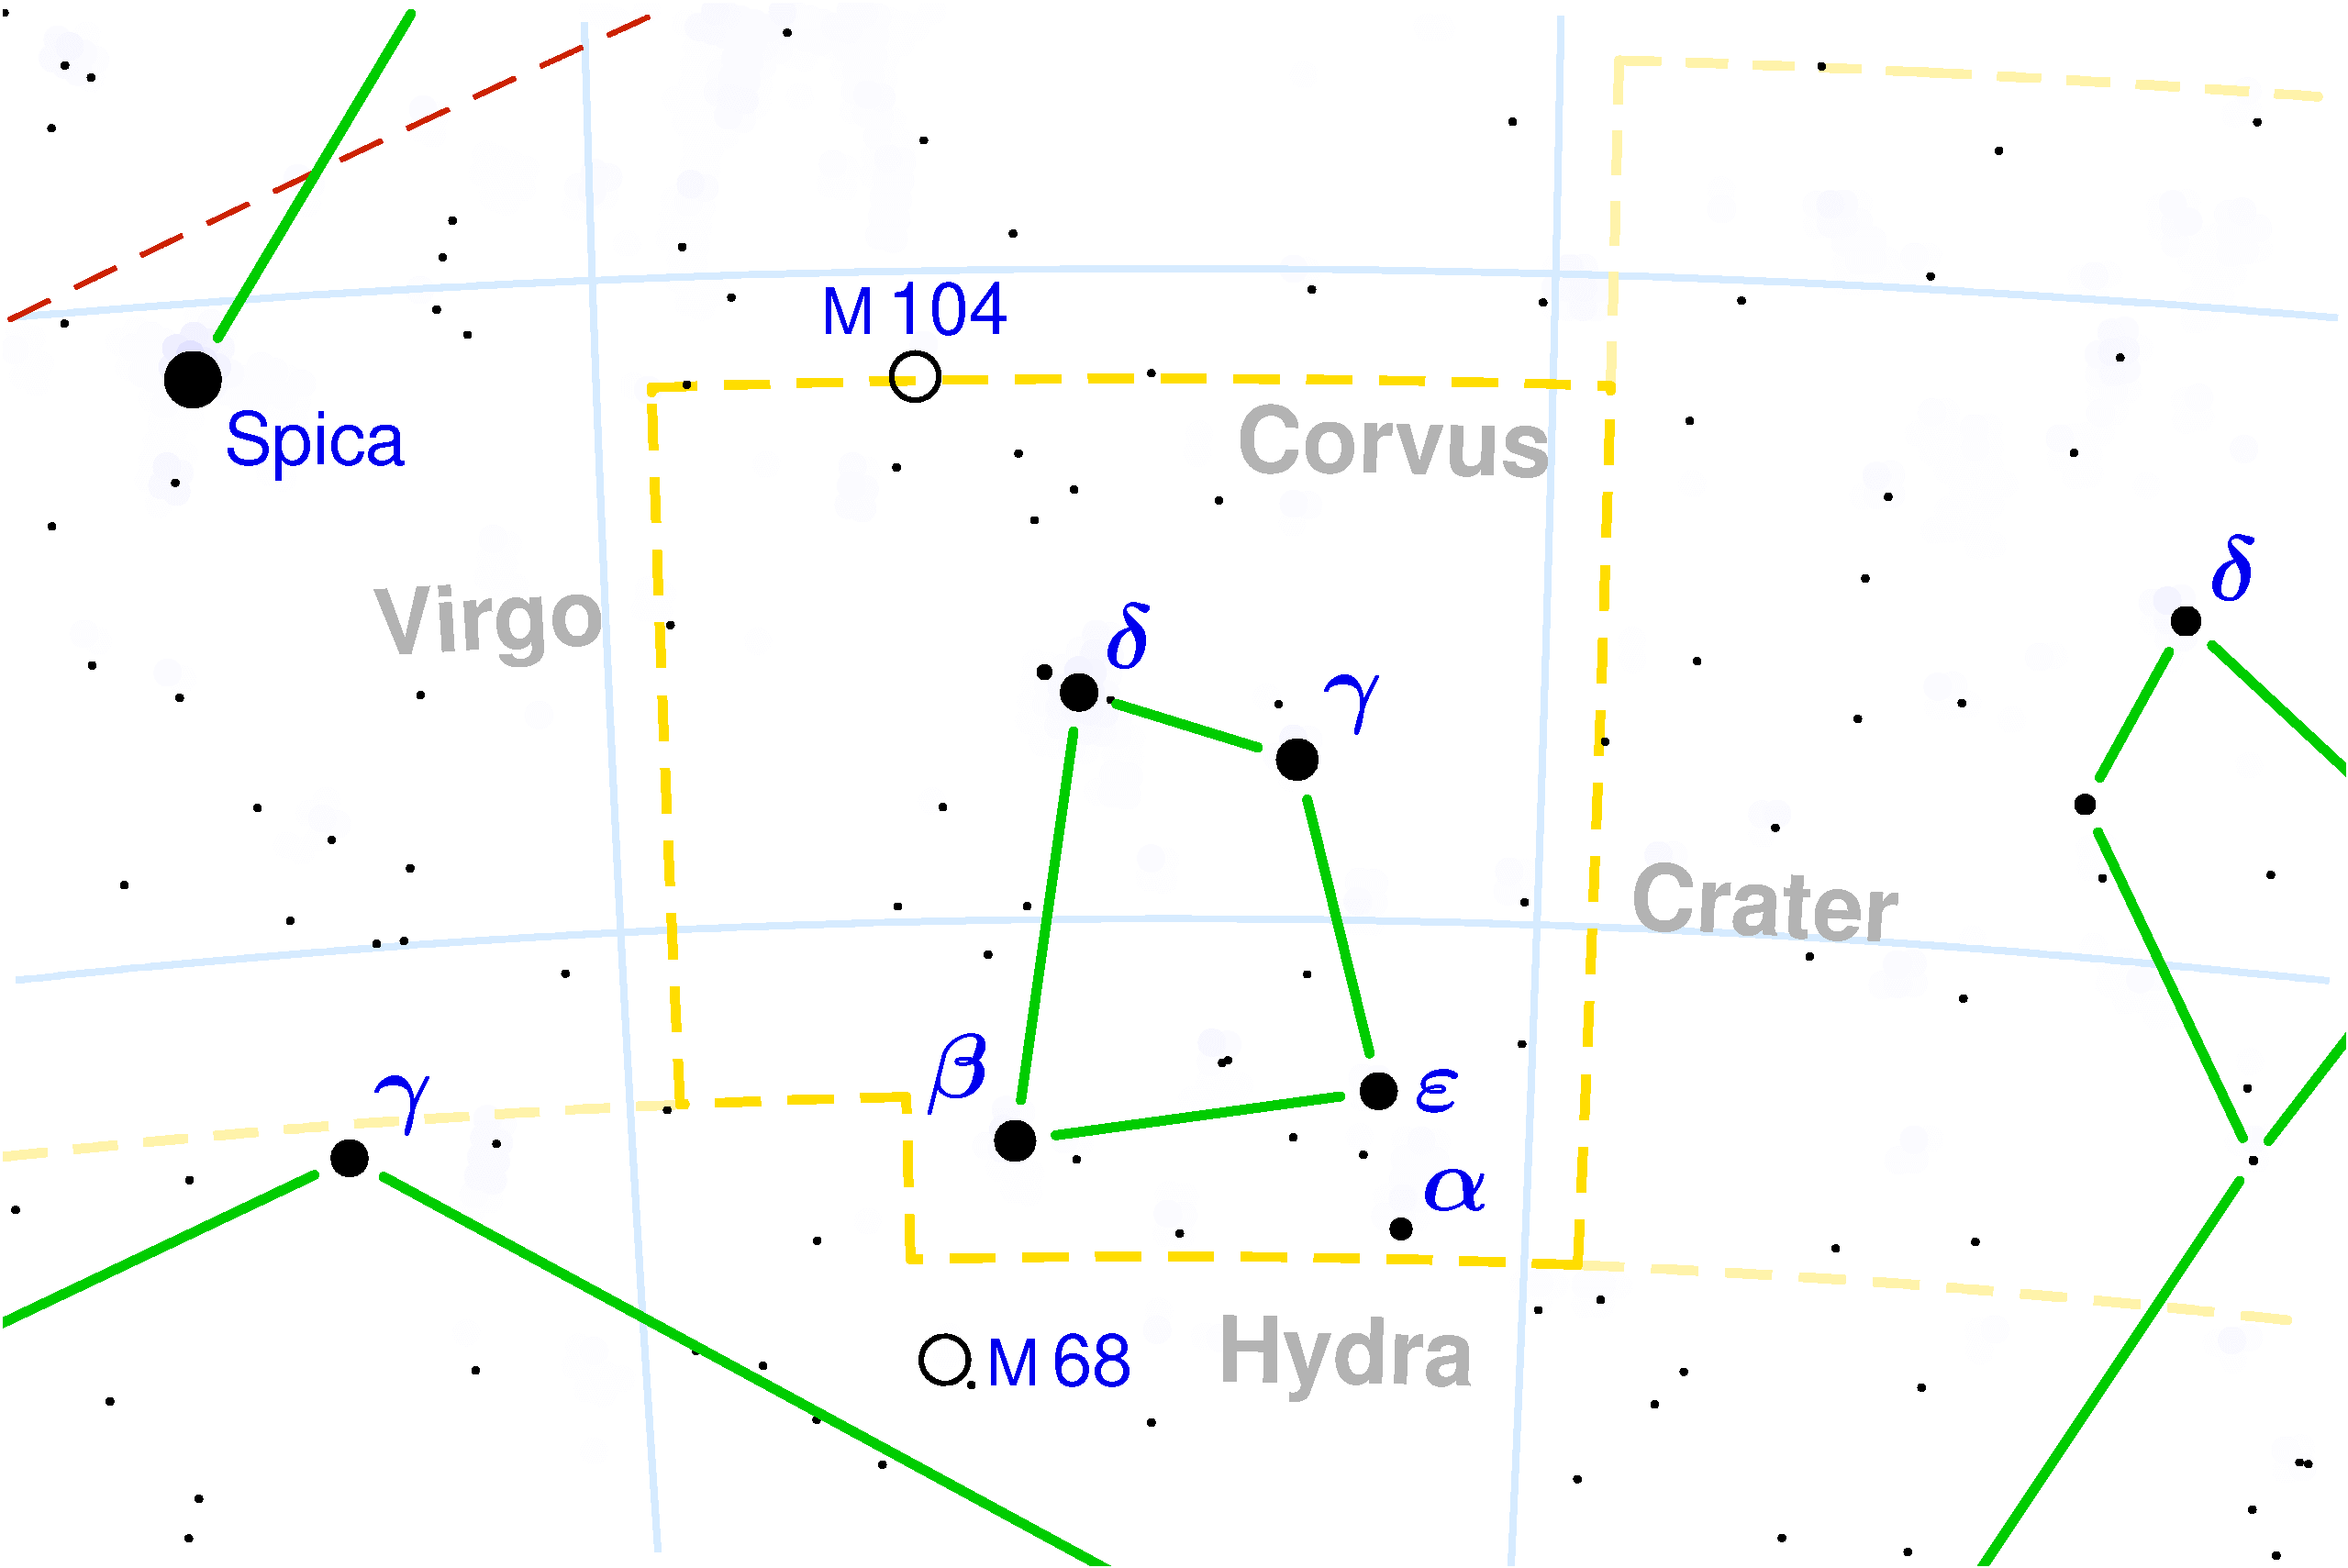
One of these constellation is the Corvus constellation, a southern constellation whose name in Latin means “the Raven”. Bordered by the constellations of Virgo, Crater and Hydra, it is visible at latitudes between +60° and -90° and is best seen at culmination during the month of May. Today, it is one of the 88 modern constellations recognized by the International Astronomical Union (IAU).
Name and Meaning:
In classical mythology, Corvus represents the Raven, and is both a charming and sad tale. Legend tells us that the constellation of Crater is the cup of the gods. This cup belonged to the god of the skies himself, the venerable archer-god Apollo. And who holds this cup, dressed in black? The Raven, Corvus.
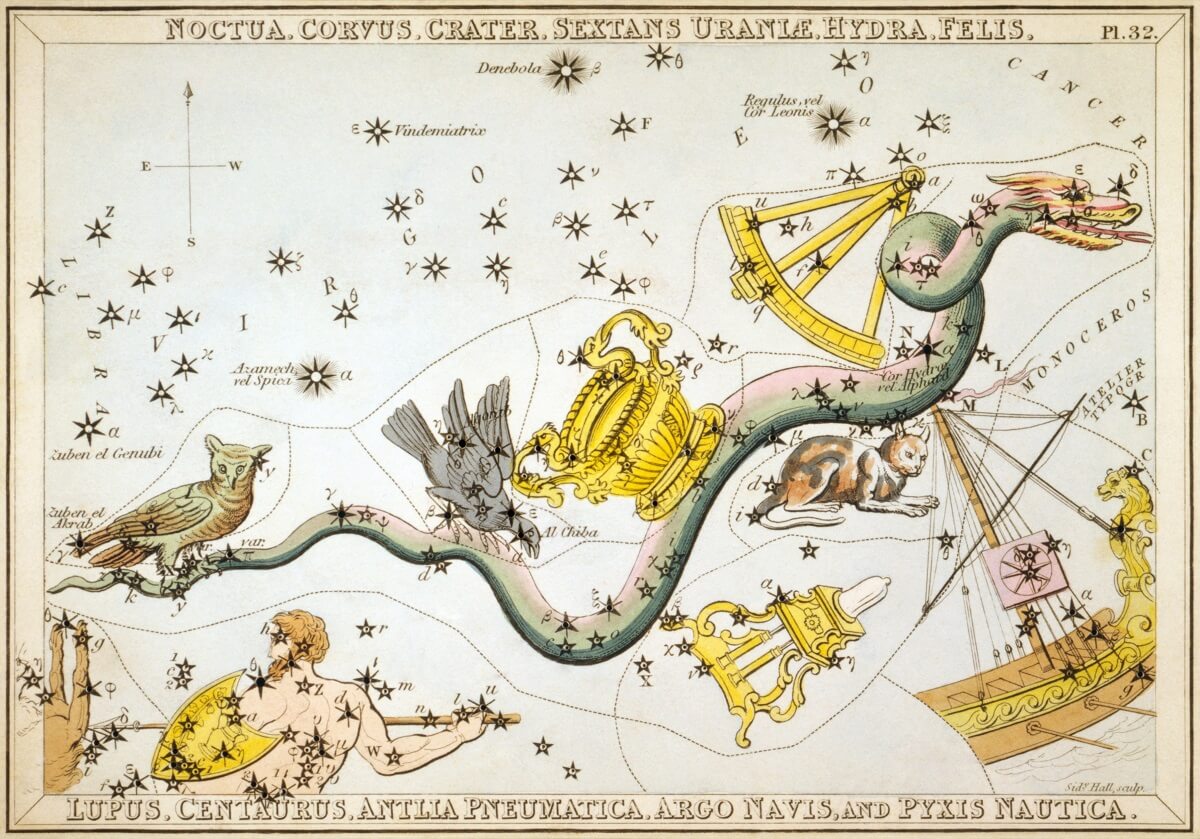
“Noctua, Corvus, Crater, Sextans Uraniæ, Hydra, Felis, Lupus, Centaurus, Antlia Pneumatica, Argo Navis, and Pyxis Nautica”, plate 32 in Urania’s Mirror, by Sidney Hall. Credit: Library of Congress
The story of a creature sent to fetch water for his master, only to stop to eat figs. Corvus tarried too long, waiting on a fig to ripen. When he realized his mistake, the Raven returned to Apollo with his cup and brought along the serpent Hydra in his claws as well, claiming that the snake prevented him from filling the cup.
Realizing his feathered-friend’s lie, Apollo became angry and tossed the cup (Crater), the snake (Hydra) and the raven (Corvus) into the sky, where they became constellations for all eternity. He further punished the raven by making sure the cup would be out of reach, thus ensuring he would forever be thirsty.
History of Observation:
As with most of the 48 constellations recorded by Ptolemy, the Corvus constellation has roots that go back to ancient Mesopotamia. In the Babylonian star catalogues (dated to ca. 1100 BCE), Corvus was called the Babylonian Raven (MUL.UGA.MUSHEN), which sat on the tail of the Serpent – which was associated with Ningishzida, the Babylonian god of the underworld. This constellation was also sacred to the god of rains and storm (Adad).
By about 500 BCE, this constellation was introduced to the Greeks, along with Crater, Hydra, Aquila and Piscis Austrinus constellations. By the 2nd century CE, they were included by Ptolemy in his Almagest, which would remain the definitive source on astronomy and astrology to Medieval European and Islamic astronomers for many centuries.
In Chinese astronomy, the stars that make up Corvus are located within the Vermilion Bird of the South (Nán Fang Zhu Què). The four main stars depict a chariot (Zhen) while Alpha and Eta mark the linchpins for the wheels, and Zeta represents a coffin (Changsha).
In Indian astronomy, the first five stars in Corvus correspond to the Hast nakshatra – a lunar zodiacal constellation. This is one of is one of the 27 or 28 divisions of the sky, identified by the prominent stars in them, that the Moon passes through during its monthly cycle. While it is Hindu, it is still very similar to the divisions of the ecliptic plane referred to as the zodiac. The Moon takes approximately one day to pass through each nakshatra.
Notable Objects:
This small, box-like asterism has no bright star and consists of 11 stars which are visible to the unaided eye, yet Ptolemy only listed 7! There are 4 main stars and 10 which have Bayer/Flamsteed designations. For unaided eye observers, the Delta, Gamma, Epsilon and Beta (what appears to look like a figure 8, Y, E and B on the map) form an asterism that looks like a “sail”, and when connected seem to point to the bright star Spica.
The brightest star in Corvus is not even its alpha, but is Gamma Corvi. This giant star (which is thought to be a binary system) is located approximately 165 light years from Earth and is also known as Gienah, which comes from the Arabic phrase al-janah al-ghirab al-yaman (“the right wing of the crow”).
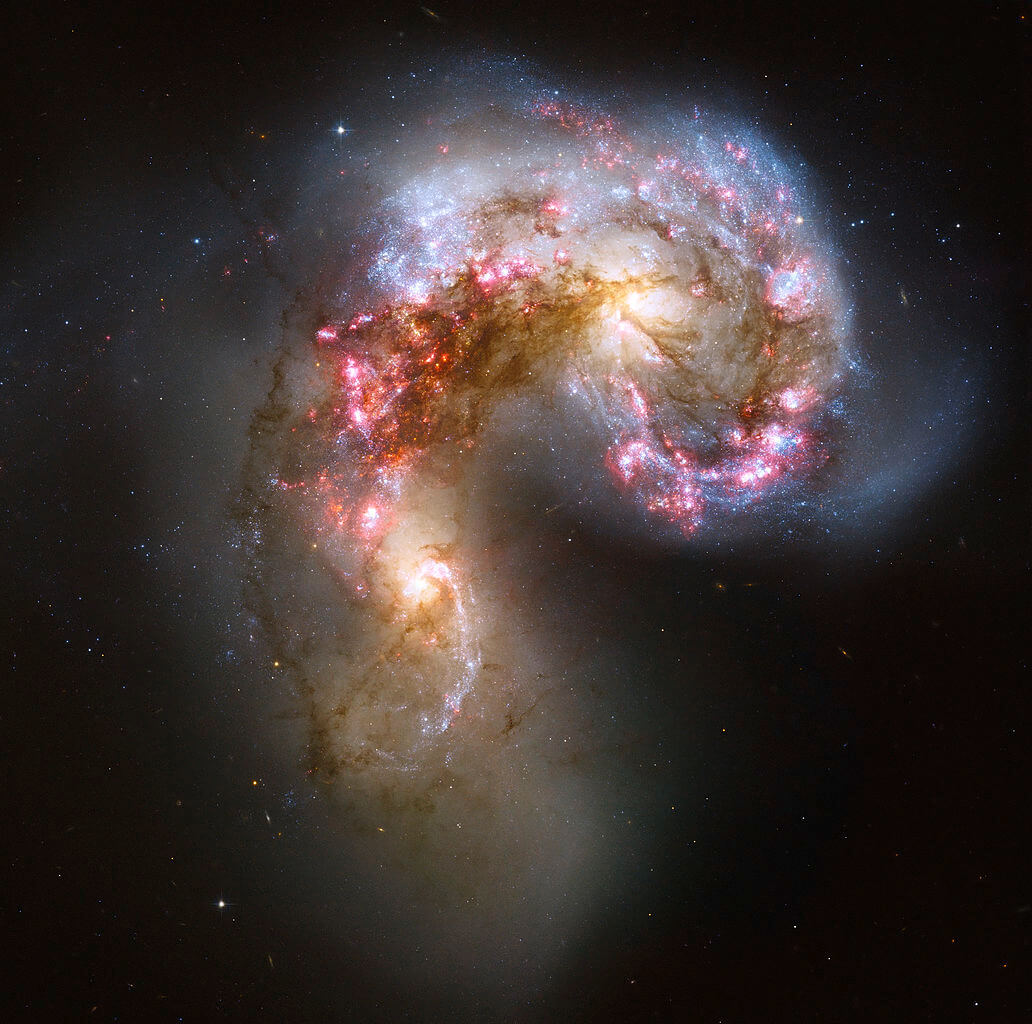
Antennae Galaxies – NGC 4038, NGC 4039. Credit: NASA, ESA, and the Hubble Heritage Team (STScI, AURA)-ESA, Hubble Collaboration
The second-brightest star, Beta Corvi, is a yellow-white G-type bright giant that is located about 140 light years from Earth. Its proper name, Kraz, was assigned to it in modern times, but the origin of the name is uncertain. Delta Corvi is a class A0 star in Corvus located approximately 87 light years distant from Earth whose traditional name (Algorab) comes from the Arabic word al-ghuraab – which means “the crow.”
Epsilon Corvi is a K2 III class star that is approximately 303 light-years from Earth. The star’s traditional name, (Minkar) comes from the Arabic word almánxar, which means “the nostril of the crow.” Alpha Corvi, which is only the fifth brightest star in the constellation, is a class F0 dwarf or subdwarf that is only 48.2 light years distant. The star’s traditional name (Alchiba) is derived from the Arabic al hibaa, which means “tent.”
Corvus is also home to many Deep Sky Objects. These include the Antennae Galaxies (NGC 4038/NGC 4039), a pair of interacting galaxies that were first discovered in the late 18th century. These colliding galaxies – which are located 45 million light years from Earth – are currently in the starburst stage, meaning they are experiencing an exceptionally high rate of star forming activity.
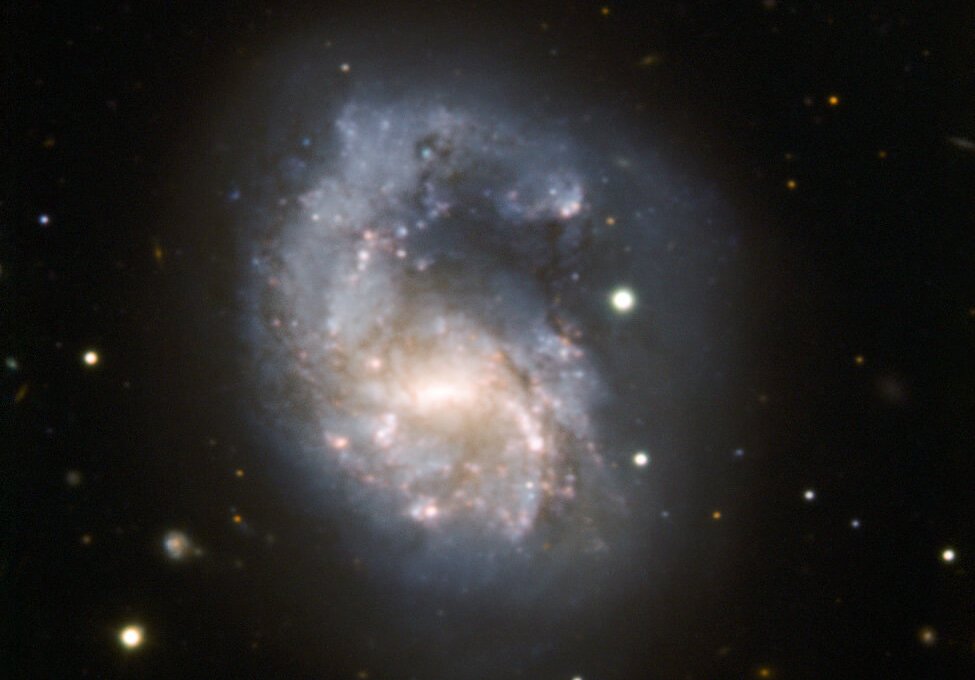
There’s also the NGC 4027 barred spiral galaxy, which is located about 83 million light years from Earth. This galaxy is peculiar, in that one of its spiral arm extends further than the other – possibly due to a past collision with another galaxy. Finally, there’s the large planetary nebula known as NGC 4361, which is located at the center of the constellation and resembled a faint elliptical galaxy.
The barred, spiral galaxy known as NGC 4027. Credit : ESO
Finding Corvus:
Let’s start with binoculars and look down at the southern corner, where we will find Alpha Corvi – aka. Alchiba. Alchiba belongs to the spectral class F0 and has apparent magnitude +4.00. This star is suspected of being a spectroscopic binary, although this has not yet been confirmed. Now take a look at Beta Corvi – aka. Kraz. Good old Kraz is approximately 140 light-years away and is a G-type bright giant star whose apparent visual magnitude varies between 2.60 and 2.66.
Head west and look at Epsilon. Although it doesn’t look any further away, spectral class K2 III – Minkar – is 303 light-years from Earth! Need a smile? Then take a look at Gamma, aka. Geinah. How about Delta? Algorab is a spectral class A0 and is about 87 light years from our solar system.
Now get out your telescope as we explore planetary nebula, NGC 4361 (RA 12 24 5 Dec -18 48). At around magnitude 10, this greenish disc is fairly easily spotted with smaller telescopes, but the 13th stellar magnitude central star requires larger aperture to be seen. It has a very symmetrical shape that is similar to a spiral galaxy.
For galaxy fans, have a look at interacting galaxy pair, NGC 4038 and NGC 4039 – the “Ringtail Galaxy” (RA 12 01 53 Dec -18 52-3). This peculiar galaxy (also referred to as the “Antennae Galaxies”) were both discovered by Friedrich Wilhelm Herschel in 1785. Even in relatively small telescopes, you can see two long tails of stars, gas and dust thrown out of the galaxies as a result of the collision that resemble the antennae of an insect.
Map of the Corvus Constellation. Credit: IAU and Sky&Telescope magazine
“The morphology of this object is complex given the highly filamentary structure of the envelope, which is confirmed to possess a low mass. The halo has a high expansion velocity that yields incompatible kinematic and evolutionary ages, unless previous acceleration of the nebular expansion is considered. However, the most remarkable result from the present observations is the detection of a bipolar outflow in NGC 4361, which is unexpected in a PN with a Population II low-mass-core progenitor. It is shown that shocks resulting from the interaction of the bipolar outflow with the outer shell are able to provide an additional heating source in this nebula.”
Most galaxies probably undergo at least one significant collision in their lifetimes. This is likely the future of our Milky Way when it collides with the Andromeda Galaxy. Two supernovae have been discovered in the galaxy: SN 2004GT and SN 2007sr. A recent study finds that these interacting galaxies are closer to the Milky Way than previously thought – at 45 million light-years instead of 65 million light-years. Geez… What’s 20 million light years between friends?
The Milky Way is an extremely big place. Measured from end to end, our galaxy in an estimated 100,000 to 180,000 light years (31,000 – 55,000 parsecs) in diameter. And it is extremely well-populated, with an estimated 100 to 400 million stars contained within. And according to recent estimates, it is believed that there are as many as 100 billion planets in the Milky Way. And our galaxy is merely one of trillions within the Universe.
So if we were to break it down, just how much matter would we find out there? Estimating how much there is overall would involve some serious math and incredible figures. But what about a single light year? As the most commonly-used unit for measuring the distances between stars and galaxies, determining how much stuff can be found within a single light year (on average) is a good way to get an idea of how stuff is out there.
Light Year:
Even though the name is a little confusing, you probably already know that a light year is the distance that light travels in the space of a year. Given that the speed of light has been measured to 299,792, 458 m/s (1080 million km/h; 671 million mph), the distance light travels in a single year is quite immense. All told, a single light year works out to 9,460,730,472,580.8 kilometers (5,878,625,373,183.6 mi).
Diagram showing the distance light travels between the Sun and the Earth. Credit: Wikipedia Commons/Brews ohare
So to determine how much stuff is in a light year, we need to take that distance and turn it into a cube, with each side measuring one light year in length. Imagine that giant volume of space (a little challenging for some of us to get our heads around) and imagine just how much “stuff” would be in there. And not just “stuff”, in the sense of dust, gas, stars or planets, either. How much nothing is in there, as in, the empty vacuum of space?
There is an answer, but it all depends on where you put your giant cube. Measure it at the core of the galaxy, and there are stars buzzing around all over the place. Perhaps in the heart of a globular cluster? In a star forming nebula? Or maybe out in the suburbs of the Milky Way? There’s also great voids that exist between galaxies, where there’s almost nothing.
Density of the Milky Way:
There’s no getting around the math in this one. First, let’s figure out an average density for the Milky Way and then go from there. Its about 100,000 to 180,000 light-years across and 1000 light-years thick. According to my buddy and famed astronomer Phil Plait (of Bad Astronomy), the total volume of the Milky Way is about 8 trillion cubic light-years.
And the total mass of the Milky Way is 6 x 1042 kilograms (that’s 6,000 trillion trillion trillion metric tons or 6,610 trillion trillion trillion US tons). Divide those together and you get 8 x 1029 kilograms (800 trillion trillion metric tons or 881.85 trillion trillion US tons) per light year. That’s an 8 followed by 29 zeros. This sounds like a lot, but its actually the equivalent of 0.4 Solar Masses – 40% of the mass of our Sun.
Millions of glowing stars from the brightest part of the Milky Way — a region so dense with stars that barely any dark sky is seen across the picture. Credit: ESO
In other words, on average, across the Milky Way, there’s about 40% the mass of the Sun in every cubic light year. But in an average cubic meter, there’s only about 950 attograms, which is almost one femtogram (a quadrillionth of a gram of matter), which is pretty close to nothing. Compare this to air, which has more than a kilogram of mass per cubic meter.
To be fair, in the densest regions of the Milky Way – like inside globular clusters – you can get densities of stars with 100, or even 1000 times greater than our region of the galaxy. Stars can get as close together as the radius of the Solar System. But out in the vast interstellar gulfs between stars, the density drops significantly. There are only a few hundred individual atoms per cubic meter in interstellar space.
And in the intergalactic voids; the gulfs between galaxies, there are just a handful of atoms per meter. Like it or not, much of the Universe is pretty close to being empty space, with just trace amounts of dust or gas particles to be found between all the stars, galaxies, clusters and super clusters.
So how much stuff is there in a light year? It all depends on where you look, but if you spread all the matter around by shaking the Universe up like a snow globe, the answer is very close to nothing.
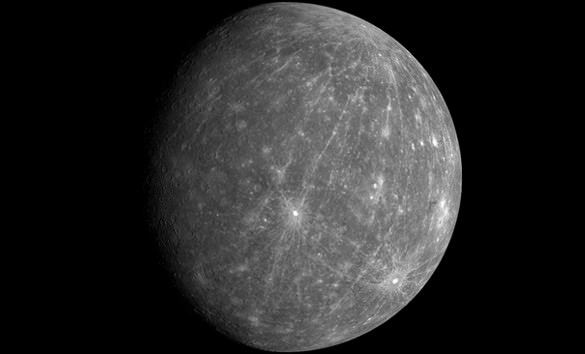
Mercury and Earth, size comparison. Credit: NASA / APL (from MESSENGER)
Mercury was appropriately named after the Roman messenger of the Gods. This is owed to the fact that its apparent motion in the night sky was faster than that of any of the other planets. As astronomers learned more about this “messenger planet”, they came to understand that its motion was due to its close orbit to the Sun, which causes it to complete a single orbit every 88 days.
Mercury’s proximity to the Sun is merely one of its defining characteristics. Compared to the other planets of the Solar System, it experiences severe temperature variations, going from very hot to very cold. It’s also very rocky, and has no atmosphere to speak of. But to truly get a sense of how Mercury stacks up compared to the other planets of the Solar System, we need to a look at how Mercury compares to Earth.
Size, Mass and Orbit:
The diameter of Mercury is 4,879 km, which is approximately 38% the diameter of Earth. In other words, if you put three Mercurys side by side, they would be a little larger than the Earth from end to end. While this makes Mercury smaller than the largest natural satellites in our system – such as Ganymede and Titan – it is more massive and far more dense than they are.
Mercury, as imaged by the MESSENGER spacecraft, revealing parts of the never seen by human eyes. Image Credit: NASA/JHUAPL/Carnegie Institution of Washington
In fact, Mercury’s mass is approximately 3.3 x 10²³ kg (5.5% the mass of Earth) which means that its density – at 5.427 g/cm3 – is the second highest of any planet in the Solar System, only slightly less than Earth’s (5.515 g/cm3). This also means that Mercury’s surface gravity is 3.7 m/s2, which is the equivalent of 38% of Earth’s gravity (0.38 g). This means that if you weighed 100 kg (220 lbs) on Earth, you would weigh 38 kg (84 lbs) on Mercury.
Meanwhile, the surface area of Mercury is 75 million square kilometers, which is approximately 10% the surface area of Earth. If you could unwrap Mercury, it would be almost twice the area of Asia (44 million square km). And the volume of Mercury is 6.1 x 10¹⁰ km3, which works out to 5.4% the volume of Earth. In other words, you could fit Mercury inside Earth 18 times over and still have a bit of room to spare.
In terms of orbit, Mercury and Earth probably could not be more different. For one, Mercury has the most eccentric orbit of any planet in the Solar System (0.205), compared to Earth’s 0.0167. Because of this, its distance from the Sun varies between 46 million km (29 million mi) at its closest (perihelion) to 70 million km (43 million mi) at its farthest (aphelion).
This puts Mercury much closer to the Sun than Earth, which orbits at an average distance of 149,598,023 km (92,955,902 mi), or 1 AU. This distance ranges from 147,095,000 km (91,401,000 mi) to 152,100,000 km (94,500,000 mi) – 0.98 to 1.017 AU. And with an average orbital velocity of 47.362 km/s (29.429 mi/s), it takes Mercury a total 87.969 Earth days to complete a single orbit – compared to Earth’s 365.25 days.
The Orbit of Mercury during the year 2006. Credit: Wikipedia Commons/Eurocommuter
However, since Mercury also takes 58.646 days to complete a single rotation, it takes 176 Earth days for the Sun to return to the same place in the sky (aka. a solar day). So on Mercury, a single day is twice as long as a single year. Meanwhile on Earth, a single solar day is 24 hours long, owing to its rapid rotation of 1674.4 km/h. Mercury also has the lowest axial tilt of any planet in the Solar System – approximately 0.027°, compared to Earth’s 23.439°.
Structure and Composition:
Much like Earth, Mercury is a terrestrial planet, which means it is composed of silicate minerals and metals that are differentiated between a solid metal core and a silicate crust and mantle. For Mercury, the breakdown of these elements is higher than Earth. Whereas Earth is primarily composed of silicate minerals, Mercury is composed of 70% metallic and 30% of silicate materials.
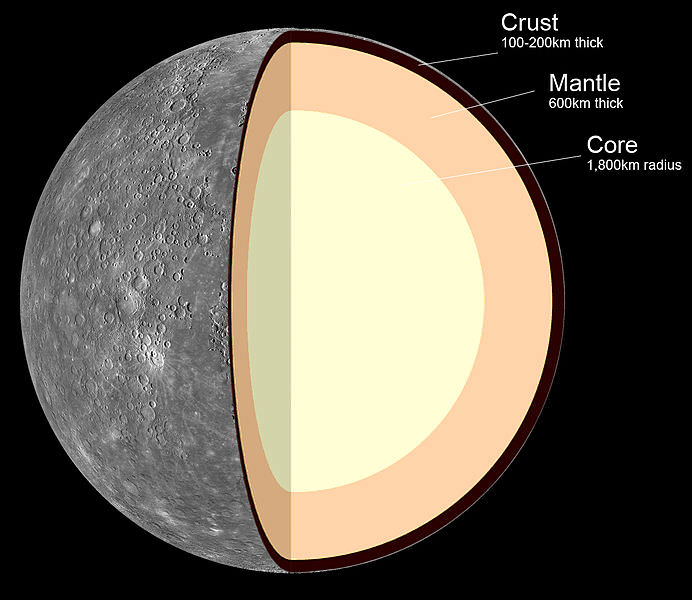
Also like Earth, Mercury’s interior is believed to be composed of a molten iron that is surrounded by a mantle of silicate material. Mercury’s core, mantle and crust measure 1,800 km, 600 km, and 100-300 km thick, respectively; while Earth’s core, mantle and crust measure 3478 km, 2800 km, and up to 100 km thick, respectively.
What’s more, geologists estimate that Mercury’s core occupies about 42% of its volume (compared to Earth’s 17%) and the core has a higher iron content than that of any other major planet in the Solar System. Several theories have been proposed to explain this, the most widely accepted being that Mercury was once a larger planet that was struck by a planetesimal that stripped away much of the original crust and mantle.
Internal structure of Mercury: 1. Crust: 100–300 km thick 2. Mantle: 600 km thick 3. Core: 1,800 km radius. Credit: MASA/JPL
Surface Features:
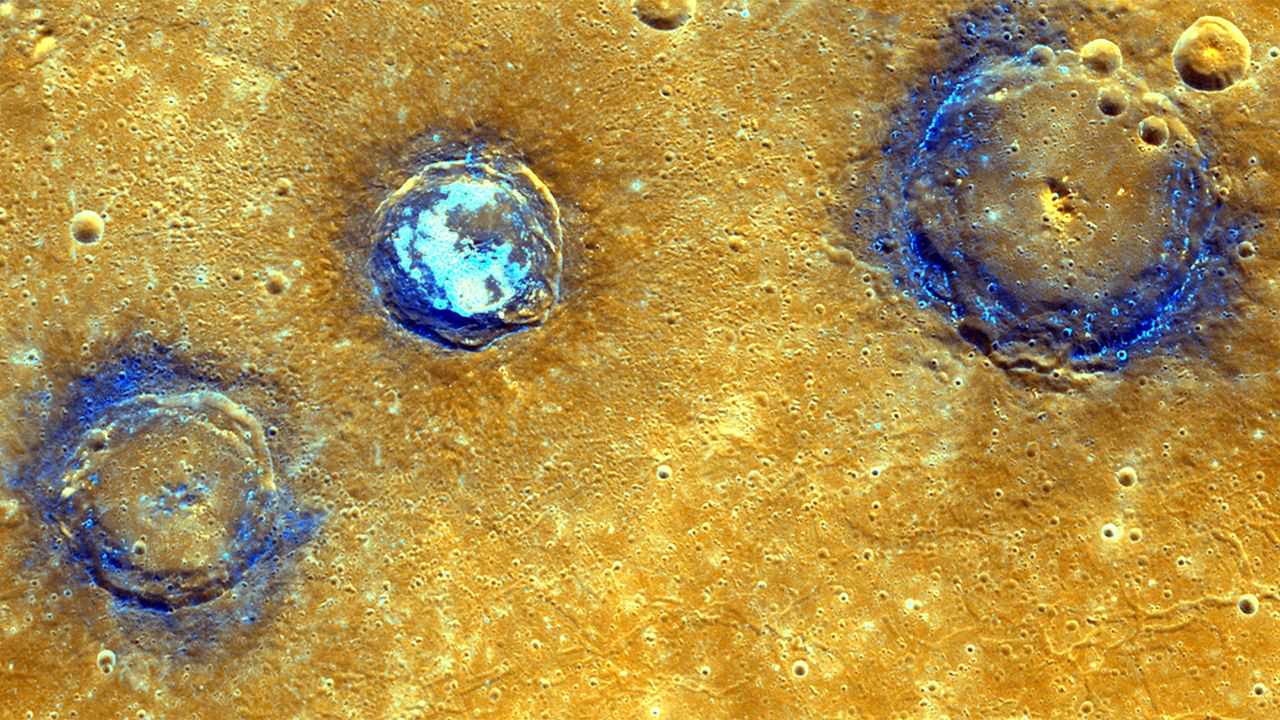
In terms of its surface, Mercury is much more like the Moon than Earth. It has a dry landscape pockmarked by asteroid impact craters and ancient lava flows. Combined with extensive plains, these indicate that the planet has been geologically inactive for billions of years.
Names for these features come from a variety of sources. Craters are named for artists, musicians, painters, and authors; ridges are named for scientists; depressions are named after works of architecture; mountains are named for the word “hot” in different languages; planes are named for Mercury in various languages; escarpments are named for ships of scientific expeditions, and valleys are named after radio telescope facilities.
During and following its formation 4.6 billion years ago, Mercury was heavily bombarded by comets and asteroids, and perhaps again during the Late Heavy Bombardment period. Due to its lack of an atmosphere and precipitation, these craters remain intact billions of years later. Craters on Mercury range in diameter from small bowl-shaped cavities to multi-ringed impact basins hundreds of kilometers across.
The largest known crater is Caloris Basin, which measures 1,550 km (963 mi) in diameter. The impact that created it was so powerful that it caused lava eruptions on the other side of the planet and left a concentric ring over 2 km (1.24 mi) tall surrounding the impact crater. Overall, about 15 impact basins have been identified on those parts of Mercury that have been surveyed.
Enhanced-color image of Munch, Sander and Poe craters amid volcanic plains (orange) near Caloris Basin. Credit: NASA/JHUAPL/Carnegie Institution of Washington
Earth’s surface, meanwhile, is significantly different. For starters, 70% of the surface is covered in oceans while the areas where the Earth’s crust rises above sea level forms the continents. Both above and below sea level, there are mountainous features, volcanoes, scarps (trenches), canyons, plateaus, and abyssal plains. The remaining portions of the surface are covered by mountains, deserts, plains, plateaus, and other landforms.
Mercury’s surface shows many signs of being geologically active in the past, mainly in the form of narrow ridges that extend up to hundreds of kilometers in length. It is believed that these were formed as Mercury’s core and mantle cooled and contracted at a time when the crust had already solidified. However, geological activity ceased billions of years ago and its crust has been solid ever since.
Meanwhile, Earth is still geologically active, owning to convection of the mantle. The lithosphere (the crust and upper layer of the mantle) is broken into pieces called tectonic plates. These plates move in relation to one another and interactions between them is what causes earthquakes, volcanic activity (such as the “Pacific Ring of Fire“), mountain-building, and oceanic trench formation.
Atmosphere and Temperature:
When it comes to their atmospheres, Earth and Mercury could not be more different. Earth has a dense atmosphere composed of five main layers – the Troposphere, the Stratosphere, the Mesosphere, the Thermosphere, and the Exosphere. Earth’s atmosphere is also primarily composed of nitrogen (78%) and oxygen (21%) with trace concentrations of water vapor, carbon dioxide, and other gaseous molecules.
The Fast Imaging Plasma Spectrometer on board MESSENGER has found that the solar wind is able to bear down on Mercury enough to blast particles from its surface into its wispy atmosphere. Credit: Shannon Kohlitz, Media Academica, LLC
Because of this, the average surface temperature on Earth is approximately 14°C, with plenty of variation due to geographical region, elevation, and time of year. The hottest temperature ever recorded on Earth was 70.7°C (159°F) in the Lut Desert of Iran, while the coldest temperature was -89.2°C (-129°F) at the Soviet Vostok Station on the Antarctic Plateau.
Mercury, meanwhile, has a tenuous and variable exosphere that is made up of hydrogen, helium, oxygen, sodium, calcium, potassium and water vapor, with a combined pressure level of about 10-14 bar (one-quadrillionth of Earth’s atmospheric pressure). It is believed this exosphere was formed from particles captured from the Sun, volcanic outgassing and debris kicked into orbit by micrometeorite impacts.
Because it lacks a viable atmosphere, Mercury has no way to retain the heat from the Sun. As a result of this and its high eccentricity, the planet experiences far more extreme variations in temperature than Earth does. Whereas the side that faces the Sun can reach temperatures of up to 700 K (427° C), the side that is in darkness can reach temperatures as low as 100 K (-173° C).
Despite these highs in temperature, the existence of water ice and even organic molecules has been confirmed on Mercury’s surface. The floors of deep craters at the poles are never exposed to direct sunlight, and temperatures there remain below the planetary average. In this respect, Mercury and Earth have something else in common, which is the presence of water ice in its polar regions.
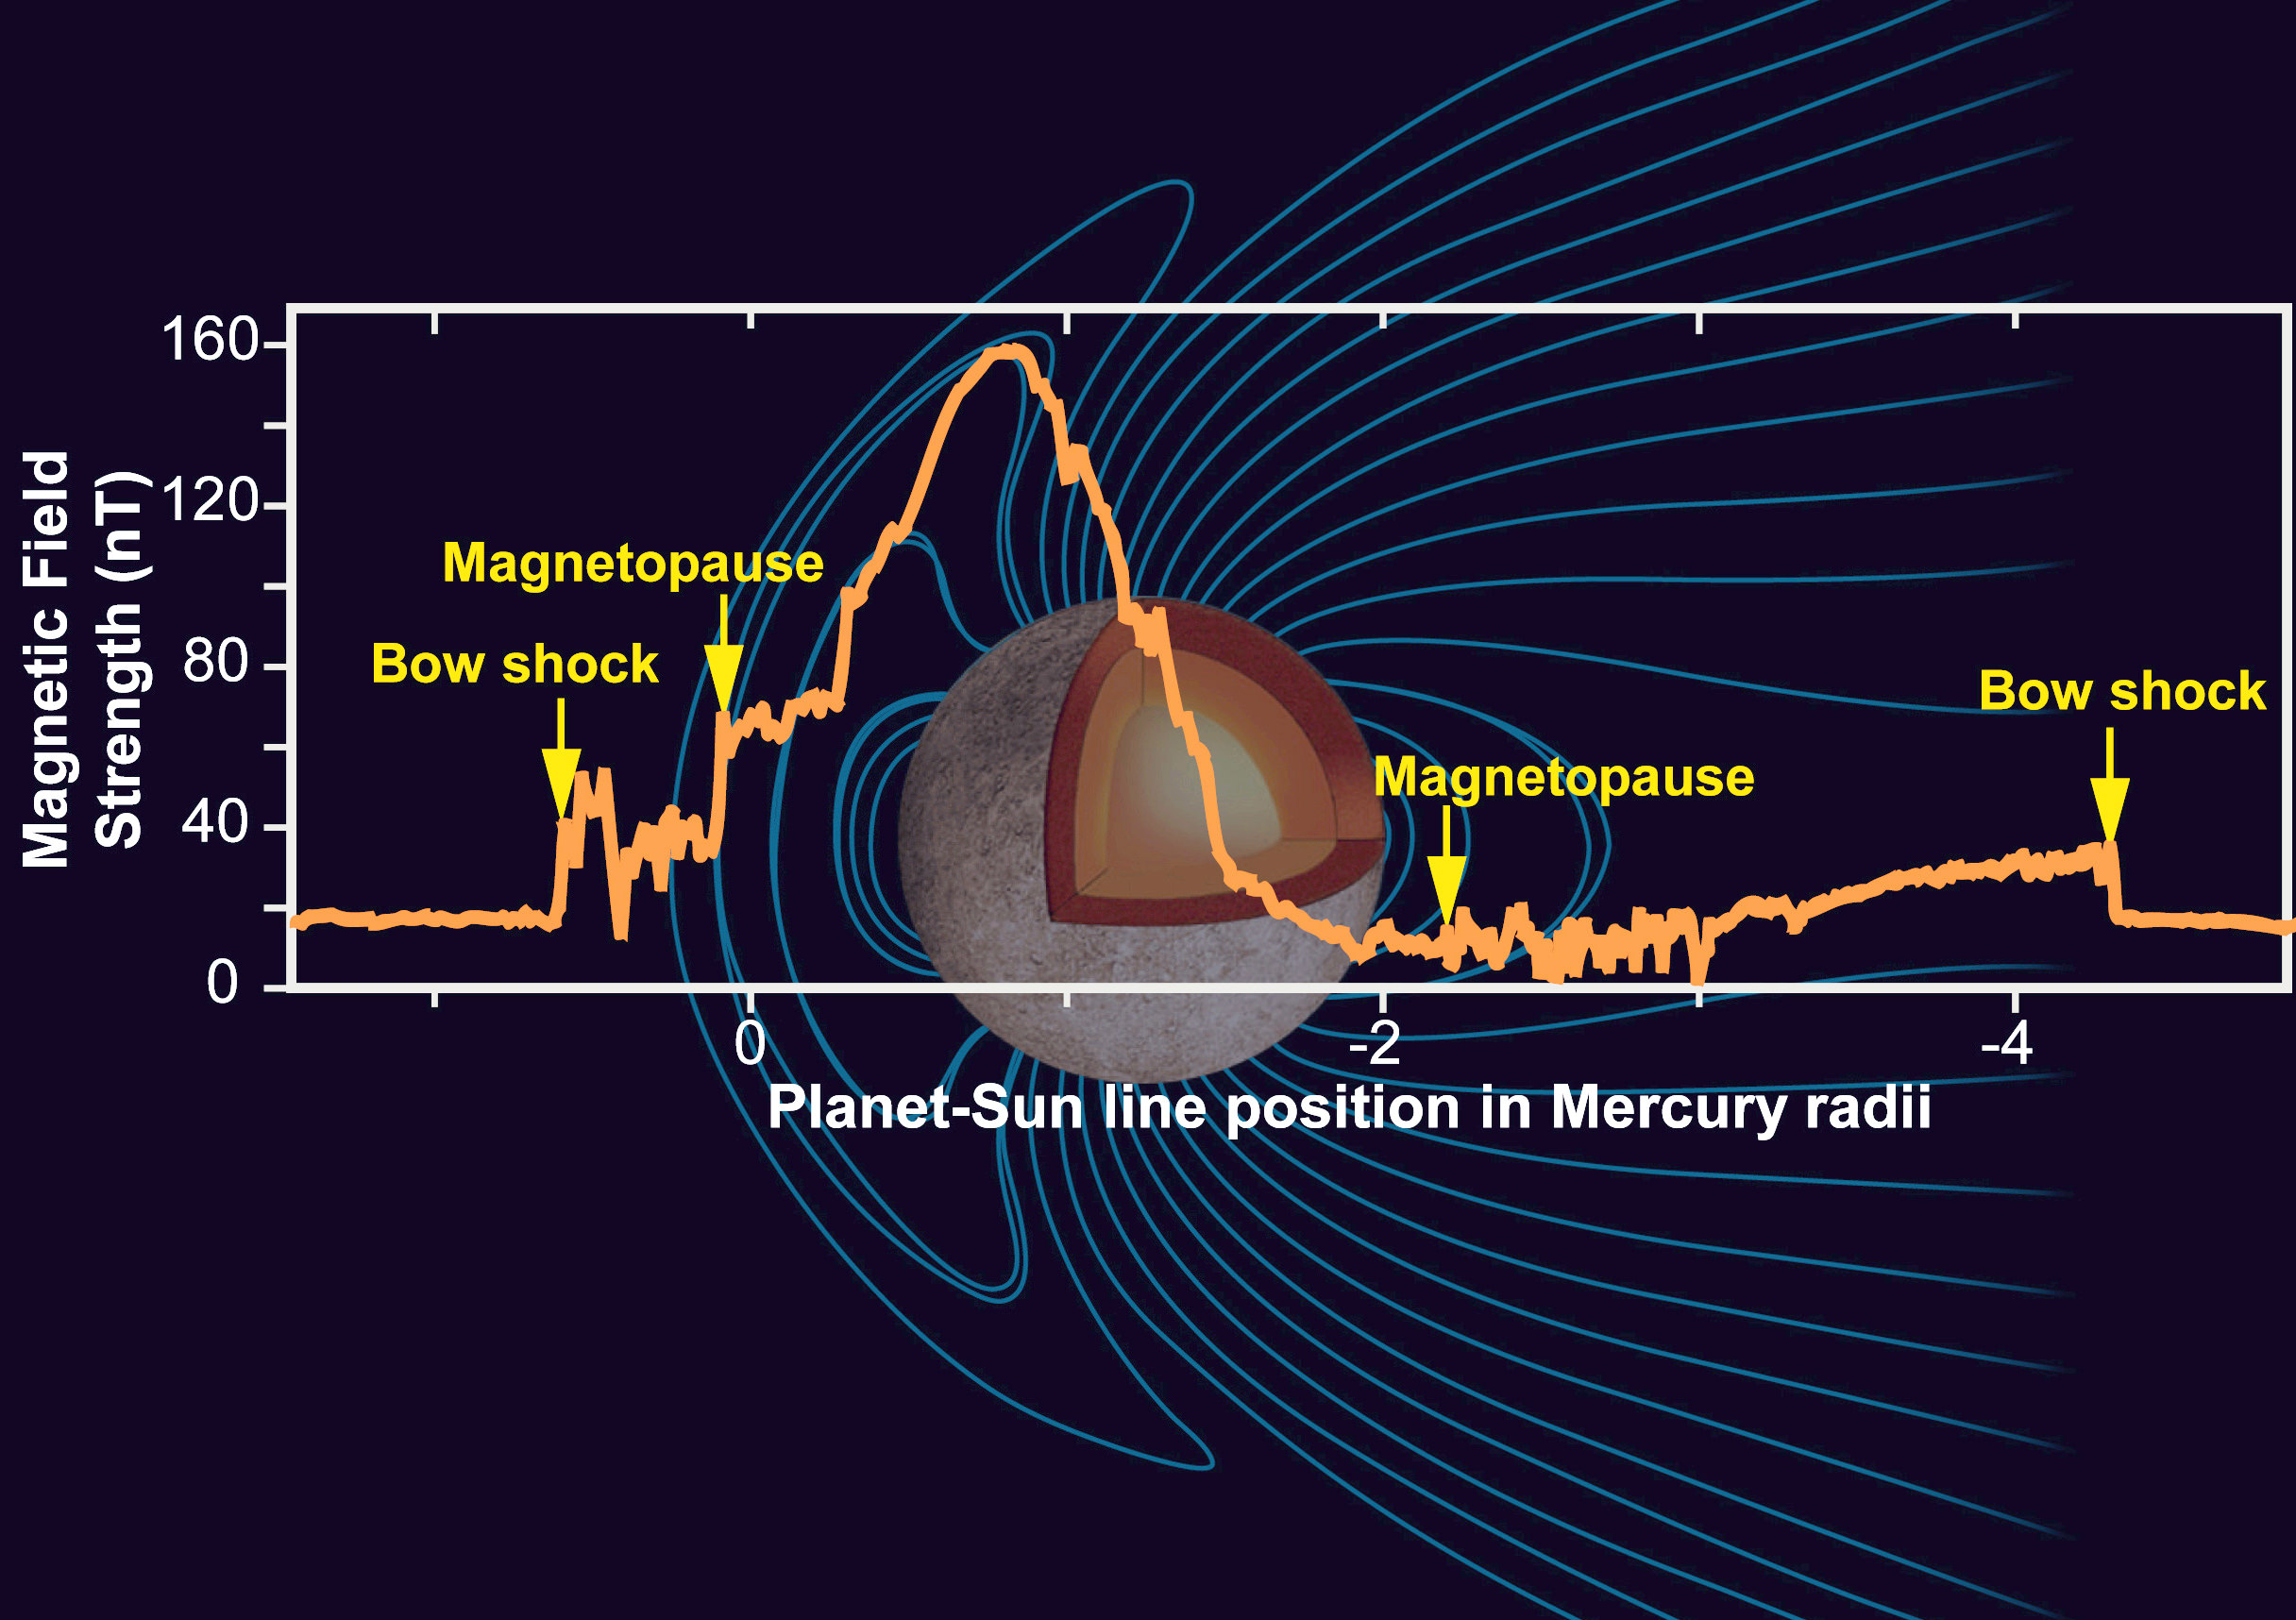
Mercury’s Magnetic Field. Credit: NASA
Magnetic Fields:
Much like Earth, Mercury has a significant, and apparently global, magnetic field, one which is about 1.1% the strength of Earth’s. It is likely that this magnetic field is generated by a dynamo effect, in a manner similar to the magnetic field of Earth. This dynamo effect would result from the circulation of the planet’s iron-rich liquid core.
Mercury’s magnetic field is strong enough to deflect the solar wind around the planet, thus creating a magnetosphere. The planet’s magnetosphere, though small enough to fit within Earth, is strong enough to trap solar wind plasma, which contributes to the space weathering of the planet’s surface.
All told, Mercury and Earth are in stark contrast. While both are terrestrial in nature, Mercury is significantly smaller and less massive than Earth, though it has a similar density. Mercury’s composition is also much more metallic than that of Earth, and its 3:2 orbital resonance results in a single day being twice as long as a year.
But perhaps most stark of all are the extremes in temperature variations that Mercury goes through compared to Earth. Naturally, this is due to the fact that Mercury orbits much closer to the Sun than the Earth does and has no atmosphere to speak of. And its long days and long nights also mean that one side is constantly being baked by the Sun, or in freezing darkness.
Diagram showing the distance light travels between the Sun and the Earth. Credit: Wikipedia Commons/Brews ohare
The Universe is an extremely big place. As astronomers looked farther into space over the centuries, and deeper into the past, they came to understand just how small and insignificant our planet and our species seem by comparison. At the same time, ongoing investigations into electromagnetism and distant stars led scientists to deduce what the the speed of light is – and that it is the fastest speed obtainable.
As such, astronomers have taken to using the the distance light travels within a single year (aka. a light year) to measure distances on the interstellar and intergalactic scale. But how far does light travel in a year? Basically, it moves at a speed of 299,792,458 meters per second (1080 million km/hour; 671 million mph), which works out to about 9,460.5 trillion km (5,878.5 trillion miles) per year.
The Speed of Light:
Calculating the speed of light has been a preoccupation for scientists for many centuries. And prior to the 17th century, there was disagreement over whether the speed of light was finite, or if it moved from one spot to the next instantaneously. In 1676, Danish astronomer Ole Romer settled the argument when his observations of the apparent motion of Jupiter’s moon Io revealed that the speed of light was finite.
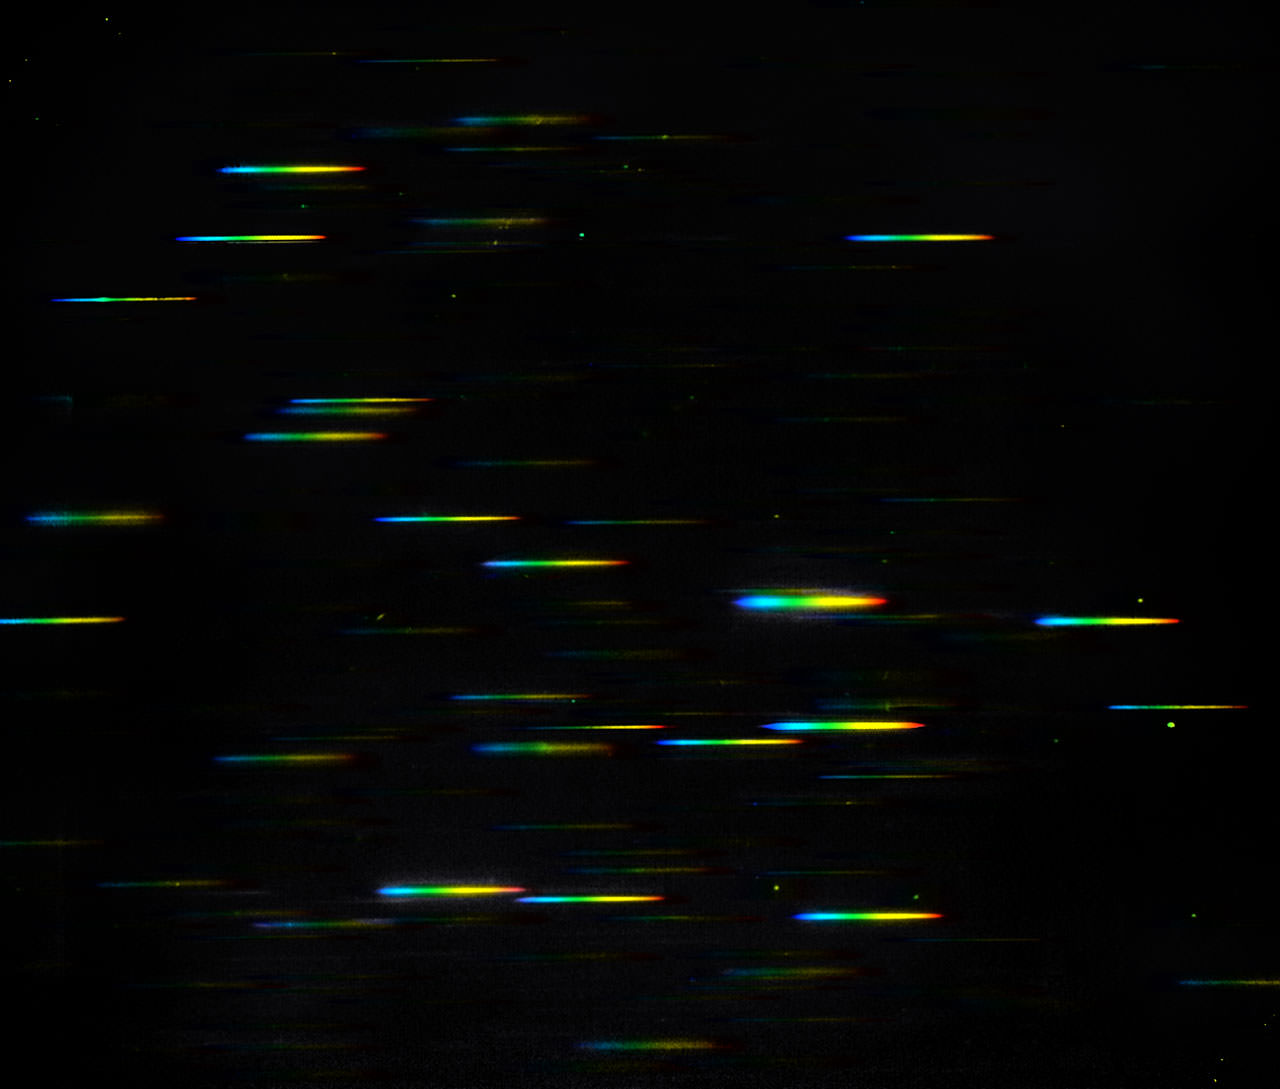
Light moves at different wavelengths, represented here by the different colors seen in a prism. Credit: NASA/ESA
From his observations, famed Dutch astronomer Christiaan Huygens calculated the speed of light at 220,000 km/s (136,701 mi/s). Over the course of the nest two centuries, the speed of light was refined further and further, producing estimates that ranged from about 299,000 to 315,000 km/s (185,790 to 195,732 mi/s).
This was followed by James Clerk Maxwell, who proposed in 1865 that light was an electromagnetic wave. In his theory of electromagnetism, the speed of light was represented as c. And then in 1905, Albert Einstein proposed his theory of Special Relativity, which postulated that the speed of light (c) was constant, regardless of the inertial reference frame of the observer or the motion of the light source.
By 1975, after centuries of refined measurements, the speed of light in a vacuum was calculated at 299,792,458 meters per second. Ongoing research also revealed that light travels at different wavelengths and is made up of subatomic particles known as photons, which have no mass and behave as both particles and waves.
Light-Year:
As already noted, the speed of light (expressed in meters per second) means that light travels a distance of 9,460,528,000,000 km (or 5,878,499,817,000 miles) in a single year. This distance is known as a “light year”, and is used to measure objects in the Universe that are at a considerable distances from us.
Examples of objects in our Universe, and the scale of their distances, based on the light year as a standard measure. Credit: Bob King.
For example, the nearest star to Earth (Proxima Centauri) is roughly 4.22 light-years distant. The center of the Milky Way Galaxy is 26,000 light-years away, while the nearest large galaxy (Andromeda) is 2.5 million light-years away. To date, the candidate for the farthest galaxy from Earth is MACS0647-JD, which is located approximately 13.3 billion light years away.
And the Cosmic Microwave Background, the relic radiation which is believed to be leftover from the Big Bang, is located some 13.8 billion light years away. The discovery of this radiation not only bolstered the Big Bang Theory, but also gave astronomers an accurate assessment of the age of the Universe. This brings up another important point about measuring cosmic distances in light years, which is the fact that space and time are intertwined.
You see, when we see the light coming from a distant object, we’re actually looking back in time. When we see the light from a star located 400 light-years away, we’re actually seeing light that was emitted from the star 400 years ago. Hence, we’re seeing the star as it looked 400 years ago, not as it appears today. As a result, looking at objects billions of light-years from Earth is to see billions of light-years back in time.
Yes, light travels at an extremely fast speed. But given the sheer size and scale of the Universe, it can still take billions of years from certain points in the Universe to reach us here on Earth. Hence why knowing how long it takes for light to travel a single year is so useful to scientists. Not only does it allow us to comprehend the scale of the Universe, it also allows us to chart the process of cosmic evolution.
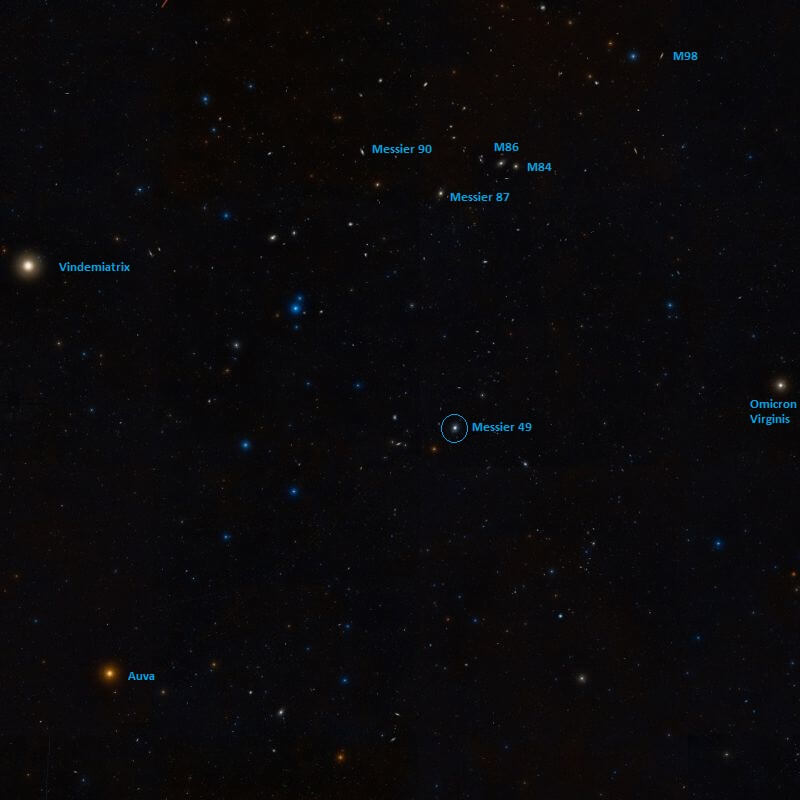
The location of M49, in proximity to other Messier Objects and major stars. Credit: Wikisky
Welcome back to Messier Monday! In our ongoing tribute to the great Tammy Plotner, we take a look at Orion’s Nebula’s “little brother”, the De Marian’s Nebula!
During the 18th century, famed French astronomer Charles Messier noted the presence of several “nebulous objects” in the night sky. Having originally mistaken them for comets, he began compiling a list of them so that others would not make the same mistake he did. In time, this list (known as the Messier Catalog) would come to include 100 of the most fabulous objects in the night sky.
One of these objects is the elliptical galaxy known as Messier 49 (aka. NGC 4472). Located in the southern skies in the constellation of Virgo, this galaxy is one several members of the Virgo Cluster of galaxies and is located 55.9 million light years from Earth. On a clear night, and allowing for good light conditions, it can be seen with binoculars or a small telescope, and will appear as a hazy patch in the sky.
Description:
Messier 49 is the brightest of the Virgo Cluster member galaxies, which is pretty accurate considering it’s only about 60 million light years away and may span an area as large as 160,000 light years. It is a huge system of globular clusters, much less concentrated than Virgo cluster member M87 – but a giant none the less. As Stephen E. Zep (et al) wrote in a 2000 study:
“We present new radial velocities for 87 globular clusters around the elliptical galaxy NGC 4472 and combine these with our previously published data to create a data set of velocities for 144 globular clusters around NGC 4472. We utilize this data set to analyze the kinematics of the NGC 4472 globular cluster system. The new data confirm our previous discovery that the metal-poor clusters have significantly higher velocity dispersion than the metal-rich clusters in NGC 4472. The very small angular momentum in the metal-rich population requires efficient angular momentum transport during the formation of this population, which is spatially concentrated and chemically enriched. Such angular momentum transfer can be provided by galaxy mergers, but it has not been achieved in other extant models of elliptical galaxy formation that include dark matter halos. We also calculate the velocity dispersion as a function of radius and show that it is consistent with roughly isotropic orbits for the clusters and the mass distribution of NGC 4472 inferred from X-ray observations of the hot gas around the galaxy.”
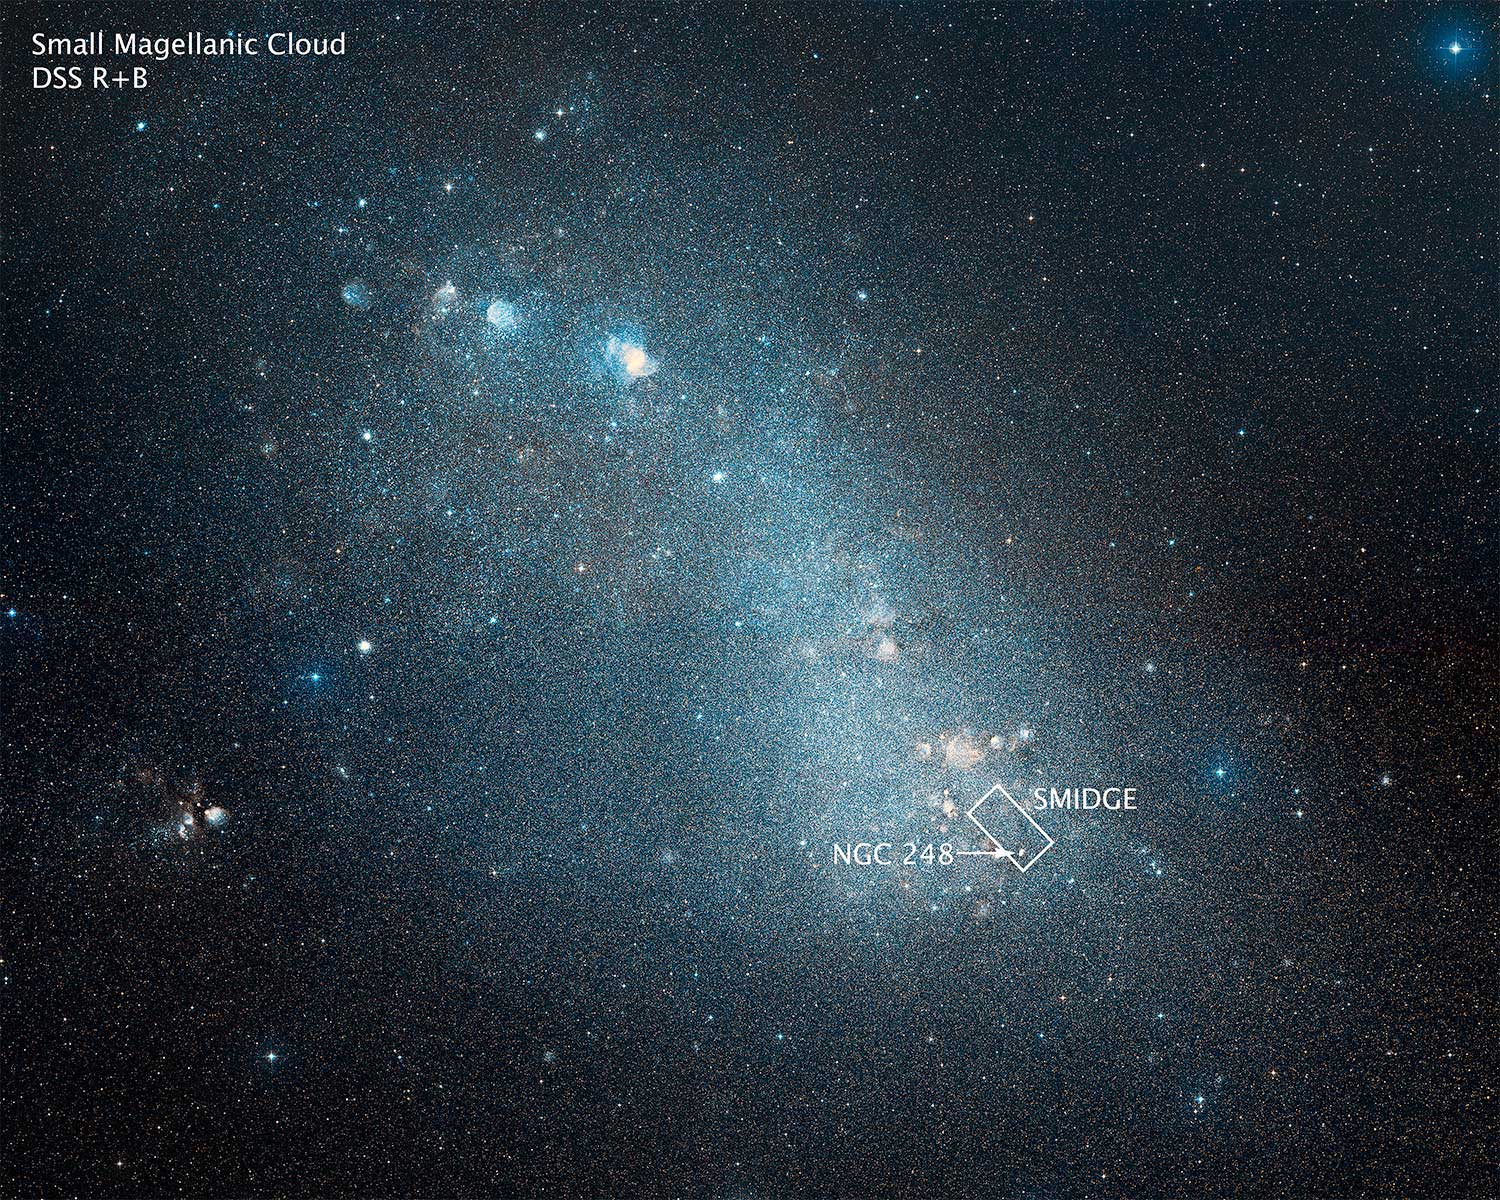
This ground-based image shows the Small Magellanic Cloud. The area of the SMIDGE survey is highlighted, as well as the position of NGC 248. Credit: NASA/ESA/Hubble/Digitized Sky Survey 2
However, there was something going on in the mass structure of M49 that astronomers were curious about… Something they couldn’t quite explain. Was it dark matter? As M. Lowenstein wrote in a 1992 study:
“An attempt to constrain the total mass distribution of the well-observed giant elliptical galaxy NGC 4472 is realized by constructing simultaneous equilibrium models for the gas and stars using all available relevant optical and X-ray data. The value of <?>, the emission-weighted average value of kT, derived from the Ginga spectrum, <?> = 1.9 ± 0.2 keV, can be reproduced only in hydrostatic models where nonluminous matter comprises at least 90% of the total mass. However, in general, these mass models are not consistent with observed projected stellar and globular cluster velocity dispersions at moderate radii.”
The next thing you know, nuclear outburst were discovered – the product of interaction with a neighboring galaxy. As B. Biller (et al) indicated in a 2004 study:
“We present the analysis of the Chandra ACIS observations of the giant elliptical galaxy NGC 4472. The Chandra Observatory’s arcsec resolution reveals a number of new features. Specifically: 1) an ~8 arc min streamer or arm (this corresponds to a linear size of 36 kpc) extending southwest of the galaxy and an assymetrical, somewhat truncated streamer to the northeast. Smaller, morphologically similar structures are observed in NGC 4636 and are explained as shocks from a nuclear outburst in the recent past. The larger size of the NGC 4472 streamers requires a correspondingly higher energy input compared to the NGC 4636 case. The asymmetry of the streamers may be due to the interaction of NGC 4472 with the ambient Virgo cluster gas. 2) A string of small, extended sources south of the nucleus. These sources may stem from an interaction of NGC 4472 with the galaxy UGC 7637. 3) X-ray cavities corresponding to radio lobes, where expanding radio plasma has evacuated the X-ray emitting gas. We also present a luminosity function for the X-ray point sources detected within NGC 4472 which we compare to that for other early type galaxies.”
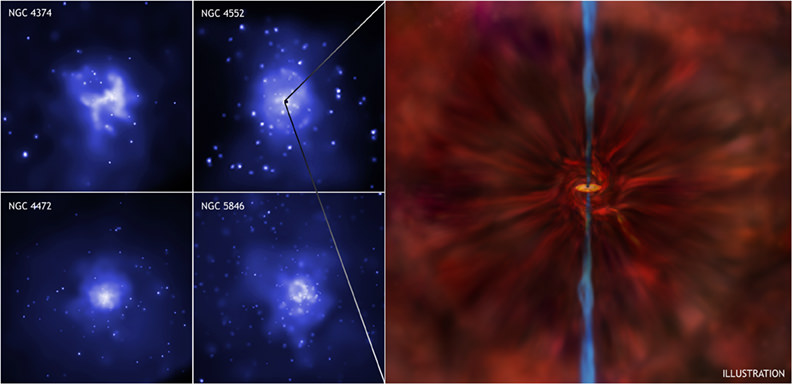
Chandra images showing 4 of the 9 galaxies discovered (left), and an artist’s impression on showing how gas falls towards a black hole and becomes a rapidly spinning disk of matter near the center (right). Credit: NASA/Chandra
But the very best was yet to come… the discovery of a black hole! According to NASA, the results from NASA’s Chandra X-ray Observatory, combined with new theoretical calculations, provide one of the best pieces of evidence yet that many supermassive black holes are spinning extremely rapidly. The images on the left show 4 out of the 9 large galaxies included in the Chandra study, each containing a supermassive black hole in its center.
The Chandra images show pairs of huge bubbles, or cavities, in the hot gaseous atmospheres of the galaxies, created in each case by jets produced by a central supermassive black hole. Studying these cavities allows the power output of the jets to be calculated. This sets constraints on the spin of the black holes when combined with theoretical models. The Chandra images were also used to estimate how much fuel is available for each supermassive black hole, using a simple model for the way matter falls towards such an object.
The artist’s impression on the right side of the main graphic shows gas within a “sphere of influence” falling straight inwards towards a black hole before joining a rapidly spinning disk of matter near the center. Most of the material in this disk is swallowed by the black hole, but some of it is swept outwards in jets (colored blue) by quickly spinning magnetic fields close to the black hole.
Previous work with these Chandra data showed that the higher the rate at which matter falls towards these supermassive black holes, the higher their power output is in jets. However, without detailed theory the implications of this result for black hole behavior were unclear. The new study uses these Chandra results combined with leading theoretical models for the production of jets, plus general relativity, to show that the supermassive black holes in these galaxies must be spinning at close to the maximum rate. If black holes are spinning at this limit, material can be dragged around them at close to the speed of light, the speed limit from Einstein’s theory of relativity.
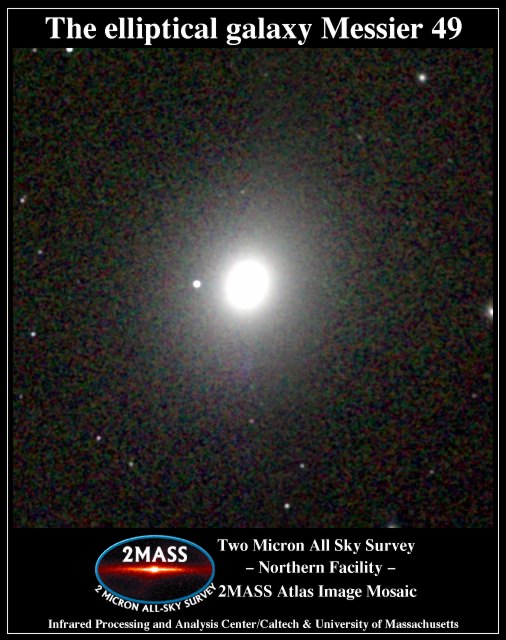
Atlas Image obtained of Messier 49, taken by the Two Micron All Sky Survey (2MASS). Credit: NASA/UofMass/IPAC/Caltech/NASA/NSF/2MASS
History of Observation:
According to SEDS, M49 was the first member of the Virgo cluster of galaxies to be discovered, by Charles Messier, who cataloged it on February 19th, 1771. As he recorded in his notes at the time:
“Nebula discovered near the star Rho Virginis. One cannot see it without difficulty with an ordinary telescope of 3.5-feet [FL]. The Comet of 1779 was compared by M. Messier with this nebula on April 22 and 23: The comet and the nebula had the same light. M. Messier has reported this nebula on the chart of the route of the comet, which appeared in the volume of the Academy of the same year 1779. Seen again on April 10, 1781.” Eight years later, on April 22, 1779, on the occasion of following the comet of that year, and on the hunt for finding more nebulous objects in competition to other observers, Barnabas Oriani independently rediscovered this ‘nebula’: “Very pale and looking exactly like the comet [1779 Bode, C/1779 A1].”
In his Bedford Catalogue of 1844, Admiral William H. Smyth confused this finding with Messier’s discovery:
“A bright, round, and well-defined nebula, on the Virgin’s left shoulder; exactly on the line between Delta Virginis and Beta Leonis, 8deg, or less than half-way, from the former star. With an eyepiece magnifying 93 times, there are only two telescopic stars in the field, one of which is in the sp and the other in the sf quadrant; and the nebula has a very pearly aspect. This object was discovered by Oriani in 1771 [this is wrong: it was Messier who discovered it that year; Oriani found it only in 1779], and registered by Messier as a “faint nebula, not seen without difficulty,” with a telescope of 3 1/2 feet in length. It is a pity that this active and very assiduous astronomer could not have been furnished with one of the giant telescopes of the present days. Had he possessed efficient means, there can be no doubt of the augmentation of his useful and, in its day, unique Catalogue: a collection of objects for which sidereal astronomy must ever remain indebted to him.” This error was repeated by John Herschel in his General Catalogue of 1864 (GC), who also erroneously assigned this object to “1771 Oriani,” and also found its way into J.L.E. Dreyer’s NGC.
Let’s hope you don’t mistake it with the many other galaxies nearby!
The location of Messier 49 within the Virgo constellation. Credit: IAU and Sky & Telescope magazine (Roger Sinnott & Rick Fienberg)
Locating Messier 49:
Galaxy hopping isn’t an easy chore and it takes some practice. Starting looking for M49 about halfway between Epsilon and Beta Virginis. Use Gamma to help triangulate your position. At near magnitude 8, Messier 49 is quite binocular possible and would show under dark sky conditions as a faint, very small egg shaped fog. However, it will not show in a finderscope of a telescope – but the nearby stars will.
Use their patterns to help guide you there. Because galaxies require dark skies, M49 cannot be found under urban conditions or during moonlit nights. In telescopes as small as 70mm, it will appear as a nebulous egg shape and become brighter – but no more resolved to larger instruments. To assist in location, begin with lowest magnification and increase magnification once found to darken background field.
And here are the quick facts to help you get started!
Object Name: Messier 49 Alternative Designations: M49, NGC 4472 Object Type: Elliptical Galaxy Constellation: Virgo Right Ascension: 12 : 29.8 (h:m) Declination: +08 : 00 (deg:m) Distance: 60000 (kly) Visual Brightness: 8.4 (mag) Apparent Dimension: 9×7.5 (arc min)
I look forward to all the future missions that NASA is going to be sending out in the Solar System. Here, check this out. You can use NASA’s website to show you all the future missions. Here’s everything planned for the future, here’s everything going to Mars.
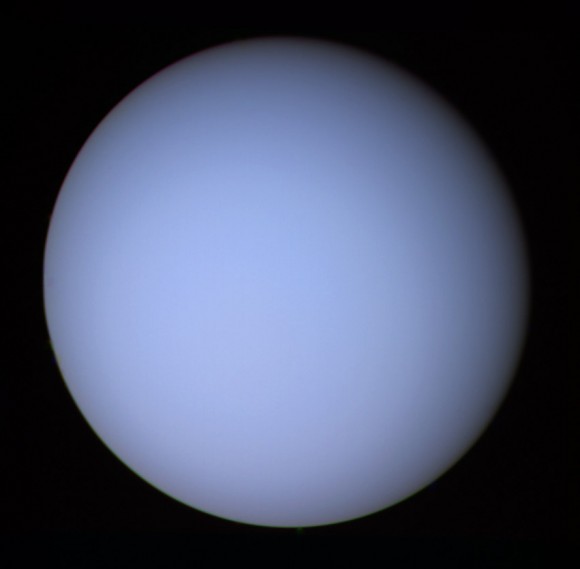
Now, let’s look and see what missions are planned for the outer planets of the Solar System, especially Uranus and Neptune. Oh, that’s so sad… there’s nothing.
Uranus, seen by Voyager 2. Image credit: NASA/JPL
It’s been decades since humanity had an up close look at Uranus and Neptune. For Uranus, it was Voyager 2, which swept through the system in 1986. We got just a few tantalizing photographs of the ice giant planet and it’s moons.
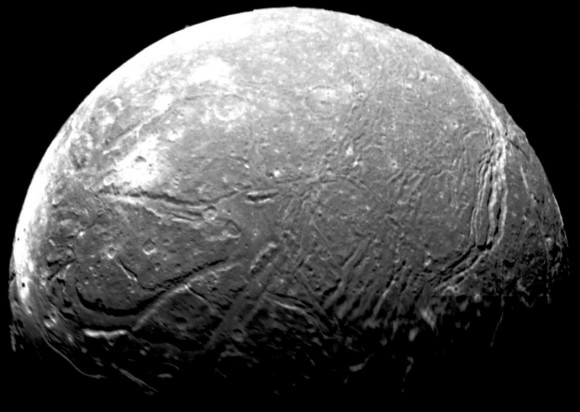
Mosaic of the four highest-resolution images of Ariel taken by the Voyager 2 space probe during its 1986 flyby of Uranus. Credit: NASA/JPL
What’s that?
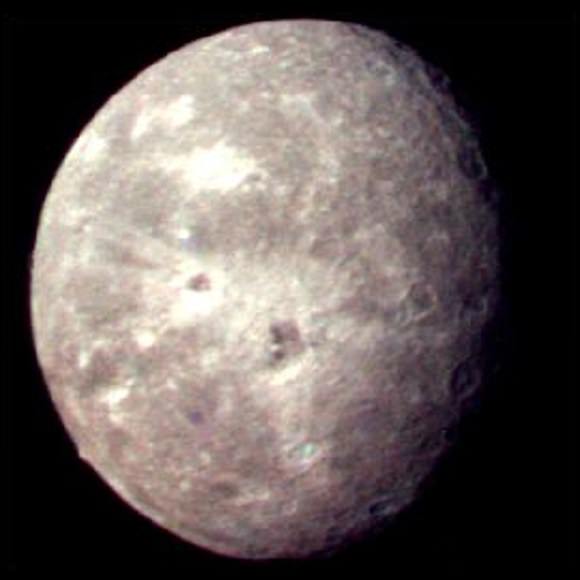
Oberon, as imaged by the Voyager 2 probe during its flyby on Jan. 24, 1986. Credit: NASA
What’s going on there?
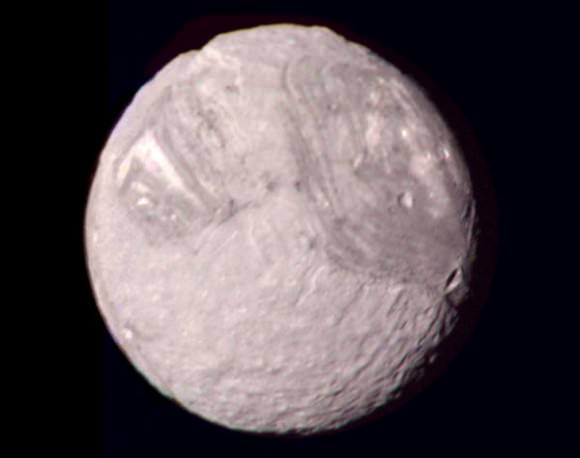
Color composite of the Uranian satellite Miranda, taken by Voyager 2 on Jan. 24, 1986, from a distance of 147,000 km (91,000 mi). Credit: NASA/JPL
What are those strange features? Sorry, insufficient data.
And then Voyager 2 did the same, zipping past Neptune in 1989.
Reconstruction of Voyager 2 images showing the Great Black spot (top left), Scooter (middle), and the Small Black Spot (lower right). Credit: NASA/JPL
Check this out.
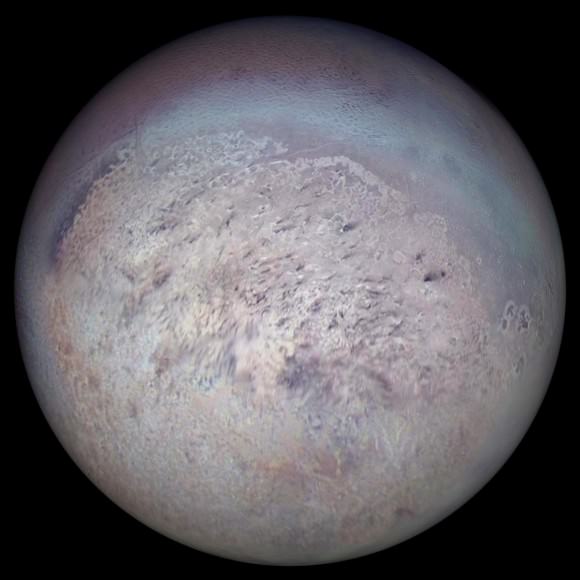
Neptune’s largest moon Triton photographed on August 25, 1989 by Voyager 2. Credit: NASA
What’s going here on Triton? Wouldn’t you like to know more? Well, too bad! You can’t it’s done, that’s all you get.
Don’t get me wrong, I’m glad we’ve studied all these other worlds. I’m glad we’ve had orbiters at Mercury, Venus, everything at Mars, Jupiter, and especially Saturn. We’ve seen Ceres and Vesta, and the Moon up close. We even got a flyby of Pluto and Charon.
It’s time to go back to Uranus and Neptune, this time to stay.
And I’m not the only one who feels this way.
Scientists at NASA recently published a report called the Ice Giant Mission Study, and it’s all about various missions that could be sent to explore Uranus, Neptune and their fascinating moons.
The team of scientists who worked on the study considered a range of potential missions to the ice giants, and in the end settled on four potential missions; three that could go to Uranus, and one headed for Neptune. Each of them would cost roughly $2 billion.
Uranus is closer, easier to get to, and the obvious first destination of a targeted mission. For Uranus, NASA considered three probes.
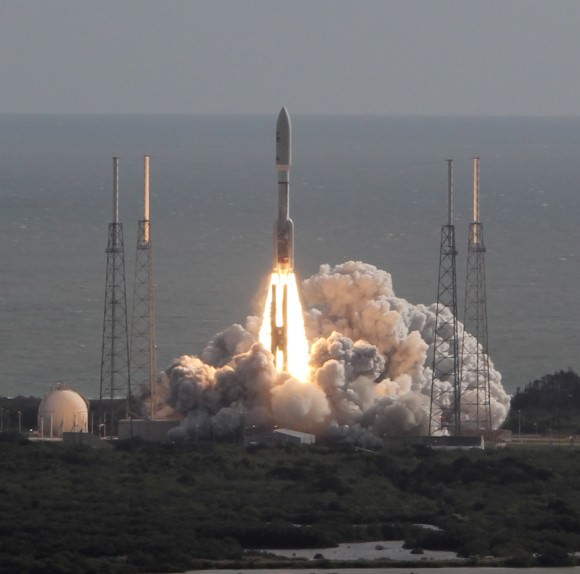
The first idea is a flyby mission, which will sweep past Uranus gathering as much science as it can. This is what Voyager 2 did, and more recently what NASA’s New Horizons did at Pluto. In addition, it would have a separate probe, like the Cassini and Galileo missions, that would detach and go into the atmosphere to sample the composition below the cloudtops. The mission would be heavy and require an Atlas V rocket with the same configuration that sent Curiosity to Mars. The flight time would take 10 years.
NASA’s Curiosity Mars Science Laboratory (MSL) rover blasts off for Mars atop a stunningly beautiful Atlas V rocket. Credit: Ken Kremer – kenkremer.com
The main science goal of this mission would be to study the composition of Uranus. It would make some other measurements of the system as it passed through, but it would just be a glimpse. Better than Voyager, but nothing like Cassini’s decade plus observations of Saturn.
I like where this is going, but I’m going to hold out for something better.
The next idea is an orbiter. Now we’re talking! It would have all the same instruments as the flyby and the detachable probe. But because it would be an orbiter, it would require much more propellant. It would have triple the launch mass of the flyby mission, which means a heavier Atlas V rocket. And a slightly longer flight time; 12 years instead of 10 for the flyby.
Because it would remain at Uranus for at least 3 years, it would be able to do an extensive analysis of the planet and its rings and moons. But because of the atmospheric probe, it wouldn’t have enough mass for more instruments. It would have more time at Uranus, but not a much better set of tools to study it with.
Okay, let’s keep going. The next idea is an orbiter, but without the detachable probe. Instead, it’ll have the full suite of 15 scientific instruments, to study Uranus from every angle. We’re talking visible, doppler, infrared, ultraviolet, thermal, dust, and a fancy wide angle camera to give us those sweet planetary pictures we like to see.
Study Uranus? Yes please. But while we’re at it, let’s also sent a spacecraft to Neptune.
The labeled ring arcs of Neptune as seen in newly processed data. The image spans 26 exposures combined into a equivalent 95 minute exposure, and the ring trace and an image of the occulted planet Neptune is added for reference. (Credit: M. Showalter/SETI Institute).
As part of the Ice Giants Study, the researchers looked at what kind of missions would be possible. In this case, they settled on a single recommended mission. A huge orbiter with an additional atmospheric probe. This mission would be almost twice as massive as the heaviest Uranus mission, so it would need a Delta IV Heavy rocket to even get out to Neptune.
As it approached Neptune, the mission would release an atmospheric probe to descend beneath the cloudtops and sample what’s down there. The orbiter would then spend an additional 2 years in the environment of Neptune, studying the planet and its moons and rings. It would give us a chance to see its fascinating moon Triton up close, which seems to be a captured Kuiper Belt Object.
Unfortunately there’s no perfect grand tour trajectory available to us any more, where a single spacecraft could visit all the large planets in the Solar System. Missions to Uranus and Neptune will have to be separate, however, if NASA’s Space Launch System gets going, it could carry probes for both destinations and launch them together.
The goal of these missions is the science. We want to understand the ice giants of the outer Solar System, which are quite different from both the inner terrestrial planets and the gas giants Jupiter and Saturn.
The Solar System. Credit: NASA
The gas giants are mostly hydrogen and helium, like the Sun. But the ice giants are 65% water and other ices made from methane and ammonia. But it’s not like they’re big blobs of water, or even frozen water. Because of their huge gravity, the ice giants crush this material with enormous pressure and temperature.
What happens when you crush water under this much pressure? It would all depend on the temperature and pressure. There could be different types of ice down there. At one level, it could be an electrically conductive soup of hydrogen and oxygen, and then further down, you might get crystallized oxygen with hydrogen ions running through it.
Hailstones made of diamond could form out of the carbon-rich methane and fall down through the layers of the planets, settling within a molten carbon core. What I’m saying is, it could be pretty strange down there.
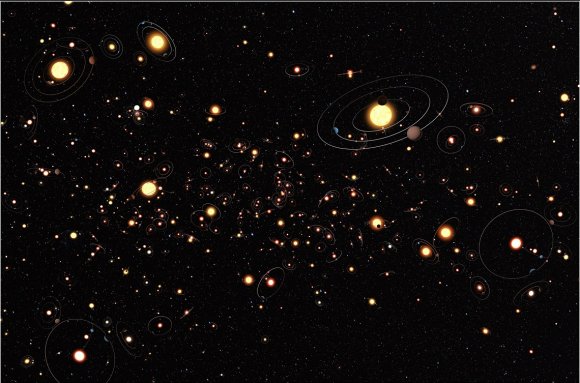
We know that ice giants are common in the galaxy, in fact, they’ve made up the majority of the extrasolar planets discovered so far. By better understanding the ones we have right here in our own Solar System, we can get a sense of the distant extrasolar planets turning up. We’ll be better able to distinguish between the super earths and mini-neptunes.
Artist’s impression of the Milky Way’s 100 billion exoplanets. Credit: NASA, ESA, and M. Kornmesser (ESO)
Another big question is how these planets formed in the first place. In their current models, most planetary astronomers think these planets had very short time windows to form. They needed to have massive enough cores to scoop up all that material before the newly forming Sun’s solar wind blasted it all out into space. And yet, why are these kinds of planets so common in the Universe?
The NASA mission planners developed a total of 12 science objectives for these missions, focusing on the composition of the planets and their atmospheres. And if there’s time, they’d like to know about how heat moves around, their constellations of rings and moons. They’d especially like to investigate Neptune’s moons Triton, which looks like a captured Kuiper Belt Object, as it orbits in the reverse direction from all the other moons in the Solar System.
In terms of science, the two worlds are very similar. But because Neptune has Triton. If I had to choose, I’d go with a Neptune mission.
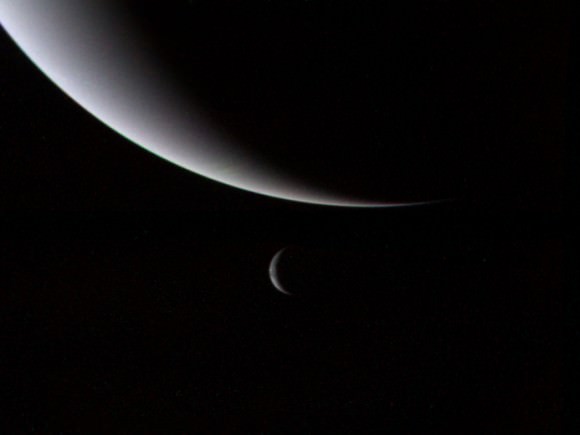
Neptune and its large moon Triton as seen by Voyager 2 on August 28th, 1989. (Credit: NASA).
Are you excited? I’m excited. Here’s the bad news. According to NASA, the best launch windows for these missions would be 2029 or 2034. And that’s just the launch time, the flight time is an additional decade or more on top of that. In other words, the first photos from a Uranus flyby could happen in 2039 or 2035, while orbiters could arrive at either planet in the 2040s. I’m sure my future grandchildren will enjoy watching these missions arrive.
But then, we have to keep everything in perspective. NASA’s Cassini mission was under development in the 1980s. It didn’t launch until 1997, and it didn’t get to Saturn until 2004. It’s been almost 20 years since that launch, and almost 40 years since they started working on it.
I guess we need to be more patient. I can be patient.
MESSENGER image of Mercury from its third flyby (NASA/Johns Hopkins University Applied Physics Laboratory/Carnegie Institution of Washington)
The Solar Planets are a nice mixed bag of what is possible when it comes to planetary formation. Within the inner Solar System, you have the terrestrial planets – bodies that are composed primarily of silicate minerals and metals. And in the outer Solar System, you have the gas giants and bodies that are composed primarily of ice that lie just beyond in the Trans-Neptunian region.
Of these, the question of which planet is the smallest has been the subject of some controversy. Until recently, the smallest planet was considered to be Pluto. But with the 2006 IAU Resolution that put constraints on what the definition of a planet entails, that status has since passed to Mercury. So in addition to being the closest planet to the Sun, Mercury is also the smallest.
Size and Mass:
With a mean radius of 2440 km, Mercury is the smallest planet in our Solar System, equivalent in size to 0.38 Earths. And given that it has its experiences no flattening at the poles – like Venus, which means it is an almost perfectly spherical body – its radius is the same at the poles as it is the equator.
And while it is smaller than the largest natural satellites in our Solar System – such as Ganymede and Titan – it is more massive. At 3.3011×10²³ kg in mass (33 trillion trillion metric tons; 36.3 trillion trillion US tons), it is equivalent to 0.055 Earths in terms of mass.
Mercury and Earth, size comparison. Credit: NASA / APL (from MESSENGER)
Density, Volume:
On top of that, Mercury is significantly more dense than bodies its size. In fact, Mercury’s density (at 5.427 g/cm3) is the second highest in the Solar System, only slightly less than Earth’s (5.515 g/cm3). The result of this is a gravitational force of 3.7 m/s2, which is 0.38 times that of Earth (0.38 g). In essence, this means that if you could stand on the surface of Mercury, you would weight 38% as much as you do on Earth.
In terms of volume, Mercury once again becomes a bit diminutive, at least by Earth standards. Basically, Mercury has a volume of 6.083×10¹⁰ km³ (60 billion cubic km; 14.39 trillion cubic miles) which works out to 0.056 times the volume of the Earth. In other words, you could fit Mercury inside Earth almost twenty times over.
Structure and Composition:
Like Earth, Venus and Mars, Mercury is a terrestrial planet, meaning that is primarily composed of silicate minerals and metals that are differentiated between a metallic core and a silicate mantle and crust. But in Mercury’s case, the core is oversized compared to the other terrestrial planets, measuring some 1,800 km (approx. 1,118.5 mi) in radius, and therefore occupying 42% of the planet’s volume (compared to Earth’s 17%).
Internal structure of Mercury: 1. Crust: 100–300 km thick 2. Mantle: 600 km thick 3. Core: 1,800 km radius. Credit: MASA/JPL
Another interesting feature about Mercury’s core is the fact that it has a higher iron content than that of any other major planet in the Solar System. Several theories have been proposed to explain this, the most widely-accepted being that Mercury was once a larger planet that was struck by a planetesimal that stripped away much of the original crust and mantle, leaving behind the core as a major component.
Beyond the core is a mantle that measures 500 – 700 km (310 – 435 mi) in thickness and is composed primarily of silicate material. The outermost layer is Mercury’s crust, which is composed of silicate material that is believed to be 100 – 300 km thick.
Yes, Mercury is a pretty small customer when compared to its brothers, sisters and distant cousins in the Solar System. However, it is also one of the densest, hottest and most irradiated. So while small, no one would ever accuse this planet of not being really tough!
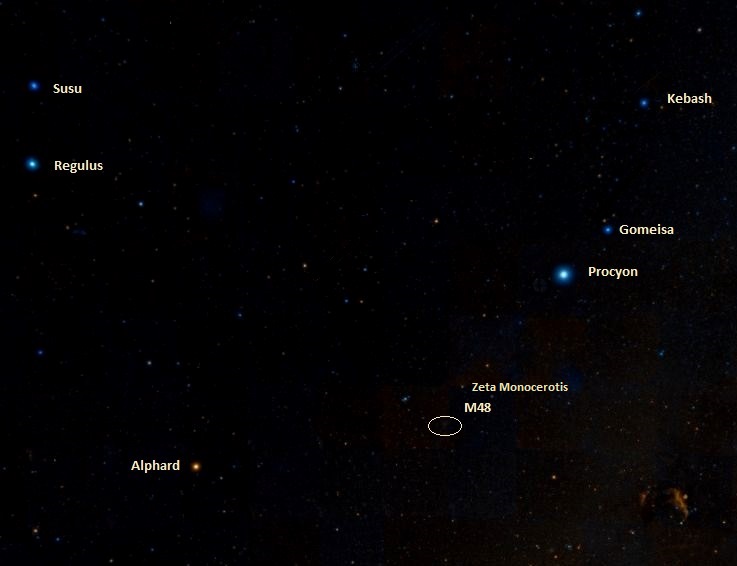
The position of Messier 48 in the Hydra constellation. Credit: Wikisky
Welcome back to Messier Monday! We continue our tribute to our dear friend, Tammy Plotner, by looking at the open star cluster of Messier 48. Enjoy!
In the 18th century, while searching the night sky for comets, French astronomer Charles Messier kept noting the presence of fixed, diffuse objects in the night sky. In time, he would come to compile a list of approximately 100 of these objects, with the purpose of making sure that astronomers did not mistake them for comets. However, this list – known as the Messier Catalog – would go on to serve a more important function.
One of these is the open star cluster known as Messier 48 (aka. NGC 2548). Located approximately 1,500 light years from Earth in the direction of the Hydra constellation, Charles Messier actually got the position of this cluster wrong, a mistake which was corrected by Caroline Herschel in 1783 (hence why she is sometimes credited with its discovery). This object is visible to the naked eye on a clear night, providing light conditions are favorable.
Description:
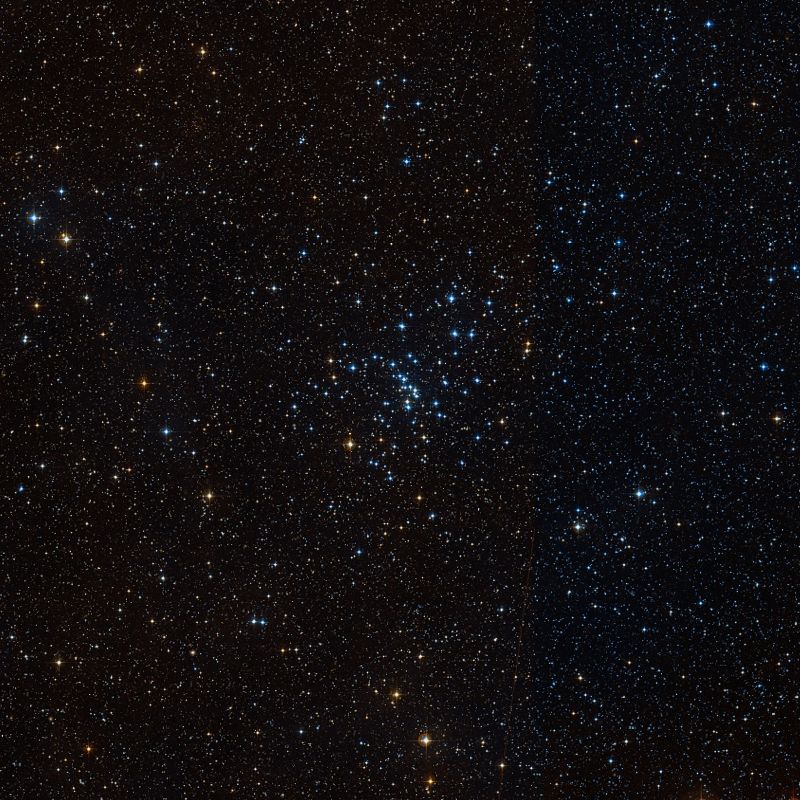
At a modest 300 million years old, this group of about 50 easily visible stars and 80 total members spans an area of space which covers 23 light years. By studying proper motion over time with an astrograph telescope, astronomers have determined it is roughly 1500 light years away from our solar system. But how are determinations like this made? By long term studies and painstaking photographic plates, which address which stars are moving, at what speeds, and in what direction.
The open star cluster Messier 48. Credit: Wikisky
As Z. Y. Wu of the Shanghai Astronomical Observatory indicated in a 2001 study:
“Absolute proper motions, their corresponding errors and membership probabilities of 501 stars in the intermediate-age open cluster NGC 2548 region are determined from MAMA measurements of 10 photographic plates. The plates have the maximum epoch difference of 82 years and they were taken with the double astrograph. The average proper motion precision is 1.18 mas yr -1. These proper motions are used to determine the membership probabilities of stars in the region. The number of stars with membership probabilities higher than 0.7 is 165.”
So now we understand how to determine distance, but how do astronomers determine age? As M. Hancock (et al) indicated in their 2008 study:
“We present an empirical assessment of the use of broad-band optical colours as age indicators for unresolved extragalactic clusters and investigate stochastic sampling effects on integrated colours. We use the integrated properties of Galactic open clusters (OCs) as models for unresolved extragalactic clusters. The population synthesis code Starburst99 (SB99) and four optical colours were used to estimate how well we can recover the ages of 62 well-studied Galactic OCs with published ages. We provide a method for estimating the ages of unresolved clusters and for reliably determining the uncertainties in the age estimates. Our results support earlier conclusions based on comparisons to synthetic clusters, namely the (U?B) colour is critical to the estimation of the ages of star-forming regions. We compare the observed optical colours with those obtained from SB99 using the published ages and get good agreement.”
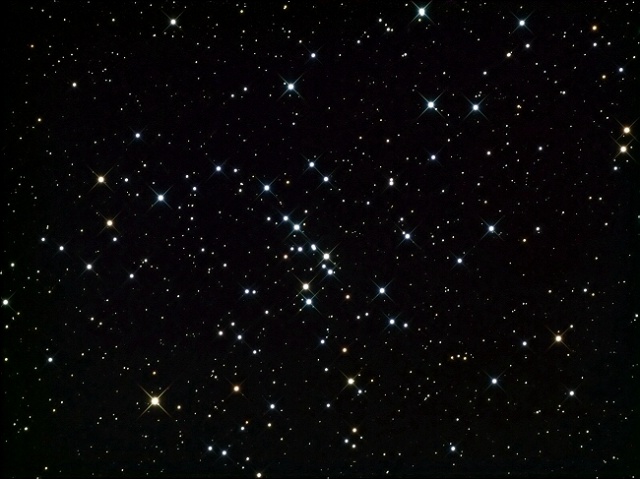
Close up of the Messier 48 open star cluster. Credit: NASA
History of Observation:
According the SEDS, this open cluster was discovered by Charles Messier and cataloged by him on February 19, 1771. “Cluster of very small [faint] stars, without nebulosity; this cluster is at a short distance from the three stars that form the beginning of the Unicorn’s tail.”
However, as he did an error in data reduction, he gave a wrong position in his catalog so that the object was missing until Oswald Thomas identified it in 1934, and independently T.F. Morris in 1959. The identification of M48 by Oswald Thomas was confused by some historians, who have claimed erroneously instead that he had identified M47.
As M48 was lost, two independent rediscoveries occurred: First, Johann Elert Bode apparently found it in or before 1782, and second, Caroline Herschel independently rediscovered it in 1783; “March 8th [17]83. At an equal distance from 29 [Zeta] and 30 Monocerotis, making an equilateral triangle with those two stars is a nebulous spot. By the telescope it appears to be a cluster of scattered stars. It is not in Messier catalogue.”
This latter discovery was published by Caroline’s famous brother, William Herschel, who included it in his catalog as H VI.22 on February 1, 1786. “A beautiful Cluster of much compressed stars, considerably rich. 10 or 12′ diameter. Caroline Herschel discovered it in 1783.”
John Herschel would visit Messier 48 often in his NGC cataloging efforts, describing it as, “A superb cluster which fills the whole field; stars of 9th and 10th to the 13th magnitude – and none below, but the whole ground of the sky on which it stands is singularly dotted over with infinitely minute points [stars]. Place that of a bright star, the southern of two which point into the concavity of an arc.”
Atlas Image mosaic of Messier 48 obtained as part of the Two Micron All Sky Survey (2MASS). Credit: UofMass/IPAC/Caltech/NASA/NSF
Once again, Messier’s mistake would be missed when it was re-observed by Admiral Smyth, who described this object as follows:
“A neat but minute double star, in a tolerably compressed cluster on the Unicorn’s flank, and lying 14deg south-east of Procyon. A 9 1/2 [mag], and B 10, both white. This object is in the middle of a splendid group, in a rich splashy region of stragglers, which fills the field of view, and has several small pairs, chiefly of the 9th magnitude. It was discovered by Miss Herschel in 1783, and was classed by WH [William Herschel] in February, 1783.”
Thanks to careful research done by Owen Gingerich in 1960, we now know exactly what happened:
“Although the circumstances of M48 are not so obvious, only one cluster of the size and brightness likely to be recorded by Messier is found in the region near “the three stars that form the beginning of the unicorn’s tail” (Zeta, 27, and 28 Monocerotis). Dr. Morris has pointed out that this cluster, NGC 2548, has the same right ascension as the position given for M48. (Allowance must, of course, be made for precession in comparing Messier’s figures with modern positions). The declination disagrees by about 5 degrees. Since no conspicuous star is located 2 1/2 degrees away in declination, we cannot account for this position by another error in sign. It seems unlikely that the comparison star was misidentified, since the right ascension is probably correct. Messier did not publish the name of the star used, and his original records are apparently no longer extant. Thus, a careful survey of the region described by Messier leads to the conclusion that NGC 2548 is the cluster the French observer intended as his 48th object, for lack of any cluster nearby that fits the description.”
May you find it a bit easier!!
Locating Messier 48:
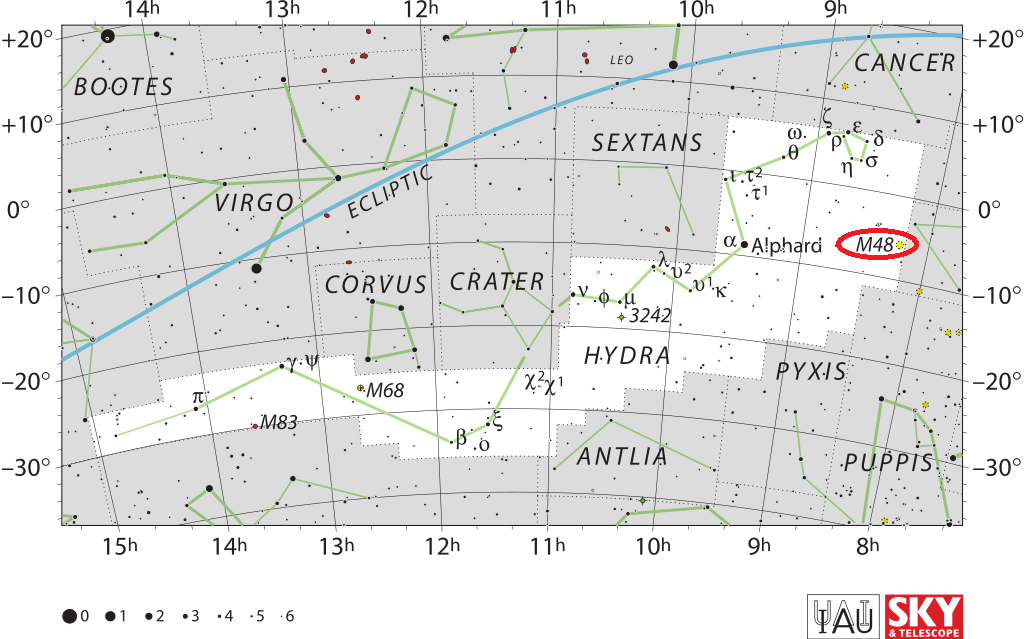
The diamond-bright stars of winter help make locating M48 a little easier, as it is located just a little less than a hand span southeast of Procyon (Alpha Canis Minor) – or about 3 degrees southeast of Zeta Monocerotis. Like M44 in Cancer, M48 lies within the limits of unaided sight. It is quite large and will show several dozen stars easily to almost all binoculars and be well resolved in telescopes of any aperture. Be sure to use low magnification to see it best! Because Messier 48 is bright, it makes a fine object for urban sky conditions and moonlit nights.
The location of Messier 48 in the Hydra constellation. Credit: IAU/Sky & Telescope magazine (Roger Sinnott & Rick Fienberg)
And here are the quick facts on this Messier Object to help you get started:
Object Name: Messier 48 Alternative Designations: M48, NGC 2548 Object Type: Open Galactic Star Cluster Constellation: Hydra Right Ascension: 08 : 13.8 (h:m) Declination: -05 : 48 (deg:m) Distance: 1.5 (kly) Visual Brightness: 5.5 (mag) Apparent Dimension: 54.0 (arc min)