Hurricane Wilma Becomes a Record Setting Cat 5

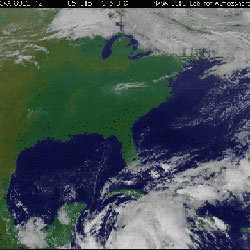
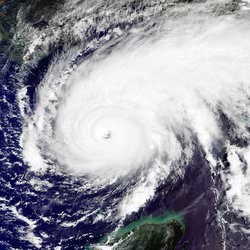
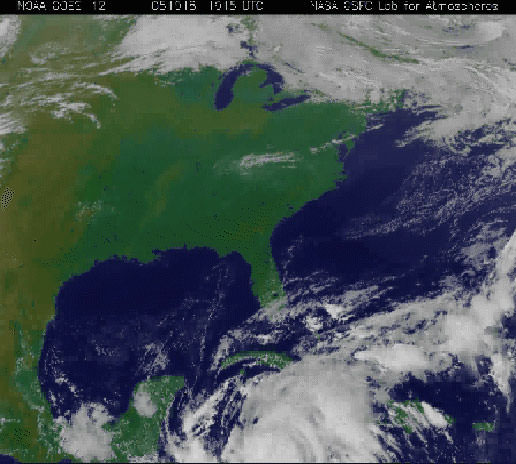
Satellite view of Hurricane Wilma. Image credit: NASA/NOAA. Click to enlarge.
In the early morning hours of Wednesday, October 19 in the warm Caribbean waters, Hurricane Wilma strengthened from a Category 2 hurricane to the most intense Hurricane 5 hurricane on record.

Hurricanes are measured by factors such as atmospheric pressure, winds and storm surge. Wilma’s atmospheric pressure at 8 a.m. EDT measured 882 millibars. The previous record was 888 millibars set in 1988 by Hurricane Gilbert that moved through the Gulf of Mexico.

At 8 a.m. Wednesday, October 19, Wilma was packing maximum sustained winds of 175 mph (280 km/hr) with higher gusts. Wilma’s center was located near latitude 17.2 north and longitude 82.8 west or about 340 miles (550 km) southeast of Cozumel, Mexico. Wilma is moving toward the west-northwest near 8 mph (13 km/hr). A turn toward the northwest is expected during the next 24 hours.

According to the National Hurricane Center, Wilma is a potentially catastrophic Category 5 hurricane on the Saffir-Simpson scale. Fluctuations in intensity are common in hurricanes this intense and are likely during the next 24 hours.

Wilma is a smaller storm than Katrina. Wilma’s hurricane force winds extend outward to 15 miles (30 km) from the center and tropical storm force winds extend outward up to 160 miles (260 km).

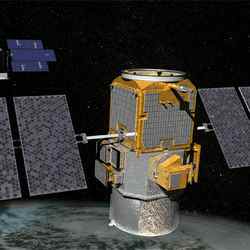
Based on data from dropsondes, instruments that are dropped into the storm from Hurricane Hunter planes that fly over it, and flight-level data from an Air Force plane, Wilma’s minimum central pressure is estimated to be 882 millibars (26.05 inches). This is the lowest pressure on record for a hurricane in the Atlantic basin.

Rainfall by Wilma is expected to be high. Wilma is expected to produce storm total accumulations of 10 to 15 inches with local amounts near 25 inches in mountainous terrain across Cuba through Friday. Additional rainfall accumulations of 5 to 10 inches, with local amounts of 15 inches, are possible across the Cayman Islands, Swan Island and Jamaica through Thursday.

From Honduras northward to the Yucatan peninsula of Mexico through Thursday, storm total accumulations of 4 to 6 inches, with isolated amounts of 8 to 12 inches are possible.

Watches and warnings have been posted throughout the region. A hurricane watch is in effect for the east coast of the Yucatan Peninsula from Cabo Catoche to Punta Gruesa. A hurricane watch is also in effect for Cuba in the provinces of Matanzas westward through Pinar del Rio and for the Isle of Youth. A hurricane watch means that hurricane conditions are possible within the watch area, generally within 36 hours.

Tropical storm warnings are up for Honduras from the Honduras/Nicaragua border westward to Cabo Camaron. A tropical storm warning and a hurricane watch remain in effect for the Cayman Islands.

Current forecast models project Wilma making landfall in southwest Florida on Saturday, Oct. 22 or Sunday, Oct. 23. All residents in the Florida Keys and the Florida peninsula should closely monitor the progress of extremely dangerous Hurricane Wilma. Story credit: Rob Gutro, NASA

Original Source: NASA News Release

Studying the Health of the Great Barrier Reef from Space

The Great Barrier Reef, photographed by Envisat. Image credit: ESA. Click to enlarge.
Australian researchers have found Envisat’s MERIS sensor can detect coral bleaching down to ten metres deep. This means Envisat could potentially monitor impacted coral reefs worldwide on a twice-weekly basis.

Coral bleaching happens when symbiotic algae living in symbiosis with living coral polyps (and providing them their distinctive colours) are expelled. The whitening coral may die with subsequent impacts on the reef ecosystem, and thus fisheries, regional tourism and coastal protection. Coral bleaching is linked to sea temperatures above normal summer maxima and to solar radiation. Bleaching may take place on localised and mass scales ? there was an extensive bleaching event in 1998 and 2002 likely linked to El Ni?o events.

“An increase in frequency of coral bleaching may be one of the first tangible environmental effects of global warming,” states Dr. Arnold Dekker of Australia’s Commonwealth Scientific and Industrial Research Organisation?s (CSIRO) Wealth from Oceans Flagship program.”The concern is that coral reefs might pass a critical bleaching threshold beyond which they are unable to regenerate.”

Aerial or boat-based observation is the current method of detecting bleaching, but many reefs are either inaccessible or simply too large (the Great Barrier Reef has an area of 350 000 square kilometres) for an event that happens within a fortnight. Bleached corals may rapidly be colonised by blue-green to brown algae, more difficult to distinguish from live coral.

Repetitive, objective and broad-scale satellite coverage is the alternative. At this week’s MERIS/AATSR Workshop in Frascati, Italy, the CSIRO team presented initial results using Envisat’s Medium Resolution Imaging Spectrometer (MERIS). MERIS acquires images in 15 different spectral bands at 300 m resolution.

“Coral bleaching needs to be mapped at the global scale,” Dekker adds. “High-spatial resolution satellites can only do it on a few reefs due to cost and coverage constraints. We need a system that has appropriate coverage and revisit frequency, with a sufficient amount of spectral bands and sensitivity. There is no more suitable system than MERIS.”

The team studied Heron Island reef at the southern end of the Great Barrier Reef, site of a University of Queensland research station. Validating MERIS Full Resolution mode results, they found that observed changes in live coral cover were correlated to an existing bleaching event.

Theoretical studies indicate that for each complete 300-metre pixel of coral under one metre of water it is possible to detect a 2% bleaching of live coral. MERIS should remain sensitive to detecting from 7-8% bleached coral even under ten metres of water.

“MERIS Full Resolution covers the world every three days, a bottleneck for global monitoring could be data processing,” Dekker concludes. “However satellite sensors measuring sea surface temperature such as Envisat’s Advanced Along Track Scanning Radiometer (AATSR) can be applied to prioritise reefs that are subject to sea temperature heating anomalies-thus focusing the MERIS based bleaching detection.

Australia’s Great Barrier Reef Marine Park Authority has expressed interest in the project. Australian scientists plan to progress to perform MERIS monitoring of bleaching events up to the scale of the whole Great Barrier Reef.

Original Source: ESA News Release

Was There a Slushball Earth?

Scientists think that ancient Earth was nothing but a snowball. Image credit: NASA.

“Snowball Earth” proponents, who say that Earth’s oceans were long ago covered by thick ice, explain the survival of life by hypothesizing the existence of small warm spots, or refugia. On the other side, supporters of a “Slushball Earth” say the planet included large areas of thin ice or open ocean, particularly around the equator.

Now, scientists who applied innovative techniques to previously unexamined rock formations have turned up strong evidence to support the “Slushball Earth” side of the decades-long scientific debate.

The study appears in the Sept. 29 online Science Express

The debate has tended to revolve around the same rock samples and analytical techniques, said Alison Olcott, an earth scientist at the University of Southern California. So she and her team focused on a drill core of little-known black shale deposits from southeastern Brazil and applied lipid biomarker techniques to identify prehistoric organisms based on the fatty remains of their cell membranes.

“This evidence for life in parts of the global oceans requires a revision of our interpretations related to this period of low-latitude glaciation,” said Enriqueta Barrera, program director in the National Science Foundation’s (NSF) Division of Earth Sciences, which funded the research.

The team, which included scientists from USC, Caltech, the University of Maryland and a Brazilian mining company, identified a complex and productive microbial ecosystem, including photosynthesizing organisms that could not have existed under a thick layer of ice.

“If there were ice, it had to have been thin enough that organisms could photosynthesize below it or within it,” Olcott said.

Frank Corsetti of USC, a co-author on the study, said “this is the first real evidence that substantial photosynthesis occurred in the Earth’s oceans during the extreme ice age 700 million years ago, which is a challenge for the snowball theory.”

The evidence does not prove large parts of the ocean remained free of sheet ice during the pre-Cambrian glaciation. Although unlikely, Olcott said it is possible one of the tiny “refugia” under the “Snowball Earth” hypothesis allowed such marine life to exist.

But, she said, “finding the one anomalous spot would be quite unlikely,” adding that the samples she studied came from an extensive formation of rocks with similar characteristics.

“At what point does an enormous refugium become open ocean?” she asked.

Skeptics also may argue that the rocks do not necessarily date to a glacial era, Olcott said. But the team found evidence of glacial activity in the samples, such as dropstones (continental rocks dropped by melting glaciers into marine deposits) and glendonites (minerals that only form in near-freezing water).

“Geologists don’t necessarily think of looking for traces of microbes left in the rocks. This is the first direct look at the ecosystem during this time period,” said Olcott, who credited USC’s geobiology program, one of a handful in the country, with influencing her thinking.

Original Source: NSF News Release

Satellite Picture of Hurricane Rita

Hurricane Rita, taken on September 22. Image credit: ESA. Click to enlarge.
As Hurricane Rita entered the Gulf of Mexico, ESA’s Envisat satellite’s radar was able to pierce through swirling clouds to directly show how the storm churns the sea surface. This image has then been used to derive Rita’s wind field speeds.

Envisat acquired this Advanced Synthetic Aperture Radar (ASAR) image at 0344 UTC on 22 September (2345 on 21 September in US Eastern Daylight Saving Time), when Hurricane Rita was passing west of Florida and Cuba. The image was acquired in Wide Swath Mode with resolution of 150 metres. Envisat’s optical Medium Resolution Imaging Spectrometer (MERIS) is also being used to observe the storm during daylight, returning details of its cloud structure and pressure.

Notably large waves are seen around the eye of Hurricane Rita in the radar image. ASAR measures the backscatter, which is a measure of the roughness of the ocean surface. On a basic level, bright areas of the radar image mean higher backscatter due to surface roughness. This roughness is strongly influenced by the local wind field so that the radar backscatter can be used in turn to measure the wind.

So the Center for Southeastern Tropical Advanced Remote Sensing at the University of Miami used this ASAR image to calculate the speed of Hurricane Rita’s surface wind fields ? showing maximum wind speeds in excess of 200 kilometres per hour.

“The most detailed information about hurricane dynamics and characteristics are obtained from dedicated flights by hurricane hunter aircraft,” explains Hans Graber of CSTARS. “However these flight missions cannot always take place. Satellite remote sensing provides a critical alternative approach.

“It is critical for weather forecasters to obtain reliable characterization of the eye wall dimension and the radii of gale- tropical storm- and hurricane-force winds in order to provide skilful forecasts and warning. Satellite based observations will facilitate better understanding of hurricane evolution and intensification.

“Radar images penetrate through clouds and can easily detect the eye replacement cycle of hurricanes which are precursors to further intensification.”

Rita was a maximum Category Five on the Saffir-Simpson Hurricane Scale when the ASAR image was acquired. As it continues west through the Gulf of Mexico it has weakened to a still-dangerous Category Four. Rita is expected to make landfall on the Gulf coast during the morning of 24 September.

ERS-2 joins in Rita observations
The same day Envisat acquired its ASAR image of Rita, its sister spacecraft ERS-2 also made complementary observations of the hurricane’s underlying wind fields using its radar scatterometer.

This instrument works by firing a trio of high-frequency radar beams down to the ocean, then analysing the pattern of backscatter reflected up again. Wind-driven ripples on the ocean surface modify the radar backscatter, and as the energy in these ripples increases with wind velocity, so backscatter increases as well. Scatterometer results enable measurements of not only wind speed but also direction across the water surface.

What makes ERS-2’s scatterometer especially valuable is that its C-band radar frequency is almost unaffected by heavy rain, so it can return useful wind data even from the heart of the fiercest storms ? and is the sole scatterometer of this type currently in orbit.

The ERS-2 Scatterometer results for Hurricane Rita seen here have been processed by the Royal Netherlands Meteorological Institute (KNMI). They are also routinely assimilated by the European Centre for Medium-Range Weather Forecasting (ECMWF) into their advanced numerical models used for meteorological predictions.

“Scatterometer data from the ERS-2 platform provide high-quality wind information in the vicinity of tropical cyclones,” states Hans Hersbach of ECMWF. “For a Hurricane like Rita, the combination of such observations with [in-situ] dropsonde data enables the analysis system at ECMWF to produce an improved forecast.”

Another Envisat instrument called the Radar Altimeter-2 uses radar pulses to measure sea surface height (SSH) down to an accuracy of a few centimetres.

Near-real time radar altimetry is a powerful tool for monitoring a hurricane’s progress and predicting its potential impact. This is because anomalies in SSH can be used to identify warmer ocean features such as warm core rings, eddies and currents.

The US National Oceanic and Atmospheric Administration (NOAA) is utilising Envisat RA-2 results along with those from other space-borne altimeters to chart such regions of ‘tropical cyclone heat potential’ (TCHP) and improve the accuracy of Hurricane Rita forecasting.

Observing hurricanes
A hurricane is basically a large, powerful storm centred around a zone of extreme low pressure. Strong low-level surface winds and bands of intense precipitation combine strong updrafts and outflows of moist air at higher altitudes, with energy released as rainy thunderstorms.

Envisat carries both optical and radar instruments, enabling researchers to observe high-atmosphere cloud structure and pressure in the visible and infrared spectrum, while at the same time using radar backscatter to measure the roughness of the sea surface and so derive the wind fields just above it.

Those winds converging on the low-pressure eye of the storm are what ultimately determine the spiralling cloud patterns that are characteristic of a hurricane.

Additional Envisat instruments can be used to take the temperature of the warm ocean waters that power storms during the annual Atlantic hurricane season, along with sea height anomalies related to warm upper ocean features.

Original Source: ESA News Release

Here are some hurricanes pictures.

Methane Release Raised Earth Temperatures 180 Million Years Ago

Western Hemisphere. Image credit: NASA Click to enlarge
Open University researchers have uncovered startling new evidence about an extreme period of a sudden, fatal dose of global warming some 180 million years ago during the time of the dinosaurs. The scientists’ findings could provide vital clues about climate change happening today and in the future.

The OU Department of Earth Sciences team, PhD student Dave Kemp and supervisors Drs. Angela Coe and Anthony Cohen, along with Dr. Lorenz Schwark of the University of Cologne, discovered evidence suggesting that vast amounts of methane gas were released to the atmosphere in three massive ‘methane burps’ or pulses. The addition of methane, a greenhouse gas, to the atmosphere had a severe impact on the environment, warming Earth about 10 C, and resulting in the extinction of a large number of species on land and in the oceans.

Dr Angela Coe says: “We’ve known about this event for a few years through earlier work by our team and others, but there’s been a great deal of uncertainty about its precise size, duration, and underlying cause. What our present study shows is that this methane release was not just one event, but 3 consecutive pulses. Importantly, our data demonstrate that each individual pulse was very rapid. Also, whilst the methane release was very quick, we’ve found that the recovery took much longer, occurring over a few hundred thousand years”.

The methane came from gas hydrate, a frozen mixture of water and methane found in huge quantities on the seabed. This hydrate suddenly melted, allowing the methane to escape. The OU researchers based their findings on geochemical analyses of mudrocks that are preserved along the Yorkshire coast near Whitby, UK, and date from the Jurassic Period of geological time.

Dave Kemp, whose PhD is funded by the Natural Environment Research Council (NERC), says: “The methane was released because slight wobbles in the Earth’s orbit periodically bring our planet closer to the Sun, warming the oceans sufficiently to melt the vast reserves of hydrate. We believe that this effect was compounded by warming from greenhouse gases from volcanoes. After the methane was released into the atmosphere from the seabed it reacted rapidly with oxygen to form carbon dioxide. Carbon dioxide is also a powerful greenhouse gas that persists in the atmosphere for many hundreds of years, and it was this gas which caused such a massive global warming effect”.

Dr Anthony Cohen adds: “One of the most important aspects of the study is that it provides an accurate timescale for how the Earth, and life, reacted to a sudden increase in atmospheric carbon dioxide. Today we are releasing large amounts of carbon dioxide to the atmosphere, primarily through the burning of fossil fuels. It is possible that the rate at which carbon dioxide is being added to the atmosphere now actually outstrips the rate at which it was added 180 million years ago. Given that the effects were so devastating then, it is extremely important to understand the details of past events in order to better comprehend present-day climate change. With this information, we are better informed about what action needs to be taken to mitigate or avoid some of the potential detrimental future effects”.

NASA Astrobiology

Two Weather Satellites About to Launch

Artist’s concept of CloudSat and Calipso orbiting Earth. Image credit: NASA Click to enlarge
Two NASA satellites, planned for launch no earlier than Oct. 26, will give us a unique view of Earth’s atmosphere. CloudSat and Cloud-Aerosol Lidar and Infrared Pathfinder Satellite Observations (Calipso) are undergoing final preparations for launch from Vandenberg Air Force Base, Calif.

CloudSat and Calipso will provide a new, 3-D perspective on Earth’s clouds and airborne particles called aerosols. The satellites will answer questions about how clouds and aerosols form, evolve and affect water supply, climate, weather and air quality.

CloudSat and Calipso employ revolutionary tools that will probe Earth’s atmosphere. Each spacecraft carries an “active” instrument that transmits pulses of energy and measures the portion of the pulses scattered back to the instrument.

CloudSat’s cloud-profiling radar is more than 1,000 times more sensitive than typical weather radar. It can detect clouds and distinguish between cloud particles and precipitation. “The new information from CloudSat will answer basic questions about how rain and snow are produced by clouds, how rain and snow are distributed worldwide and how clouds affect the Earth’s climate,” said Dr. Graeme Stephens, CloudSat principal investigator at Colorado State University, Fort Collins, Colo.

Calipso’s polarization lidar instrument can detect aerosol particles and can distinguish between aerosol and cloud particles. “With the high resolution observation that Calipso will provide, we will get a better understanding of aerosol transport and how our climate system works,” said Dr. David Winker, Calipso principal investigator at NASA’s Langley Research Center, Hampton, Va.

The satellites will be launched into a 705-kilometer (438-mile) circular, sun-synchronous polar orbit, where they will fly in formation just 15 seconds apart as members of NASA’s “A-Train” constellation with three other Earth Observing System satellites. The A-Train includes NASA’s Aqua and Aura satellites and France’s Polarization and Anisotropy of Reflectances for Atmospheric Sciences coupled with observations from a Lidar satellite.

The usefulness of data from CloudSat, Calipso and the other A-Train satellites will be much greater when combined. The combined set of measurements will provide new insight into the global distribution and evolution of clouds that will lead to improvements in weather forecasting and climate prediction.

CloudSat is managed by NASA’s Jet Propulsion Laboratory, Pasadena, Calif. The radar instrument was developed at JPL, with hardware contributions from the Canadian Space Agency. Colorado State University provides scientific leadership and science data processing and distribution.

Other contributions include resources from the U.S. Air Force and the U.S. Department of Energy. Ball Aerospace and Technologies Corp. designed and built the spacecraft. A host of U.S. and international universities and research centers provides support to the science team. Some of these activities are contributed as partnerships with the project.

Calipso was developed through collaboration between NASA and the French Space Agency, Centre National d’Etudes Spatiales. NASA’s Langley Research Center leads the Calipso mission and provides science team leadership, systems engineering, payload mission operations, and validation, processing and archiving of data. Langley also developed the lidar instrument in collaboration with the Ball Aerospace and Technologies Corp., which developed the onboard visible camera.

NASA’s Goddard Space Flight Center, Greenbelt, Md., provides project management, system engineering support and overall program management. Centre National d’Etudes Spatiales provides a Proteus spacecraft developed by Alcatel, the imaging infrared radiometer, payload-to-spacecraft integration and spacecraft mission operations. The Institut Pierre Simon Laplace in Paris provides the imaging infrared radiometer science oversight, data validation and archival. Hampton University provides scientific contributions and manages the outreach program.

For more information on CloudSat and Calipso on the Internet, please visit http://www.nasa.gov/cloudsat and http://www.nasa.gov/calipso .

Original Source: NASA News Release

Early Atmosphere Looked Very Different From Today

Bruce Fegley examines a meteorite. Image credit: WUSTL Click to enlarge
Using primitive meteorites called chondrites as their models, earth and planetary scientists at Washington University in St. Louis have performed outgassing calculations and shown that the early Earth’s atmosphere was a reducing one, chock full of methane, ammonia, hydrogen and water vapor.

In making this discovery Bruce Fegley, Ph.D., Washington University professor of earth and planetary sciences in Arts & Sciences, and Laura Schaefer, laboratory assistant, reinvigorate one of the most famous and controversial theories on the origins of life, the 1953 Miller-Urey experiment, which yielded organic compounds necessary to evolve organisms.

Chondrites are relatively unaltered samples of material from the solar nebula, According to Fegley, who heads the University’s Planetary Chemistry Laboratory, scientists have long believed them to be the building blocks of the planets. However, no one has ever determined what kind of atmosphere a primitive chondritic planet would generate.

“We assume that the planets formed out of chondritic material, and we sectioned up the planet into layers, and we used the composition of the mix of meteorites to calculate the gases that would have evolved from each of those layers,” said Schaefer. “We found a very reducing atmosphere for most meteorite mixes, so there is a lot of methane and ammonia.”

In a reducing atmosphere, hydrogen is present but oxygen is absent. For the Miller-Urey experiment to work, a reducing atmosphere is a must. An oxidizing atmosphere makes producing organic compounds impossible. Yet, a major contingent of geologists believe that a hydrogen-poor, carbon dioxide-rich atmosphere existed because they use modern volcanic gases as models for the early atmosphere. Volcanic gases are rich in water, carbon dioxide, and sulfur dioxide but contain no ammonia or methane.

“Geologists dispute the Miller-Urey scenario, but what they seem to be forgetting is that when you assemble the Earth out of chondrites, you’ve got slightly different gases being evolved from heating up all these materials that have assembled to form the Earth. Our calculations provide a natural explanation for getting this reducing atmosphere,” said Fegley.

Schaefer presented the findings at the annual meeting of the Division of Planetary Sciences of the American Astronomical Society, held Sept. 4-9 in Cambridge, England.

Schaefer and Fegley looked at different types of chondrites that earth and planetary scientists believe were instrumental in making the Earth. They used sophisticated computer codes for chemical equilibrium to figure out what happens when the minerals in the meteorites are heated up and react with each other. For example, when calcium carbonate is heated up and decomposed, it forms carbon dioxide gas.

“Different compounds in the chondritic Earth decompose when they’re heated up, and they release gas that formed the earliest Earth atmosphere,” Fegley said.

The Miller-Urey experiment featured an apparatus into which was placed a reducing gas atmosphere thought to exist on the early Earth. The mix was heated up and given an electrical charge and simple organic molecules were formed. While the experiment has been debated from the start, no one had done calculations to predict the early Earth atmosphere.

“I think these computations hadn’t been done before because they’re very difficult; we use a special code” said Fegley, whose work with Schaefer on the outgassing of Io, Jupiter’s largest moon and the most volcanic body in the solar system, served as inspiration for the present early Earth atmosphere work.

Original Source: WUSTL News Release

South Ozone Hole Returns

Ozone forecast for 1 September. Image credit: KNMI/ESA Click to enlarge
This season’s Antarctic ozone hole has swollen to an area of ten million square kilometres from mid-August – approximately the same size as Europe and still expanding. It is expected to reach maximum extent during September, and ESA satellites are vital for monitoring its development.

This year’s hole is large for this time of year, based on results from the last decade: only the ozone holes of 1996 and 2000 had a larger area at this point in their development.

Envisat’s Scanning Imaging Absorption Spectrometer for Atmospheric Chartography (SCIAMACHY) routinely monitors ozone levels on a global basis, continuing a dataset of measurements stretching back to mid-1995, previously made by the Global Ozone Monitoring Experiment (GOME) aboard the earlier ESA spacecraft ERS-2.

ESA data form the basis of an operational near-real time ozone monitoring and forecasting service forming part of the PROMOTE (PROtocol MOniToring for the GMES Service Element) consortium, made up of more than 30 partners from 11 countries, including the Royal Dutch Meteorological Institute (KNMI).

As part of the PROMOTE service, the satellite results are combined with meteorological data and wind field models so that robust ozone and ultraviolet forecasts can be made. In a first for ESA, these results are being used by the World Meteorological Organisation (WMO) to compile their regularly-updated Antarctic Ozone Bulletin.

The precise time and range of Antarctic ozone hole occurrences are determined by regional meteorological variations. During the southern hemisphere winter, the atmospheric mass above the Antarctic continent is kept cut off from exchanges with mid-latitude air by prevailing winds known as the polar vortex. This leads to very low temperatures, and in the cold and continuous darkness of this season, polar stratospheric clouds are formed that contain chlorine.

The stratospheric ozone layer that protects life on Earth from harmful ultraviolet (UV) radiation is vulnerable to the presence of certain chemicals in the atmosphere such as chlorine, originating from man-made pollutants like chlorofluorocarbons (CFCs).

Now banned under the Montreal Protocol, CFCs were once widely used in aerosol cans and refrigerators. CFCs themselves are inert, but ultraviolet radiation high in the atmosphere breaks them down into their constituent parts, which can be highly reactive with ozone.

As the polar spring arrives, the combination of returning sunlight and the presence of polar stratospheric clouds leads to splitting of chlorine into highly ozone-reactive radicals that break ozone down into individual oxygen molecules. A single molecule of chlorine has the potential to break down thousands of molecules of ozone.

The PROMOTE atmospheric ozone forecast seen here has atmospheric ozone measured in Dobson Units (DUs), which stands for the total thickness of ozone in a given vertical column if it were concentrated into a single slab at standard temperature and atmospheric pressure ? 400 DUs is equivalent to a thickness of four millimetres, for example.

Developing out of the successful precursor Tropospheric Emission Monitoring Information Service (TEMIS), PROMOTE is a portfolio of information services covering the atmosphere part of the Earth System, operating as part of ESA’s initial Services Element of Global Monitoring for Environment and Security (GMES). This is a joint initiative between ESA and the European Commission to combine all available ground- and space-based information sources and develop a global environmental monitoring capability for Europe.

Original Source: ESA Portal

Earth’s Core Rotates Faster Than Its Crust

Earth. Image credit: NASA Click to enlarge
Scientists have ended a long debate by proving that Earth’s core rotates faster than its surface.

Their research measured differences in the time it took seismic waves generated by nearly identical earthquakes to travel through Earth’s inner core.

According to geologists Jian Zhang of the Lamont-Doherty Earth Observatory (LDEO), Xiaodong Song of the University of Illinois at Urbana-Champaign and other co-authors of a paper in the Aug. 26 issue of the journal Science, Earth’s iron core is rotating approximately 1 degree per year faster than the rest of the planet.

“Whether the Earth’s core spins faster than its surface has been a hotly debated topic,” says Robin Reichlin, program director in the National Science Foundation (NSF)’s Division of Earth Sciences, which funded the research. “These new observations provide compelling support that it does.”

The scientists studied waveform doublets–earthquakes that are detected at the same seismic recording station in two different places, at two different times. A Sept. 2003, earthquake in the Atlantic Ocean near the South Sandwich Islands that was also detected in Ala., provided a near-exact match with one that had occurred in Dec.1993.

The seismograms were almost identical for shocks that had traveled only in the mantle and outer core. But seismic waves that had traveled through the inner core looked slightly different: they had made the trip through the Earth faster in 2003 than in 1993.

“The similar seismic waves that passed through the inner core show changes in travel times,” says Song. “The only plausible explanation is the faster rotation of the inner core.”

In all, the geologists analyzed 18 “doublets” from the South Sandwich Islands that were detected at Ala. seismic stations between 1961 and 2004.

“For decades, people thought of the Earth’s interior as changing very slowly over millions of years,” said scientist Paul Richards of LDEO, a co-author of the paper. “These results show that we live on a remarkably dynamic planet. They also underscore the fact that we know more about the moon than we know about what’s beneath our feet. Now we need to understand what is driving this difference.”

In addition to Zhang, Song and Richards, co-authors of the paper are Illinois graduate students Yingchun Li and Xinlei Sun and research scientist Felix Waldhauser. The work was also funded by the Natural Science Foundation of China.

Original Source: NSF News Release

Earth’s Climate During the Permian Extinction

Western Hemisphere. Image credit: NASA Click to enlarge
Scientists at the National Center for Atmospheric Research (NCAR) have created a computer simulation showing Earth’s climate in unprecedented detail at the time of the greatest mass extinction in the planet’s history. The work gives support to a theory that an abrupt and dramatic rise in atmospheric levels of carbon dioxide triggered the massive die-off 251 million years ago. The research appears in the September issue of Geology.

“The results demonstrate how rapidly rising temperatures in the atmosphere can affect ocean circulation, cutting off oxygen to lower depths and extinguishing most life,” says NCAR scientist Jeffrey Kiehl, the lead author.

Kiehl and coauthor Christine Shields focused on the dramatic events at the end of the Permian Era, when an estimated 90 to 95% of all marine species, as well as about 70% of all terrestrial species, became extinct. At the time of the event, higher-latitude temperatures were

18 to 54 degrees Fahrenheit (10 to 30 degrees Celsius) higher than today, and extensive volcanic activity had released large amounts of carbon dioxide and sulfur dioxide into the atmosphere over a 700,000-year period.

To solve the puzzle of how those conditions may have affected climate and life around the globe, the researchers turned to the Community Climate System Model (CCSM). One of the world’s premier climate research tools, the model can integrate changes in atmospheric temperatures with ocean temperatures and currents. Research teams had previously studied the Permian extinction with more limited computer models that focused on a single component of Earth’s climate system, such as the ocean.

The CCSM indicated that ocean waters warmed significantly at higher latitudes because of rising atmospheric levels of carbon dioxide (CO2), a greenhouse gas. The warming reached a depth of about 10,000 feet (4,000 meters), interfering with the normal circulation process in which colder surface water descends, taking oxygen and nutrients deep into the ocean.

As a result, ocean waters became stratified with little oxygen, a condition that proved deadly to marine life. This in turn accelerated the warming, since marine organisms were no longer removing carbon dioxide from the atmosphere.

“The implication of our study is that elevated CO2 is sufficient to lead to inhospitable conditions for marine life and excessively high temperatures over land would contribute to the demise of terrestrial life,” the authors concluded in the article.

The CCSM’s simulations showed that ocean circulation was even more stagnant than previously thought. In addition, the research demonstrated the extent to which computer models can successfully simulate past climate events. The CCSM appeared to correctly capture key details of the late Permian, including increased ocean salinity and sea surface temperatures in the high latitudes that paleontologists believe were 14 degrees Fahrenheit (8 degrees Celsius) higher than present.

The modeling presented unique challenges because of limited data and significant geographic differences between the Permian and present-day Earth. The researchers had to estimate such variables as the chemical composition of the atmosphere, the amount of sunlight reflected by Earth’s surface back into the atmosphere, and the movement of heat and salinity in the oceans at a time when all the continents were consolidated into the giant land mass known as Pangaea.

“These results demonstrate the importance of treating Earth’s climate as a system involving physical, chemical , and biological processes in the atmosphere, oceans, and land surface, all acting in an interactive manner,” says Jay Fein, director of NSF’s climate dynamics program, which funded the research. “Other studies have reached similar conclusions. What’s new here is the application of a detailed version of one of the world’s premier climate system models, the CCSM, to understand how rising levels of atmospheric carbon dioxide affected conditions in the world’s oceans and land surfaces enough to trigger a massive extinction hundreds of millions of years ago.”

Original Source: NCAR News Release