QuikScat Captures Images of Melting Ice Shelf

Image credit: NASA

An instrument on board NASA’s Quick Scatterometer spacecraft has detected the earliest melting in Antarctica’s Larsen Ice Shelf. This huge plate of glacier-fed ice has been disintegrating since 1995, losing nearly 10-percent of its size (more than two trillion tonnes of ice), and the most recent chunk disappeared due to a cyclone that sent warm weather into the area.

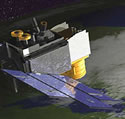
An international research team using data from NASA’s SeaWinds instrument aboard the Quick Scatterometer spacecraft has detected the earliest yet recorded pre-summer melting event in a section of Antarctica’s Larsen Ice Shelf. This huge, nearly 200 meter (656 foot) thick plate of glacier-fed floating ice, which in the late 1980s was about as large as Indiana, experienced dramatic disintegration events beginning in 1995 that have reduced its area by nearly 10 percent, or more than two trillion tons of ice.

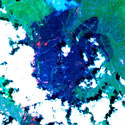
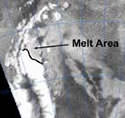
Researchers Dr. Mark Drinkwater of the European Space Agency, Dr. David Long of Brigham Young University and Dr. Steve Harangozo of the British Antarctic Survey used near real time Quick Scatterometer (QuikScat) data to document a rapid, extensive melting of the Larsen C Ice Shelf in Antarctica’s Weddell Sea from Oct. 27 to Oct. 29, 2002. The melting, which extended to 68 degrees south, was triggered by a mid-latitude cyclone that delivered warm air to the region. The same storm is believed to have also caused a noticeable recession in the sea-ice margin to the west of the Antarctic Peninsula. The QuikScat images are available at: http://photojournal.jpl.nasa.gov/catalog/PIA03894

Air temperatures in the region typically exceed freezing for a few days on or after November 1 each year-a precursor to sustained summer melting that normally sets in several weeks later at these latitudes. The cumulative duration of these annual summer melting events is likely to have increased substantially over the past 50 years as summer average air temperatures on the eastern side of the Antarctic Peninsula have warmed appreciably (approximately two degrees Celsius, or 3.6 degrees Fahrenheit). Scientists believe these events are responsible for the previous breakups of Larsen and other ice shelves. Therefore, the ability to observe such events in near real time using scatterometers is of great interest to researchers, since they may provide invaluable clues to the fate of other, much larger Antarctic ice shelves.

While scientists used to believe there was no connection between recent Antarctic Peninsula warming and the natural cycle of deglaciation, recent field measurements provide some evidence to suggest the frequency of summer melting, and the resulting quantities of melt water penetrating ice shelves, may be connected with the accelerated disintegration of Larsen and other Antarctic ice shelves.

“The water is believed to penetrate cracks and fissures in the ice and refreeze at depth, where the ice is relatively colder,” said Drinkwater. “As the ice expands, this process effectively drives a wedge into existing cracks to accelerate the natural fracture process.”

Scatterometers operate by transmitting high-frequency microwave pulses to Earth’s surface and measuring the “backscattered,” or echoed, radar pulses bounced back to the satellite. Moshe Pniel, scatterometer projects manager at NASA’s Jet Propulsion Laboratory, Pasadena, Calif., which developed and manages the instruments, said scatterometers such as SeaWinds on QuikScat and a similar SeaWinds instrument on Japan’s recently launched Advanced Earth Observing Satellite 2 (Adeos 2), are proving to be increasingly important in monitoring land and ice processes.

“Scatterometers can effectively and quickly detect the difference between melting and dry surfaces,” he said. “They provide an important new tool in our capability to monitor climate change impacts on the Antarctic ice cover on a daily basis. These scatterometer data are vital in the southern hemisphere because near real time synthetic aperture radar data is not available there on a frequent, uninterrupted basis. QuikScat measurements being compiled and archived in the Scatterometer Climate Record Pathfinder study by Long and Drinkwater (http://www.scp.byu.edu) enable critical assessments of the links between changes taking place in global ice cover and associated changes in important elements of Earth’s closely-linked ocean-atmosphere climate system.”

QuikScat measurements and image data developed by Long are processed and distributed in near real time by the National Oceanic and Atmospheric Administration, providing scientists at the British Antarctic Survey and elsewhere with rapid access to low-resolution radar data that can be used to report melt events. The British Antarctic Survey compiles and distributes Antarctic Meteorological Station data in near real time.

More information about SeaWinds is available at: http://winds.jpl.nasa.gov/index.html.

NASA’s Earth Science Enterprise is a long-term research effort to understand and protect our home planet. The California Institute of Technology in Pasadena manages JPL for NASA.

Original Source: NASA/JPL News Release

ICESat Launches

Image credit: NASA

A satellite designed to track the changes in the Earth’s major ice sheets was launched on Sunday after experiencing a month of delays due to technical difficulties. ICESsat (Ice Cloud and Land Elevation
Satellite) was launched aboard a Boeing Delta rocket from the Vandenberg US Air Force Base in California. On board the rocket was another, smaller satellite called CHIPSat, which will help astronomers study the hot gas coming off of stars.

NASA?s Ice, Cloud and Land Elevation satellite (ICESat) and Cosmic Hot Interstellar Spectrometer (CHIPS) satellite lifted off from Vandenberg Air Force Base, Calif., at 4:45 p.m. PST aboard Boeing?s Delta II rocket. Separation of the ICESat spacecraft occurred 64 minutes after launch at 5:49 p.m. PST. Initial contact with ICESat was made 75 minutes after launch at 6 p.m. PST as the spacecraft passed over the Svalbard Ground Station in Norway.

The CHIPS spacecraft separated from the launch vehicle 83 minutes after launch at 6:08 p.m. PST. Initial contact with CHIPS was made 98 minutes after launch at 6:23 p.m. PST as the spacecraft passed over the University of California, Berkeley.

?The Delta vehicle gave us a great ride! The ICESat spacecraft was right where we expected and is performing great. The whole team is thrilled to be having such a wonderful start to our mission? said Jim Watzin, the ICESat Project Manager at NASA?s Goddard Space Flight Center in Greenbelt, Md.

Over the next few days the ICESat spacecraft will gradually be despun and placed into a safe stable attitude. Within two weeks the onboard propulsion system will gradually tune the orbit. Once in its final orbital position, ICESat will be approximately 373 miles (600 kilometers) above the Earth.

ICESat is the latest in a series of Earth Observing System spacecraft, following the Terra satellite launched in December 1999, and the Aqua satellite launched earlier in May of this year. The primary role of ICESat is to quantify ice sheet growth or retreat and to thereby answer questions concerning many related aspects of the Earth?s climate system, including global climate change and changes in sea level.

Ball Aerospace and Technologies Corporation (Ball) in Boulder, Colorado built the ICESat spacecraft. The Earth Science Data and Information System at NASA Goddard will provide space and ground network support and the University of Colorado?s Laboratory for Atmospheric and Space Physics will team with Ball to provide mission operations and flight dynamics support. The GLAS and ICESat data will be initially processed at the ICESat Investigator-led Processing System with support from the University of Texas, Center for Space Research. The mission data will be distributed and archived by the National Snow and Ice Data Center.

Original Source: NASA News Release

Grace Maps the Earth’s Gravitational Field

The US-German Gravity Recovery and Climate Experiment mission (aka Grace) has taken the last two weeks to produce the most detailed map of the Earth’s gravitational field – lumps and all. Launched in March, the twin spacecraft have been orbiting the planet 16 times a day, 220 km apart from one another. A ground-based microwave ranging system measures the distance between them to see how they speed up and slow down due to changes in gravity. And this is just the low res version; scientists hope to have even more detailed maps by the end of the year.

View of Colorado Fire from Space

Image credit: NASA

A new photo released from NASA’s Terra spacecraft shows the huge swath of destruction caused by the enormous fire in Colorado. The fire started on June 8, and has gone on to destroy more than 40,000 hectares. The image was acquired using Terra’s Advanced Spaceborne Thermal Emission and Reflection Radiometer (Aster), one of five Earth imaging instruments on board the spacecraft. This photo was taken on morning of Sunday, June 16.

Thousands of acres of burned vegetation, along with recent hotspots, are visible in a new image of Colorado’s worst forest fire taken by NASA’s Advanced Spaceborne Thermal Emission and Reflection Radiometer (Aster).

Started on June 8, the Hayman forest fire continues to burn in the Pike National Forest, 57 kilometers (35 miles) south-southwest of Denver, Colo. According to the U.S. Forest Service, the fire has consumed more than 100,000 acres.

The image is available at:

http://www.jpl.nasa.gov/images/earth/usa/west.html.

Acquired Sunday morning, June 16, 2002, the Aster image shows active fires in red. The dark blue area is burned vegetation, and the green areas are healthy vegetation. Clouds are white. The blue cloud at the top center is smoke. The image covers an area of 32.2 by 35.2 kilometers (20 by 21.8 miles).

Aster is one of five Earth-observing instruments launched in December 1999 on NASA’s Terra satellite. With its 14 spectral bands from the visible to the thermal infrared wavelength region and its high spatial resolution of 15 to 90 meters (about 50 to 300 feet), Aster will image Earth for the next six years to map and monitor the planet’s changing surface. Japan’s Ministry of Economy, Trade and Industry built the instrument. NASA’s Jet Propulsion Laboratory, Pasadena, Calif., is responsible for the American portion of the joint U.S./Japan science team that validates and calibrates the instrument and the data products.

Original Source: NASA/JPL News Release

Chinese Dust Disaster Imaged From Space

Image credit: NASA

NASA’s Terra Earth Observing Satellite was on hand this week to record some of the worst dust storms to hit China’s Inner Mongolian and Shanxi Provinces in ten years. The photo on the left shows a relatively clear day, while the one on the right is obscured by a yellowish cloud of dust. Each image was captured by the spacecraft’s Multi-angle Imaging SpectroRadiometer, and represents an area of 380 km x 630 km.

Dust covered northern China earlier this week during some of the worst dust storms to hit the region in a decade. The dust obscuring China’s Inner Mongolian and Shanxi Provinces on March 24 is compared with a relatively clear day (October 31, 2001) in these images from the Multi-angle Imaging SpectroRadiometer’s vertical-viewing (nadir) camera aboard NASA’s Terra Earth Observing Spacecraft. Each image represents an area of about 380 by 630 kilometers (236 by 391 miles).

The images are available at:

http://www.jpl.nasa.gov/images/earth/asia.

In the image from late March, shown on the right, wave patterns in the yellowish cloud liken the storm to an airborne ocean of dust. The veil of particulates obscures features on the surface north of the Yellow River (visible in the lower left). The area shown lies near the edge of the Gobi desert, a few hundred kilometers, or miles, west of Beijing. Dust originates from the desert and travels east across northern China toward the Pacific Ocean. For especially severe storms, fine particles can travel as far as North America.

The Multi-angle Imaging SpectroRadiometer, built and managed by NASA’s Jet Propulsion Laboratory, Pasadena, Calif., is one of five Earth-observing experiments aboard the Terra satellite, launched in December 1999. The instrument acquires images of Earth at nine angles simultaneously, using nine separate cameras pointed forward, downward and backward along its flight path. The change in reflection at different view angles affords the means to distinguish different types of atmospheric particles, cloud forms and land surface covers. More information is available at:

http://www-misr.jpl.nasa.gov.

NASA’s Earth Science Enterprise is a long-term research and technology program designed to examine Earth’s land, oceans, atmosphere, ice and life as a total integrated system.

JPL is a division of the California Institute of Technology in Pasadena.

Original Source: NASA News Release

Envisat Begins Study of Earth’s Environment

The European Space Agency’s recently-launched Envisat began its ten year mission last week to gauge the health of planet Earth. The $2.2 billion, 9 ton satellite successfully turned on all ten of its scientific instruments and took some high-quality images of the break-up of the Larson B ice shelf in Antarctica. Another instrument captured images of photosynthetic plankton near the coast of Mauritania in northwest Africa.

Entire Earth Imaged

NASA has released a new set of photographs which form the most detailed true-colour image of the entire Earth ever created. The photographs are taken at a resolution of 1km and include the land, seas and even clouds and sea ice. Much of the data for this image was gathered by NASA’s Terra satellite, from an altitude of 700km. An additional image shows actual city lights superimposed over a darkened version of the photograph.

Spacecraft Image Volcano Disaster From Orbit

Three NASA spacecraft chronicled the devastation that occurred when the Nyiragongo volcano in Congo erupted on January 17th. The eruption killed more than 100 people and forced hundreds of thousands to evacuate the area. These newly released images were created using data taken from a space shuttle radar mapping mission, Landsat photographs, and the Terra spacecraft.