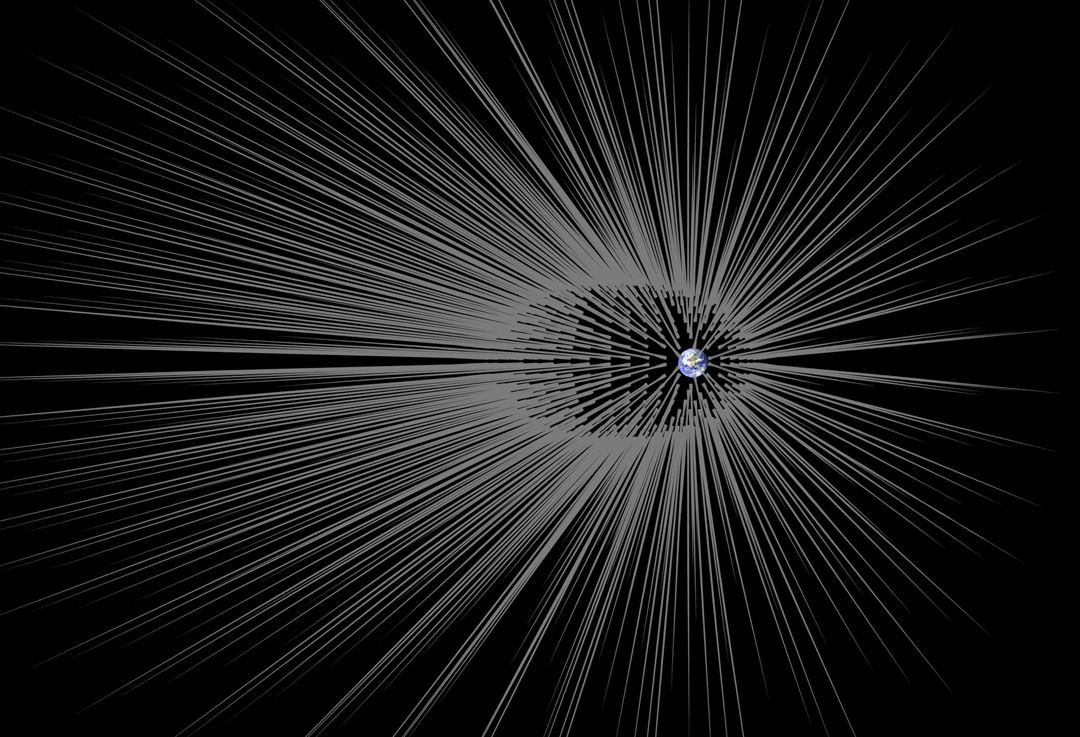
This illustration shows Earth surrounded by filaments of dark matter called “hairs. A hair is created when a stream of dark matter particles goes through the planet. A new study proposes that Earth and the other planets are filled with “hair”. Credit: NASA/JPL-Caltech
I’m losing mine, but the Solar System may be way hairier than we ever thought, with thick crops of filamentary dark matter streaming through Earth’s core and back out again even as you read this.
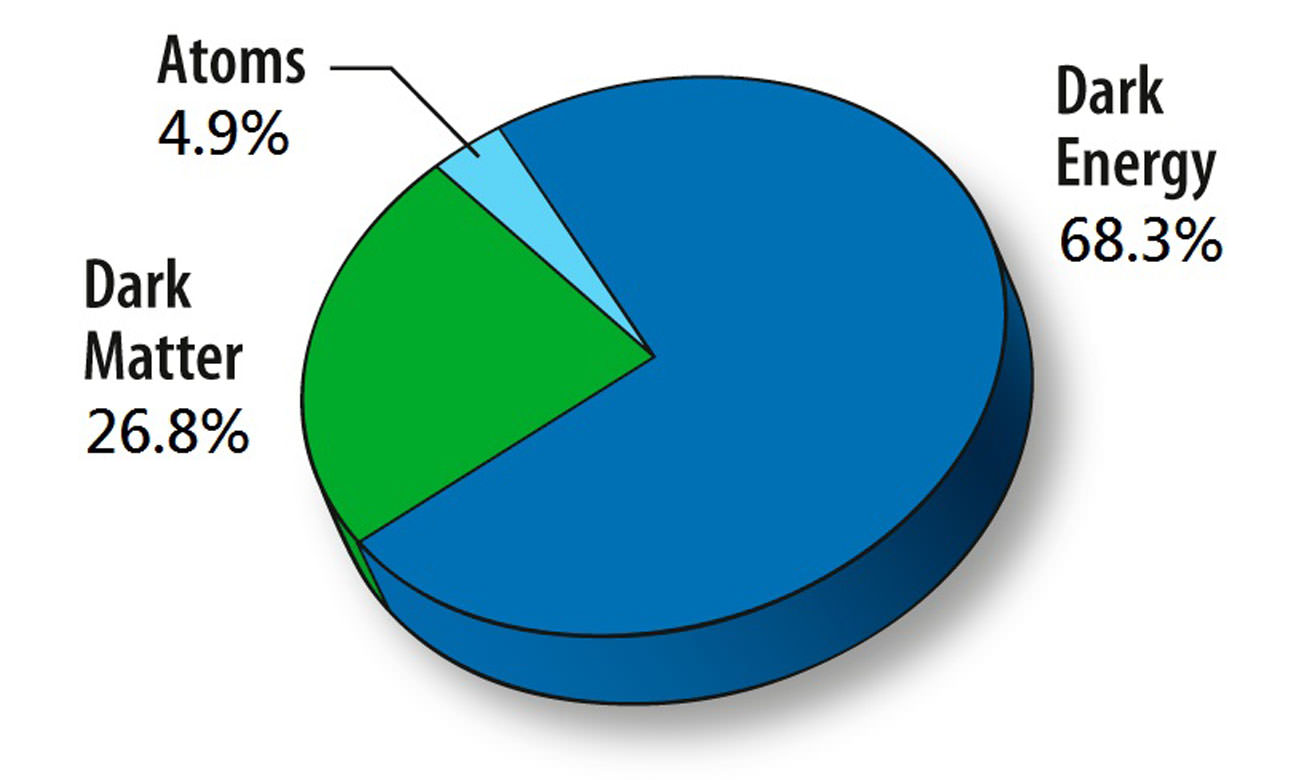
Estimated distribution of matter and energy in the universe. Credit: NASA
A new study publishing this week in the Astrophysical Journal by Gary Prézeau of NASA’s Jet Propulsion Laboratory proposes the existence of long filaments of dark matter, or “hairs.” Dark matter is a hypothetical form of matter that emits no light, thereby resisting our attempts to see and photograph it, but based on many observations of its gravitational pull on ordinary matter, astronomers have measured the amount of dark matter to an accuracy of 1%.
Massive amounts of it formed a tangled web of filaments after the Big Bang and ensuing epoch of cosmic inflation that served as sites for the “condensation” of bright matter galaxies. We likely owe our existence to this stuff, whatever it is, which has yet to be directly detected. Along with dark energy, it remains one of the greatest mysteries of our age.
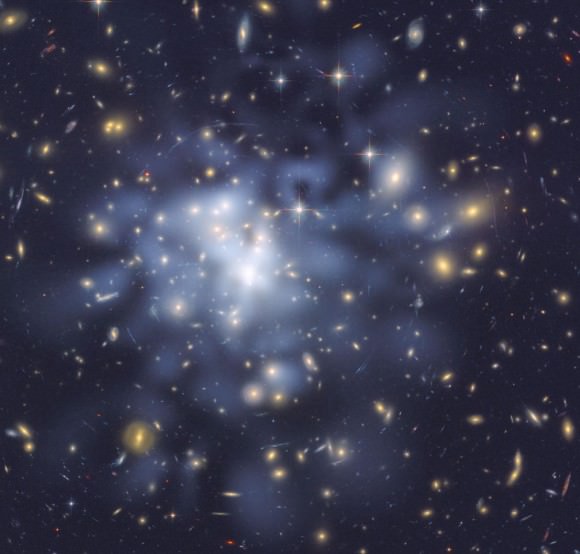
This Hubble image shows the distribution of dark matter in the center of the giant galaxy cluster Abell 1689, containing about 1,000 galaxies and trillions of stars. Researchers used the observed positions of 135 lensed images of 42 background galaxies to calculate the location and amount of dark matter in the cluster. They superimposed a map of these inferred dark matter concentrations, tinted blue, on an image of the cluster. The greastest concentration of dark matter is in the cluster’s center. Credit: NASA, ESA, D. Coe, N. Benitez , T. Broadhurst
As if that weren’t enough, dark matter comprises 85% of all the known matter reserves in the universe and 27% of the entire matter-energy cosmic budget. Ordinary stuff like stars, baseball bats and sushi constitute just 4.9% of the the total. The leading theory is that dark matter is “cold,” meaning it moves slowly compared to the speed of light, and it’s “dark” because it doesn’t produce or interact with light. The axion, a hypothetical elementary particle, appears to be good candidate for dark matter as do WIMPs or weakly interacting massive particles, but again, these exist only on paper.
According to calculations done in the 1990s and simulations performed in the last decade, dark matter forms “fine-grained streams” of particles that move at the same velocity and orbit galaxies such as ours. Streams can be much larger than our Solar System and criss-cross the galaxy. Prézeau compares the formation of fine-grained streams of dark matter to mixing chocolate and vanilla ice cream. Swirl a scoop of each together a few times and you get a mixed pattern, but you can still see the individual colors.
“When gravity interacts with the cold dark matter gas during galaxy formation, all particles within a stream continue traveling at the same velocity,” Prézeau said.
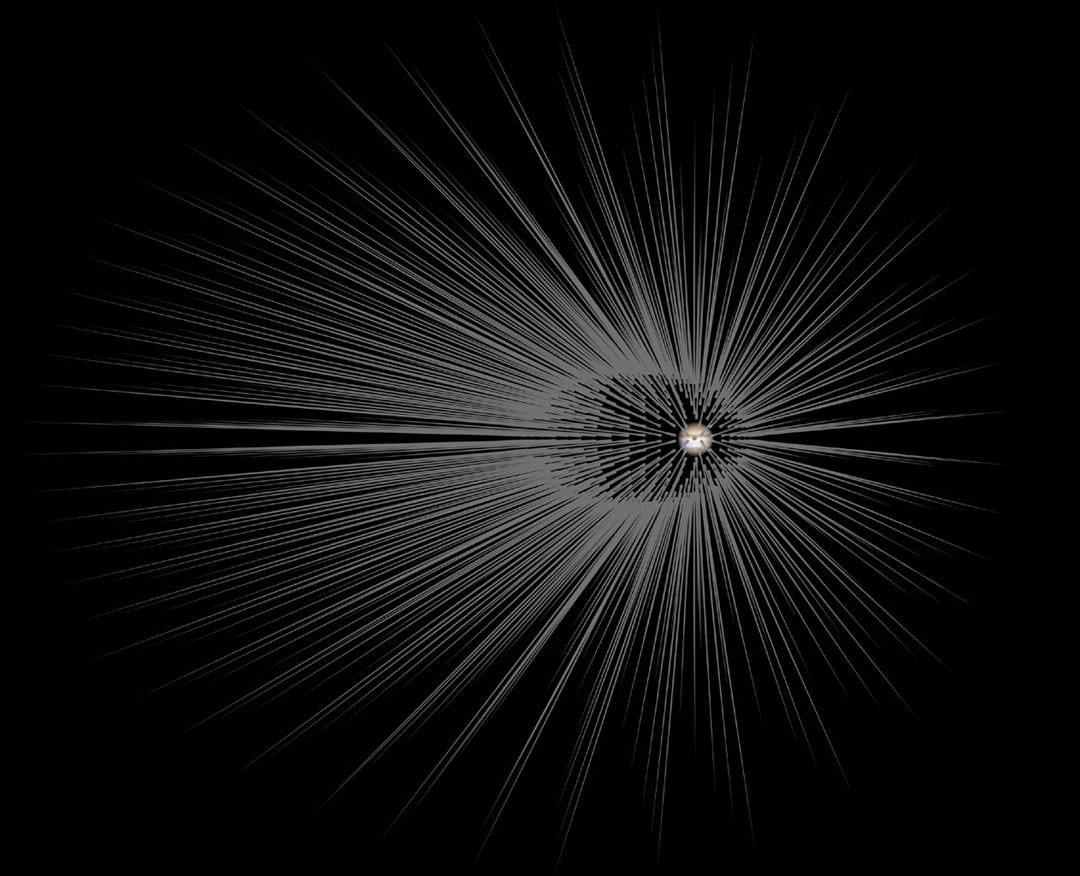
This illustration zooms in to show what dark matter hairs would look like around Earth. The hairs in this illustration are not to scale. Simulations show that the roots of such hairs can be 600,000 miles (1 million km) from Earth. Credit: NASA /JPL-Caltech
But a different scenario unfolds when a stream passes by an obstacle like the Earth or a moon. Prézeau used computer simulations to discover that when dark matter stream passes through a planet — dark matter passes right through us unlike ordinary matter — it’s focused into an ultra-dense filament or hair. Not a solo strand but a luxuriant crop bushy as a brewer’s beard.
According to Prézeau, hairs emerging from planets have both “roots,” the densest concentration of dark matter particles in the hair, and “tips,” where the hair ends. When particles of a dark matter stream pass through Earth’s core, they focus at the “root” of a hair, where the density of the particles is about a billion times more than average. The root of such a hair should be around 600,000 miles (1 million km) away from the surface, or a little more than twice as far as the moon. The stream particles that graze Earth’s surface will form the tip of the hair, about twice as far from Earth as the hair’s root.
The root of a dark matter hair produced from particles going through Jupiter’s core would be about 1 trillion times denser than average. Credit: NASA/JPL-Caltech
A stream passing through more massive Jupiter would have roots a trillion times denser than the original stream. Naturally, these dense concentrations would make ideal places to send a probe to study dark matter right here in the neighborhood.
The computer simulations reveal that changes in Earth’s density from inner core to outer core to mantle and crust are reflected in the shape of the hairs, showing up as “kinks” that correspond to transitions from one zone to the next. If it were possible to get our hands on this kind of information, we could use it to map to better map Earth’s interior and even the depth of oceans inside Jupiter’s moon Europa and Saturn’s Enceladus.
Earth getting its roots done. What’ll they think of next?
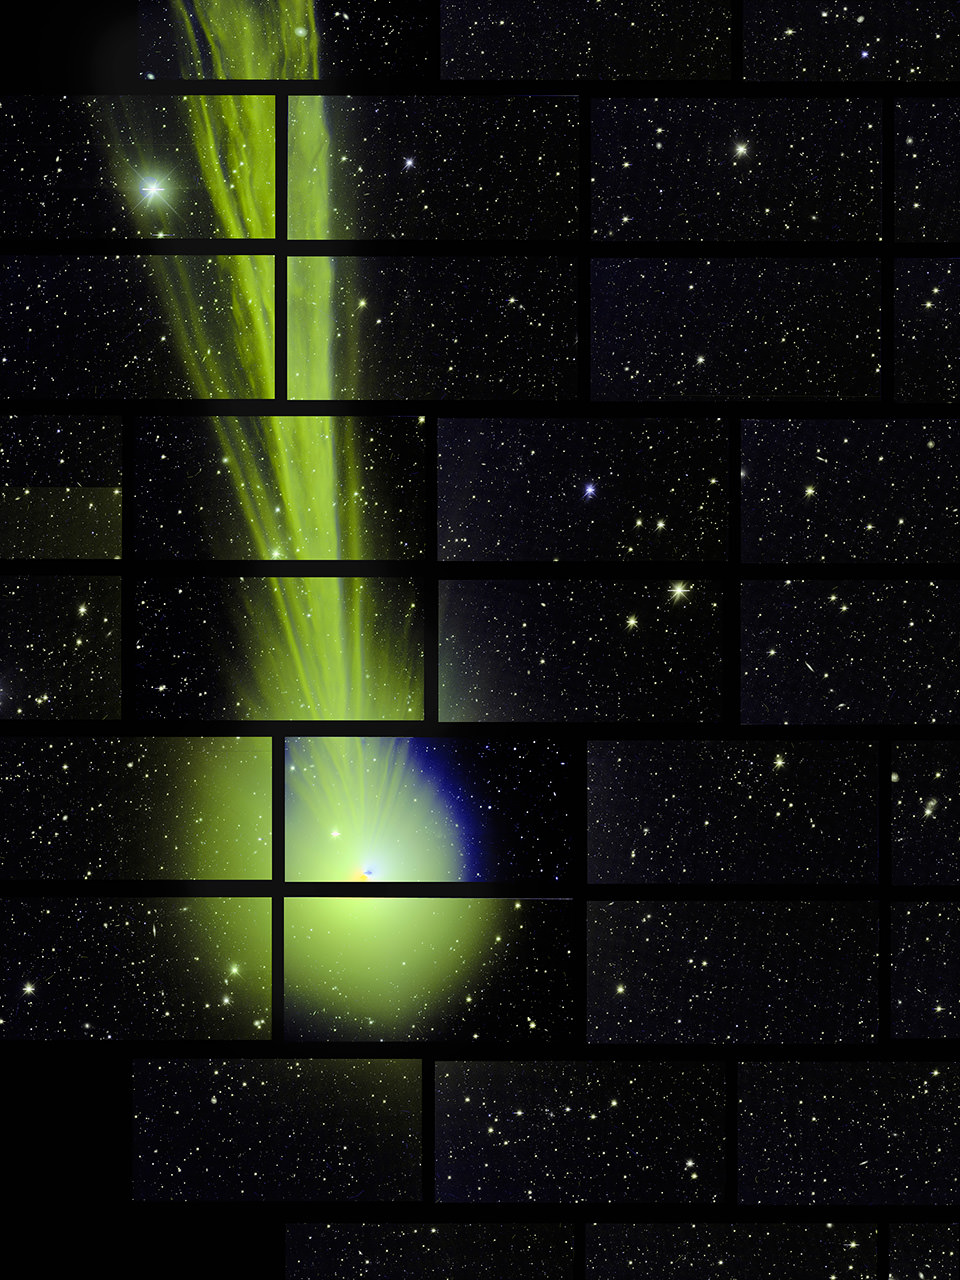
Comet 2014 Q2 Lovejoy on December 27, 2014, as seen by the Dark Energy Survey. Credit: Fermilab’s Marty Murphy, Nikolay Kuropatkin, Huan Lin and Brian Yanny.
Oops! In a happy accident, Comet Lovejoy just happened to be in the field of view of the 570-megapixel Dark Energy Camera, the world’s most powerful digital camera. One member of the observing team said it was a “shock” to see Comet Lovejoy pop up on the display in the control room.
“It reminds us that before we can look out beyond our Galaxy to the far reaches of the Universe, we need to watch out for celestial objects that are much closer to home!” wrote the team on the Dark Energy Detectives blog.
On December 27, 2014, while the Dark Energy Survey was scanning the southern sky, C2014 Q2 entered the camera’s view. Each of the rectangular shapes above represents one of the 62 individual fields of the camera.
At the time this image was taken, the comet was passing about 82 million km (51 million miles) from Earth. That’s a short distance for the Dark Energy Camera, which is sensitive to light up to 8 billion light years away. The comet’s center is likely made of rock and ice and is roughly 5 km (3 miles) across. The visible coma of the comet is a cloud of gas and dust about 640,000 km (400,000 miles) in diameter.
The Dark Energy Survey (DES) is designed to probe the origin of the accelerating universe and help uncover the nature of dark energy by measuring the 14-billion-year history of cosmic expansion with high precision.
The camera just finished up the third, six-month-long season of observations, and the camera won’t be observing again until this fall.
You can download higher resolution versions of this image here.
Cosmologists are intellectual time travelers. Looking back over billions of years, these scientists are able to trace the evolution of our Universe in astonishing detail. 13.8 billion years ago, the Big Bang occurred. Fractions of a second later, the fledgling Universe expanded exponentially during an incredibly brief period of time called inflation. Over the ensuing eons, our cosmos has grown to such an enormous size that we can no longer see the other side of it.
But how can this be? If light’s velocity marks a cosmic speed limit, how can there possibly be regions of spacetime whose photons are forever out of our reach? And even if there are, how do we know that they exist at all?
The Expanding Universe
Like everything else in physics, our Universe strives to exist in the lowest possible energy state possible. But around 10-36 seconds after the Big Bang, inflationary cosmologists believe that the cosmos found itself resting instead at a “false vacuum energy” – a low-point that wasn’t really a low-point. Seeking the true nadir of vacuum energy, over a minute fraction of a moment, the Universe is thought to have ballooned by a factor of 1050.
Since that time, our Universe has continued to expand, but at a much slower pace. We see evidence of this expansion in the light from distant objects. As photons emitted by a star or galaxy propagate across the Universe, the stretching of space causes them to lose energy. Once the photons reach us, their wavelengths have been redshifted in accordance with the distance they have traveled.
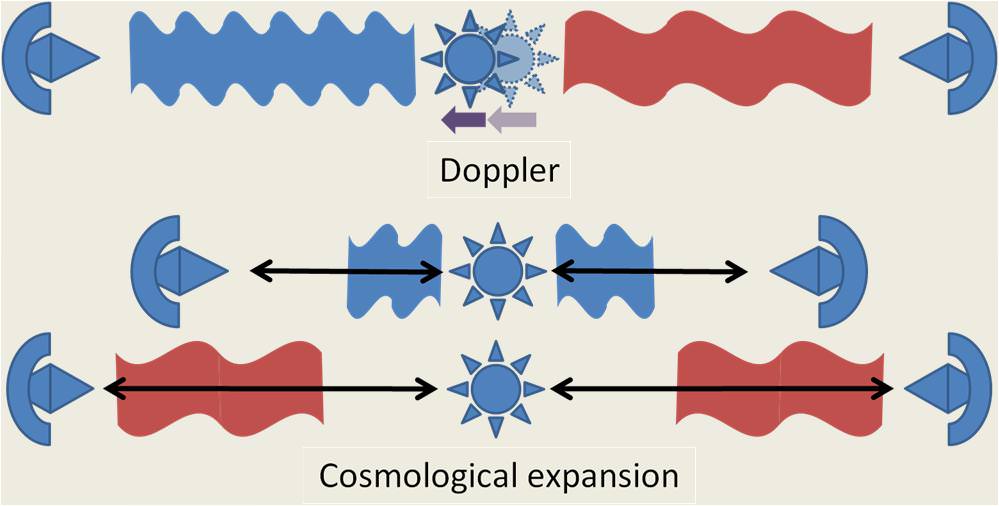
Two sources of redshift: Doppler and cosmological expansion; modeled after Koupelis & Kuhn. Bottom: Detectors catch the light that is emitted by a central star. This light is stretched, or redshifted, as space expands in between. Credit: Brews Ohare.
This is why cosmologists speak of redshift as a function of distance in both space and time. The light from these distant objects has been traveling for so long that, when we finally see it, we are seeing the objects as they were billions of years ago.
The Hubble Volume
Redshifted light allows us to see objects like galaxies as they existed in the distant past; but we cannot see all events that occurred in our Universe during its history. Because our cosmos is expanding, the light from some objects is simply too far away for us ever to see.
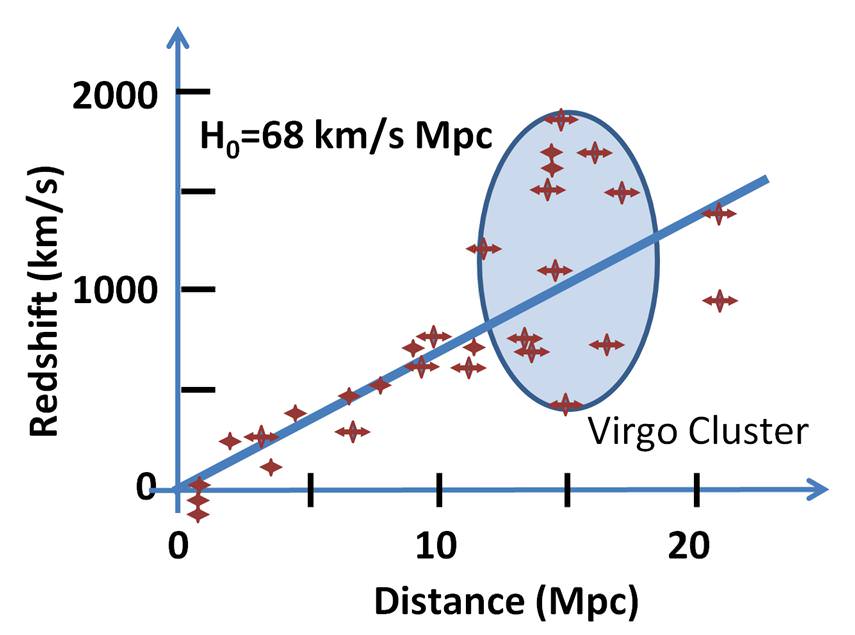
The physics of that boundary rely, in part, on a chunk of surrounding spacetime called the Hubble volume. Here on Earth, we define the Hubble volume by measuring something called the Hubble parameter (H0), a value that relates the apparent recession speed of distant objects to their redshift. It was first calculated in 1929, when Edwin Hubble discovered that faraway galaxies appeared to be moving away from us at a rate that was proportional to the redshift of their light.
Fit of redshift velocities to Hubble’s law. Credit: Brews Ohare
Dividing the speed of light by H0, we get the Hubble volume. This spherical bubble encloses a region where all objects move away from a central observer at speeds less than the speed of light. Correspondingly, all objects outside of the Hubble volume move away from the center faster than the speed of light.
Yes, “faster than the speed of light.” How is this possible?
The Magic of Relativity
The answer has to do with the difference between special relativity and general relativity. Special relativity requires what is called an “inertial reference frame” – more simply, a backdrop. According to this theory, the speed of light is the same when compared in all inertial reference frames. Whether an observer is sitting still on a park bench on planet Earth or zooming past Neptune in a futuristic high-velocity rocketship, the speed of light is always the same. A photon always travels away from the observer at 300,000,000 meters per second, and he or she will never catch up.
General relativity, however, describes the fabric of spacetime itself. In this theory, there is no inertial reference frame. Spacetime is not expanding with respect to anything outside of itself, so the the speed of light as a limit on its velocity doesn’t apply. Yes, galaxies outside of our Hubble sphere are receding from us faster than the speed of light. But the galaxies themselves aren’t breaking any cosmic speed limits. To an observer within one of those galaxies, nothing violates special relativity at all. It is the space in between us and those galaxies that is rapidly proliferating and stretching exponentially.
The Observable Universe
Now for the next bombshell: The Hubble volume is not the same thing as the observable Universe.
To understand this, consider that as the Universe gets older, distant light has more time to reach our detectors here on Earth. We can see objects that have accelerated beyond our current Hubble volume because the light we see today was emitted when they were within it.
Strictly speaking, our observable Universe coincides with something called the particle horizon. The particle horizon marks the distance to the farthest light that we can possibly see at this moment in time – photons that have had enough time to either remain within, or catch up to, our gently expanding Hubble sphere.
And just what is this distance? A little more than 46 billion light years in every direction – giving our observable Universe a diameter of approximately 93 billion light years, or more than 500 billion trillion miles.
The observable universe, more technically known as the particle horizon.
(A quick note: the particle horizon is not the same thing as the cosmological event horizon. The particle horizon encompasses all the events in the past that we can currently see. The cosmological event horizon, on the other hand, defines a distance within which a future observer will be able to see the then-ancient light our little corner of spacetime is emitting today.
In other words, the particle horizon deals with the distance to past objects whose ancient light that we can see today; the cosmological event horizon deals with the distance that our present-day light that will be able to travel as faraway regions of the Universe accelerate away from us.)
Dark Energy
Thanks to the expansion of the Universe, there are regions of the cosmos that we will never see, even if we could wait an infinite amount of time for their light to reach us. But what about those areas just beyond the reaches of our present-day Hubble volume? If that sphere is also expanding, will we ever be able to see those boundary objects?
This depends on which region is expanding faster – the Hubble volume or the parts of the Universe just outside of it. And the answer to that question depends on two things: 1) whether H0 is increasing or decreasing, and 2) whether the Universe is accelerating or decelerating. These two rates are intimately related, but they are not the same.
In fact, cosmologists believe that we are actually living at a time when H0 is decreasing; but because of dark energy, the velocity of the Universe’s expansion is increasing.
That may sound counterintuitive, but as long as H0 decreases at a slower rate than that at which the Universe’s expansion velocity is increasing, the overall movement of galaxies away from us still occurs at an accelerated pace. And at this moment in time, cosmologists believe that the Universe’s expansion will outpace the more modest growth of the Hubble volume.
So even though our Hubble volume is expanding, the influence of dark energy appears to provide a hard limit to the ever-increasing observable Universe.
Our Earthly Limitations
Cosmologists seem to have a good handle on deep questions like what our observable Universe will someday look like and how the expansion of the cosmos will change. But ultimately, scientists can only theorize the answers to questions about the future based on their present-day understanding of the Universe. Cosmological timescales are so unimaginably long that it is impossible to say much of anything concrete about how the Universe will behave in the future. Today’s models fit the current data remarkably well, but the truth is that none of us will live long enough to see whether the predictions truly match all of the outcomes.
Disappointing? Sure. But totally worth the effort to help our puny brains consider such mind-bloggling science – a reality that, as usual, is just plain stranger than fiction.
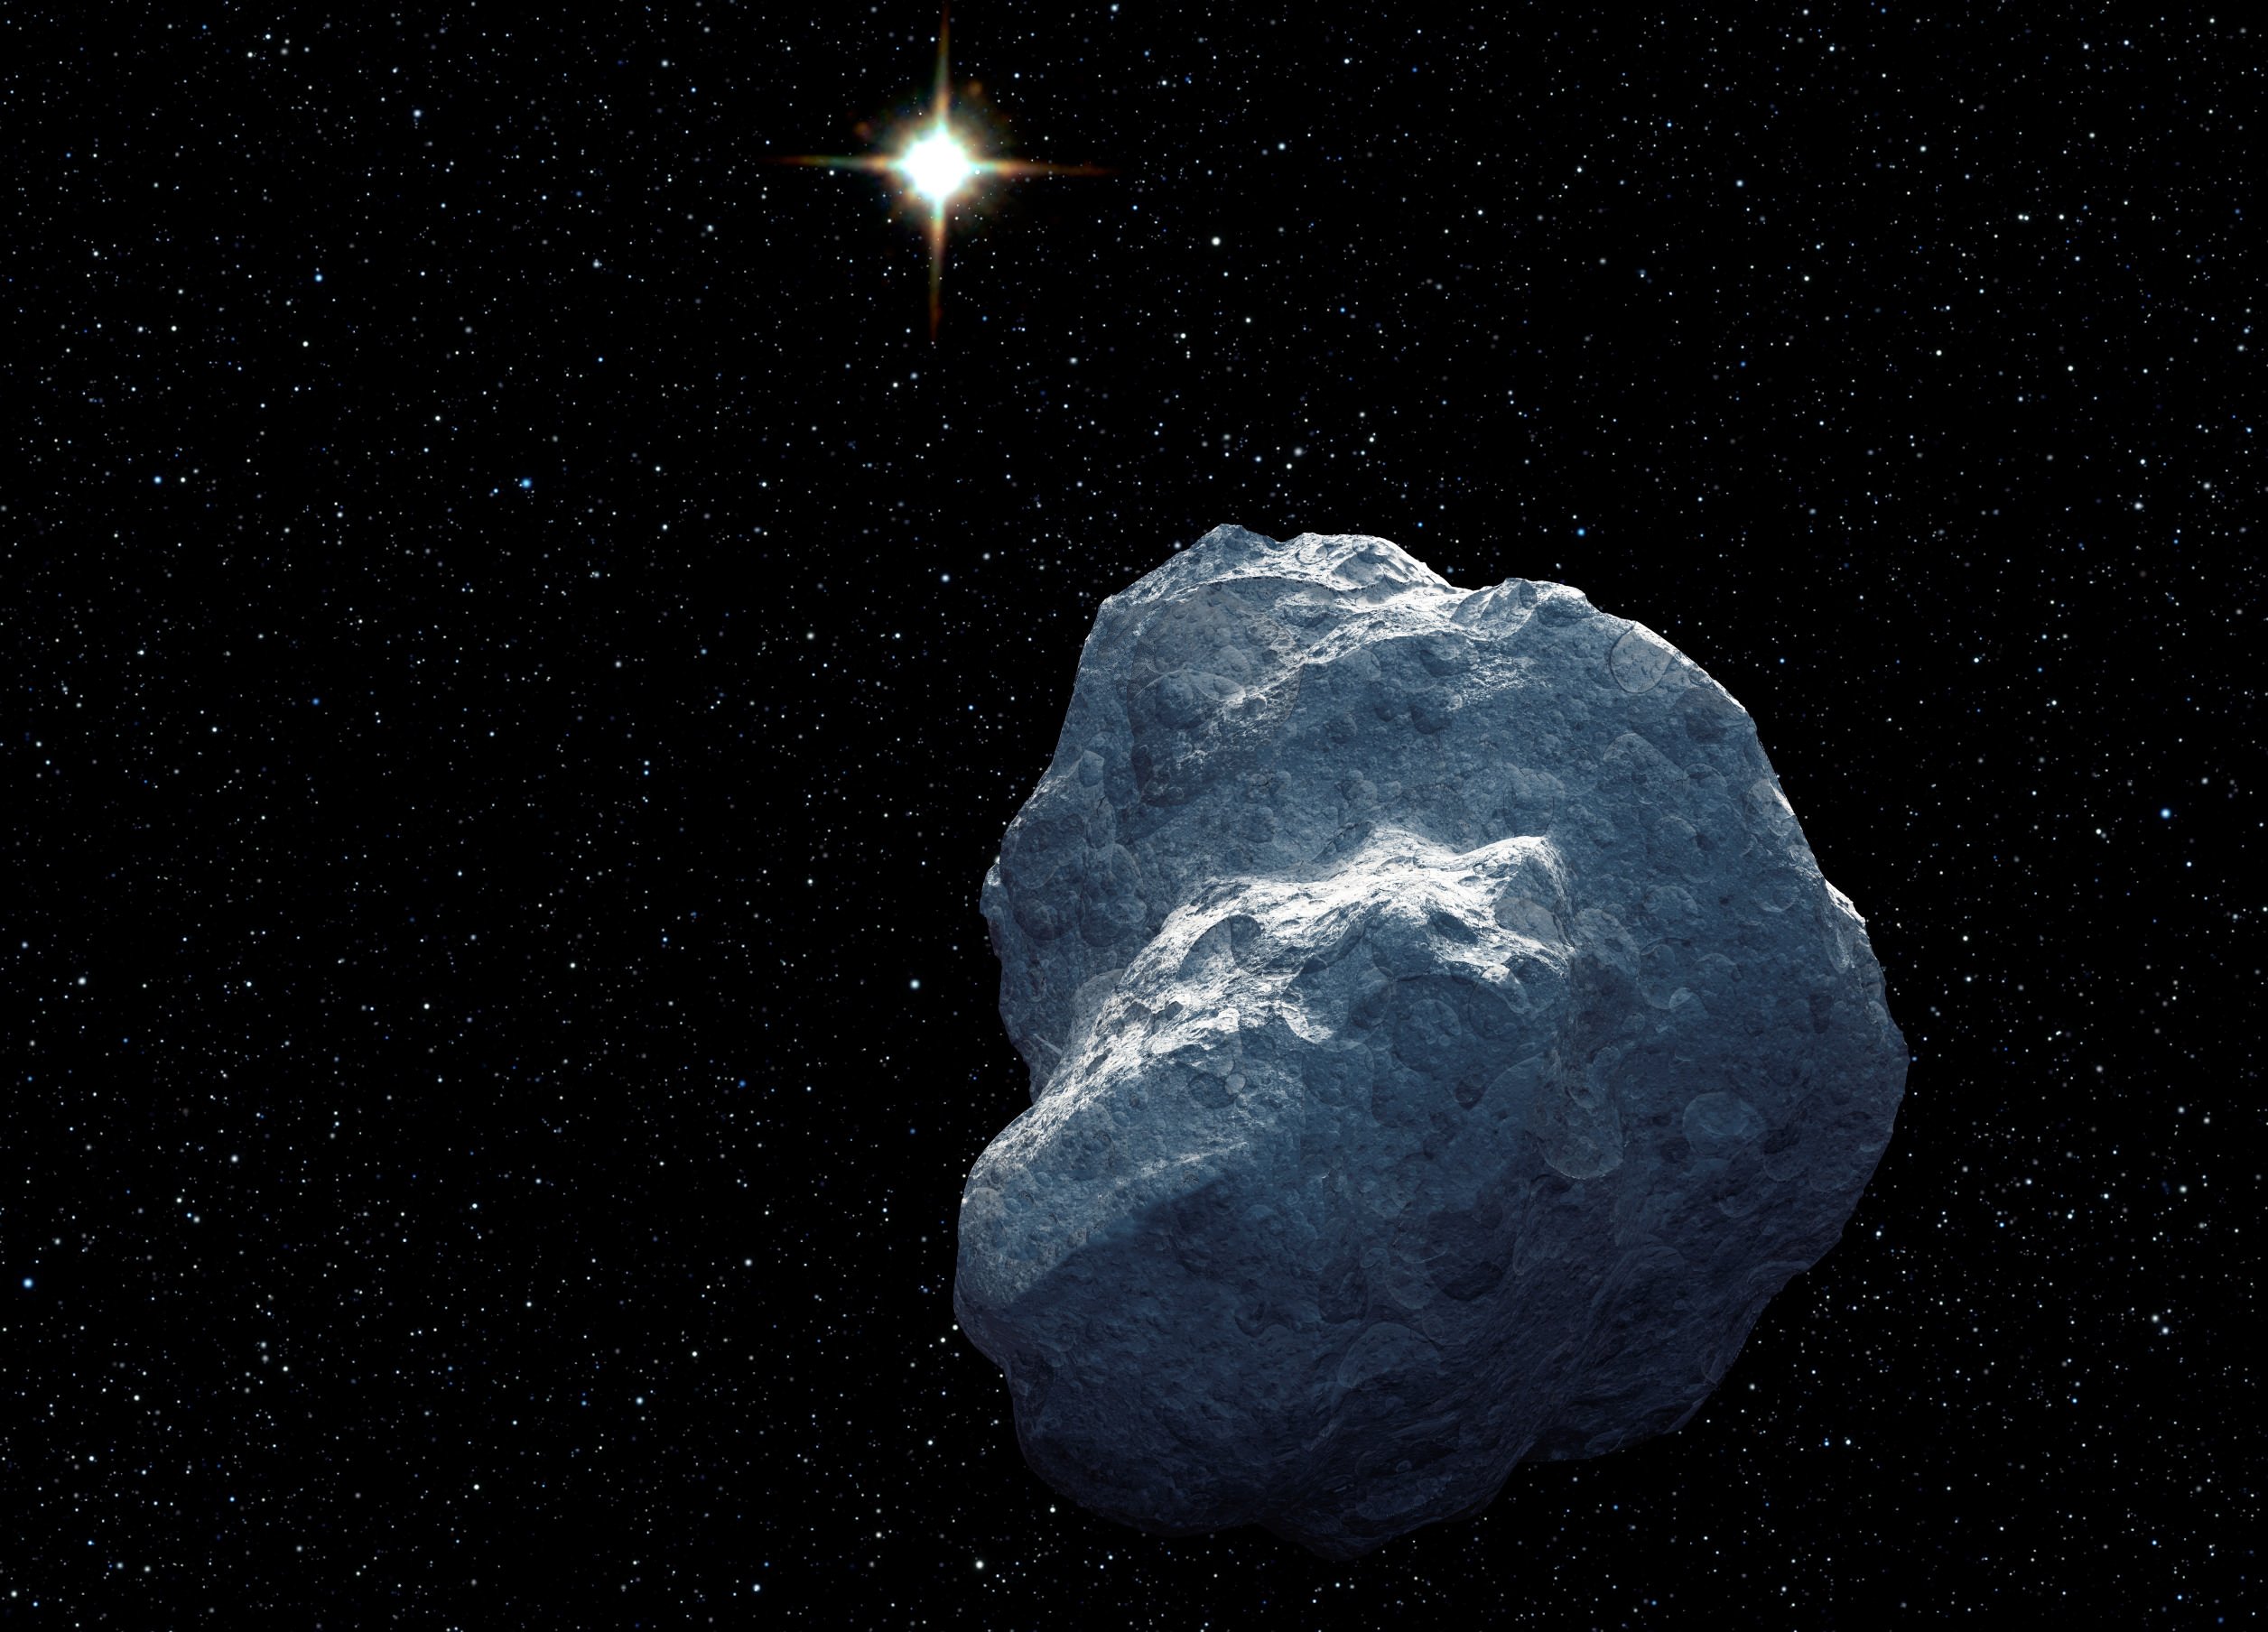
An artist's concept of a trans-Neptunian object(TNOs). The distant sun is reduced to a bright star at a distance of over 3 billion miles. The Dark Energy Survey (DES) has now released discovery of more TNOs. (Illustration Credit: NASA)
Sometimes when you stare at something long enough, you begin to see things. This is not the case with optical sensors and telescopes. Sure, there is noise from electronics, but it’s random and traceable. Stargazing with a telescope and camera is ideal for staring at the same patches of real estate for very long and repeated periods. This is the method used by the Dark Energy Survey (DES), and with less than one percent of the target area surveyed, astronomers are already discovering previously unknown objects in the outer Solar System.
The Dark Energy Survey is a five year collaborative effort that is observing Supernovae to better understand the structures and expansion of the universe. But in the meantime, transient objects much nearer to home are passing through the fields of view. Trans-Neptunian Objects (TNOs), small icy worlds beyond the planet Neptune, are being discovered. A new scientific paper, released as part of this year’s American Astronomical Society gathering in Seattle, Washington, discusses these newly discovered TNOs. The lead authors are two undergraduate students from Carleton College of Northfield, Minnesota, participating in a University of Michigan program.
The Palomar Sky Survey (POSS-1, POSS-2), the Sloan Digital Sky Survey, and every other sky survey have mapped not just the static, nearly unchanging night sky, but also transient events such as passing asteroids, comets, or novae events. The Dark Energy Survey is looking at the night sky for structures and expansion of the Universe. As part of the five year survey, DES is observing ten select 3 square degree fields for Type 1a supernovae on a weekly basis. As the survey proceeds, they are getting more than anticipated. The survey is revealing more trans-Neptunian objects. Once again, deep sky surveys are revealing more about our local environment – objects in the farther reaches of our Solar System.
DES is an optical imaging survey in search of Supernovae that can be used as weather vanes to measure the expansion of the universe. This expansion is dependent on the interaction of matter and the more elusive exotic materials of our Universe – Dark Energy and Dark Matter. The five year survey is necessary to achieve a level of temporal detail and a sufficient number of supernovae events from which to draw conclusions.
In the mean time, the young researchers of Carleton College – Ross Jennings and Zhilu Zhang – are discovering the transients inside our Solar System. Led by Professor David Gerdes of the University of Michigan, the researchers started with a list of nearly 100,000 observations of individual transients. Differencing software and trajectory analysis helped identify those objects that were trans-Neptunian rather than asteroids of the inner Solar System.
While asteroids residing in the inner solar system will pass quickly through such small fields, trans-Neptunian objects (TNOs) orbit the Sun much more slowly. For example, Pluto, at an approximate distance of 40 A.U. from the Sun, along with the object Eris, presently the largest of the TNOs, has an apparent motion of about 27 arc seconds per day – although for a half year, the Earth’s orbital motion slows and retrogrades Pluto’s apparent motion. The 27 arc seconds is approximately 1/60th the width of a full Moon. So, from one night to the next, TNOs can travel as much as 100 pixels across the field of view of the DES survey detectors since each pixel has a width of 0.27 arc seconds.
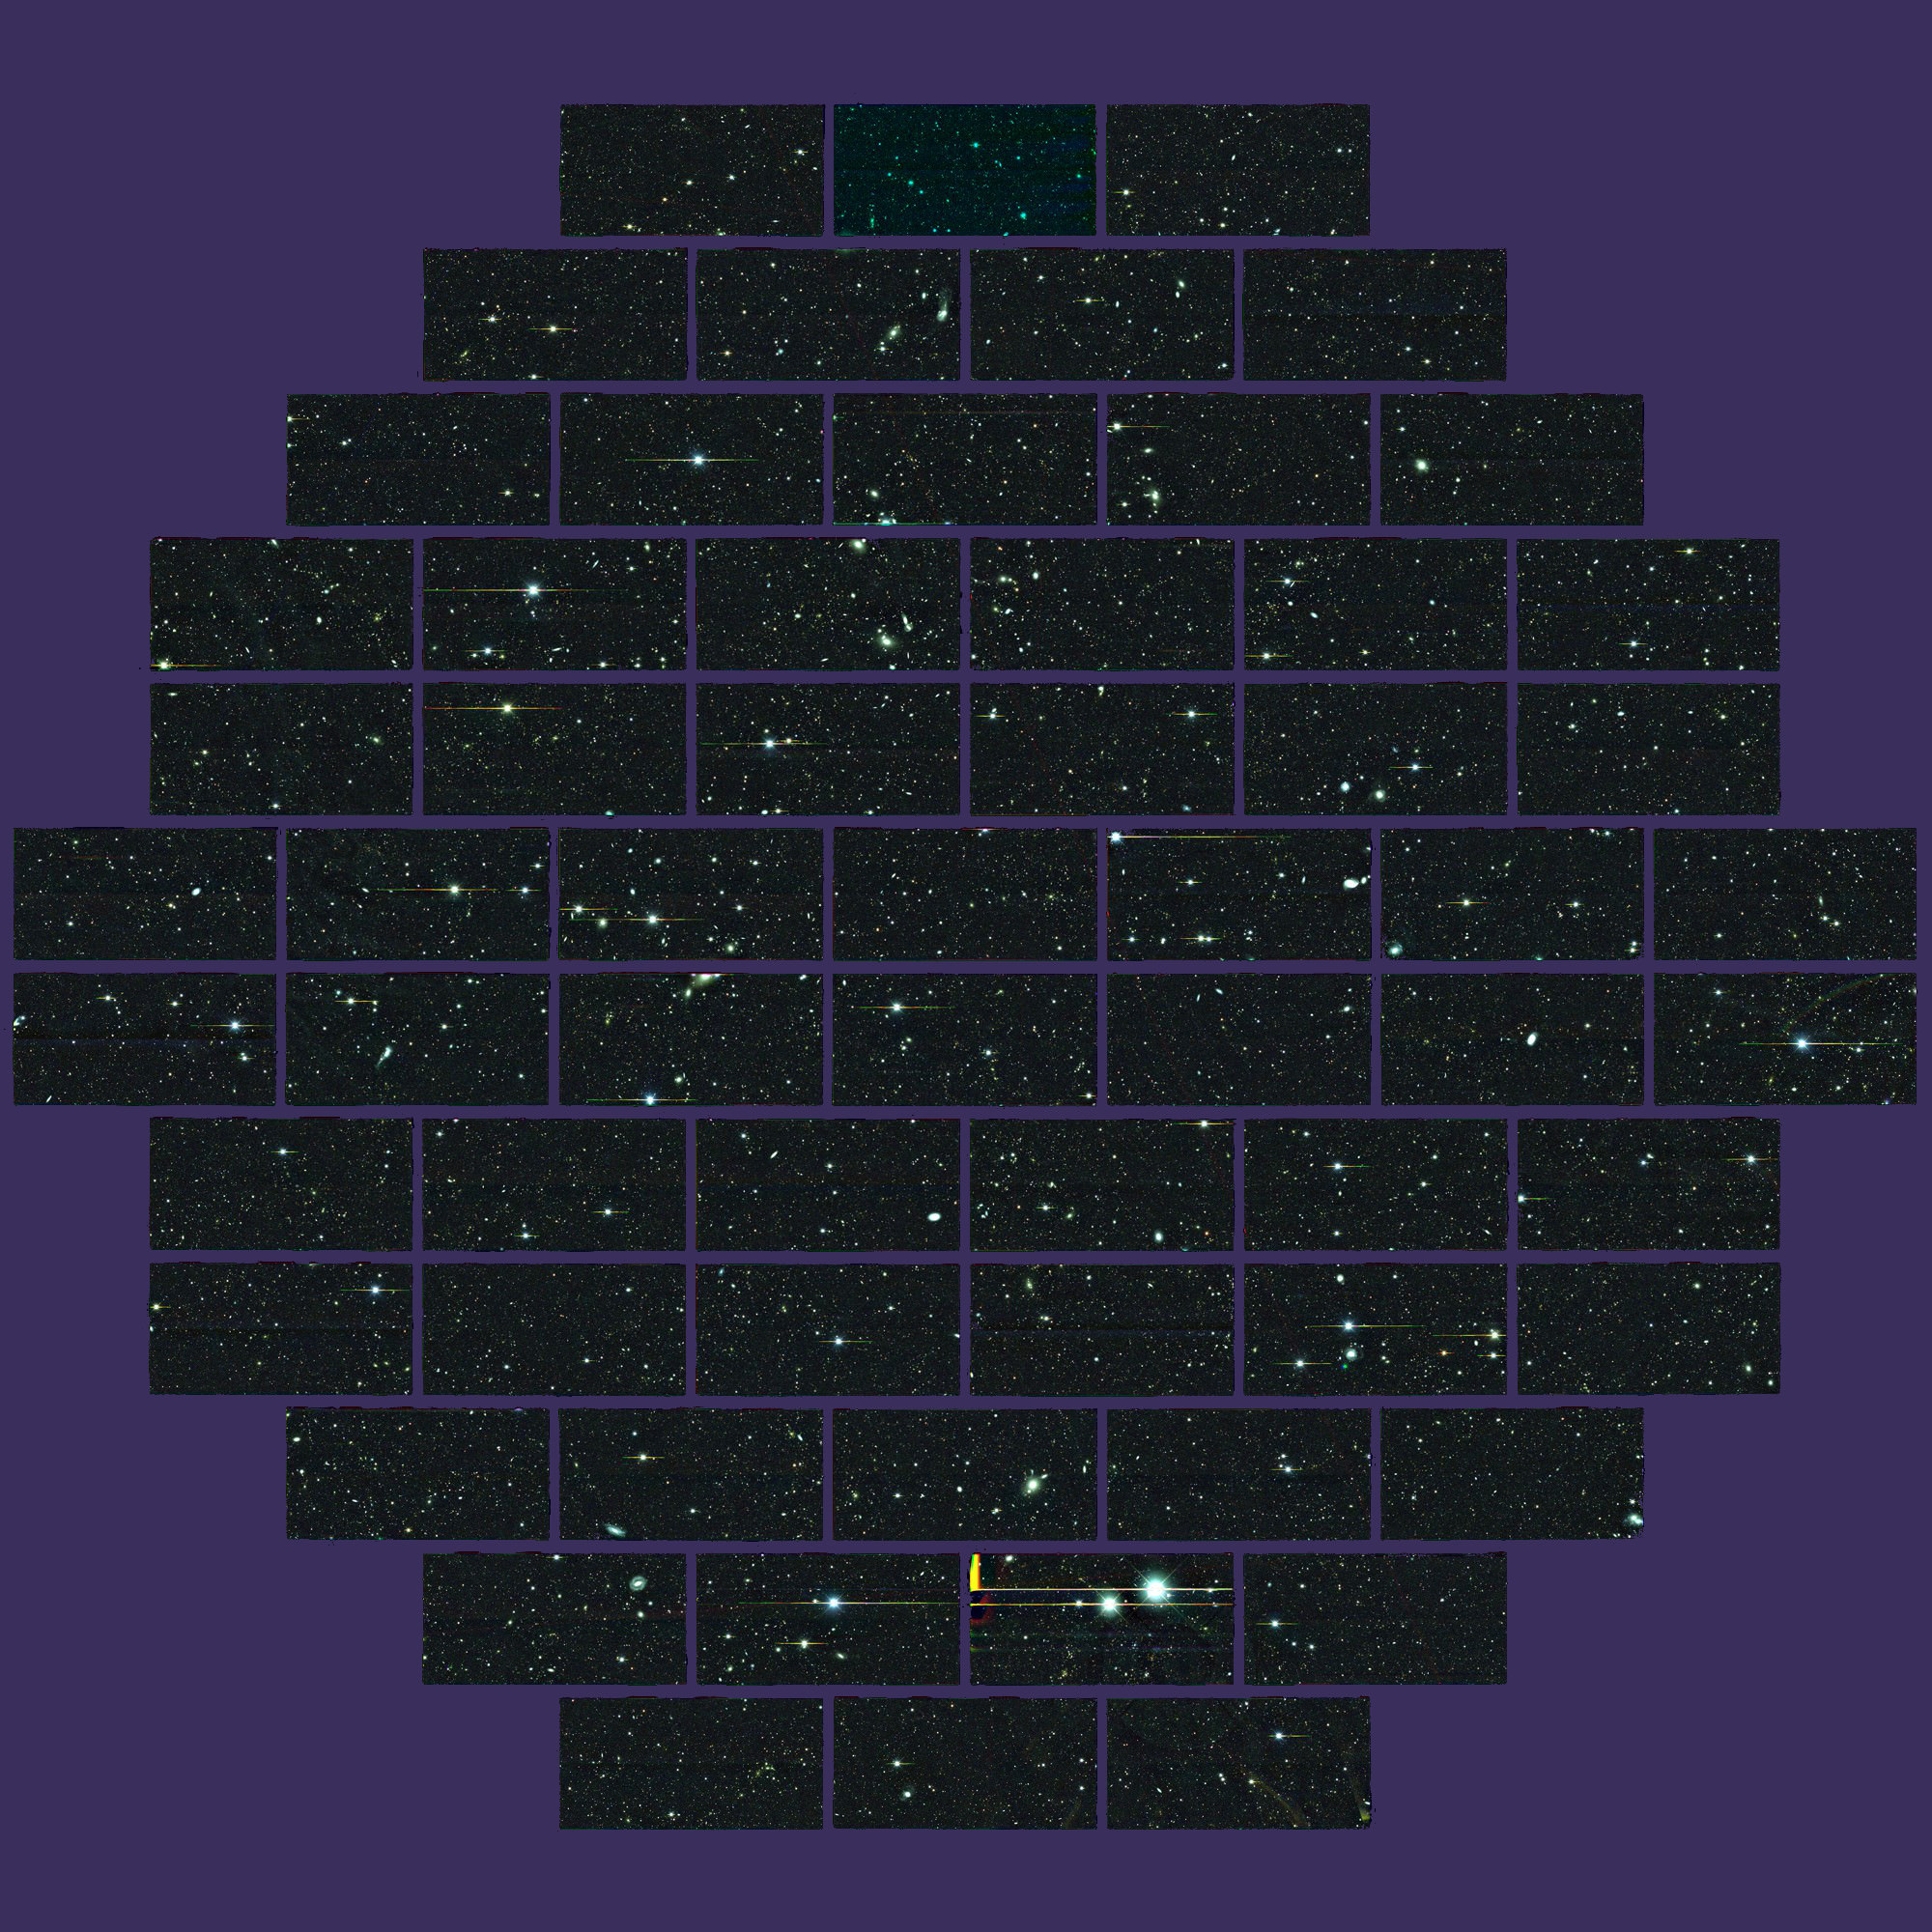
Composite Dark Energy Camera image of one of the sky regions that the collaboration will use to study supernovae, exploding stars that will help uncover the nature of dark energy. The outlines of each of the 62 charge-coupled devices can be seen. This picture spans 2 degrees across on the sky and contains 520 megapixels. (Credit: Fermilab)
The scientific sensor array, DECam, is located at Cerro Tololo Inter-American Observatory (CTIO) in Chile utilizing the 4-meter (13 feet) diameter Victor M. Blanco Telescope. It is an array of 62 2048×4096 pixel back-illuminated CCDs totaling 520 megapixels, and altogether the camera weighs 20 tons.
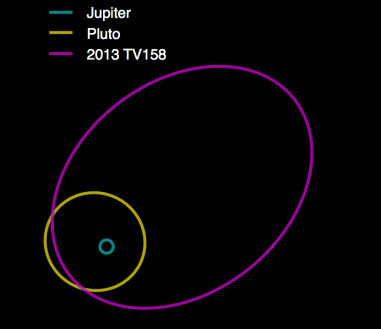
A simple plot of the orbit of one of sixteen TNOs discovered by DES observations. (Credit: Dark Energy Detectives)
With a little over 2 years of observations, the young astronomers stated, “Our analysis revealed sixteen previously unknown outer solar system objects, including one Neptune Trojan, several objects in mean motion resonances with Neptune, and a distant scattered disk object whose 1200-year orbital period is among the 50 longest known.”
Object 2013 TV158 is one of the objects discovered by the Carleton College and University of Michigan team. Observed more than a dozen times over 10 months, the animated gif shows two image frames from August 2014 taken two hours apart. 2013 TV158 takes 1200 years to orbit the Sun and is likely a few hundred kilometers across – about the size of the Grand Canyon. (Credit: Dark Energy Detectives)
“So far we’ve examined less than one percent of the area that DES will eventually cover,” says Dr. Gerdes. “No other survey has searched for TNOs with this combination of area and depth. We could discover something really unusual.”
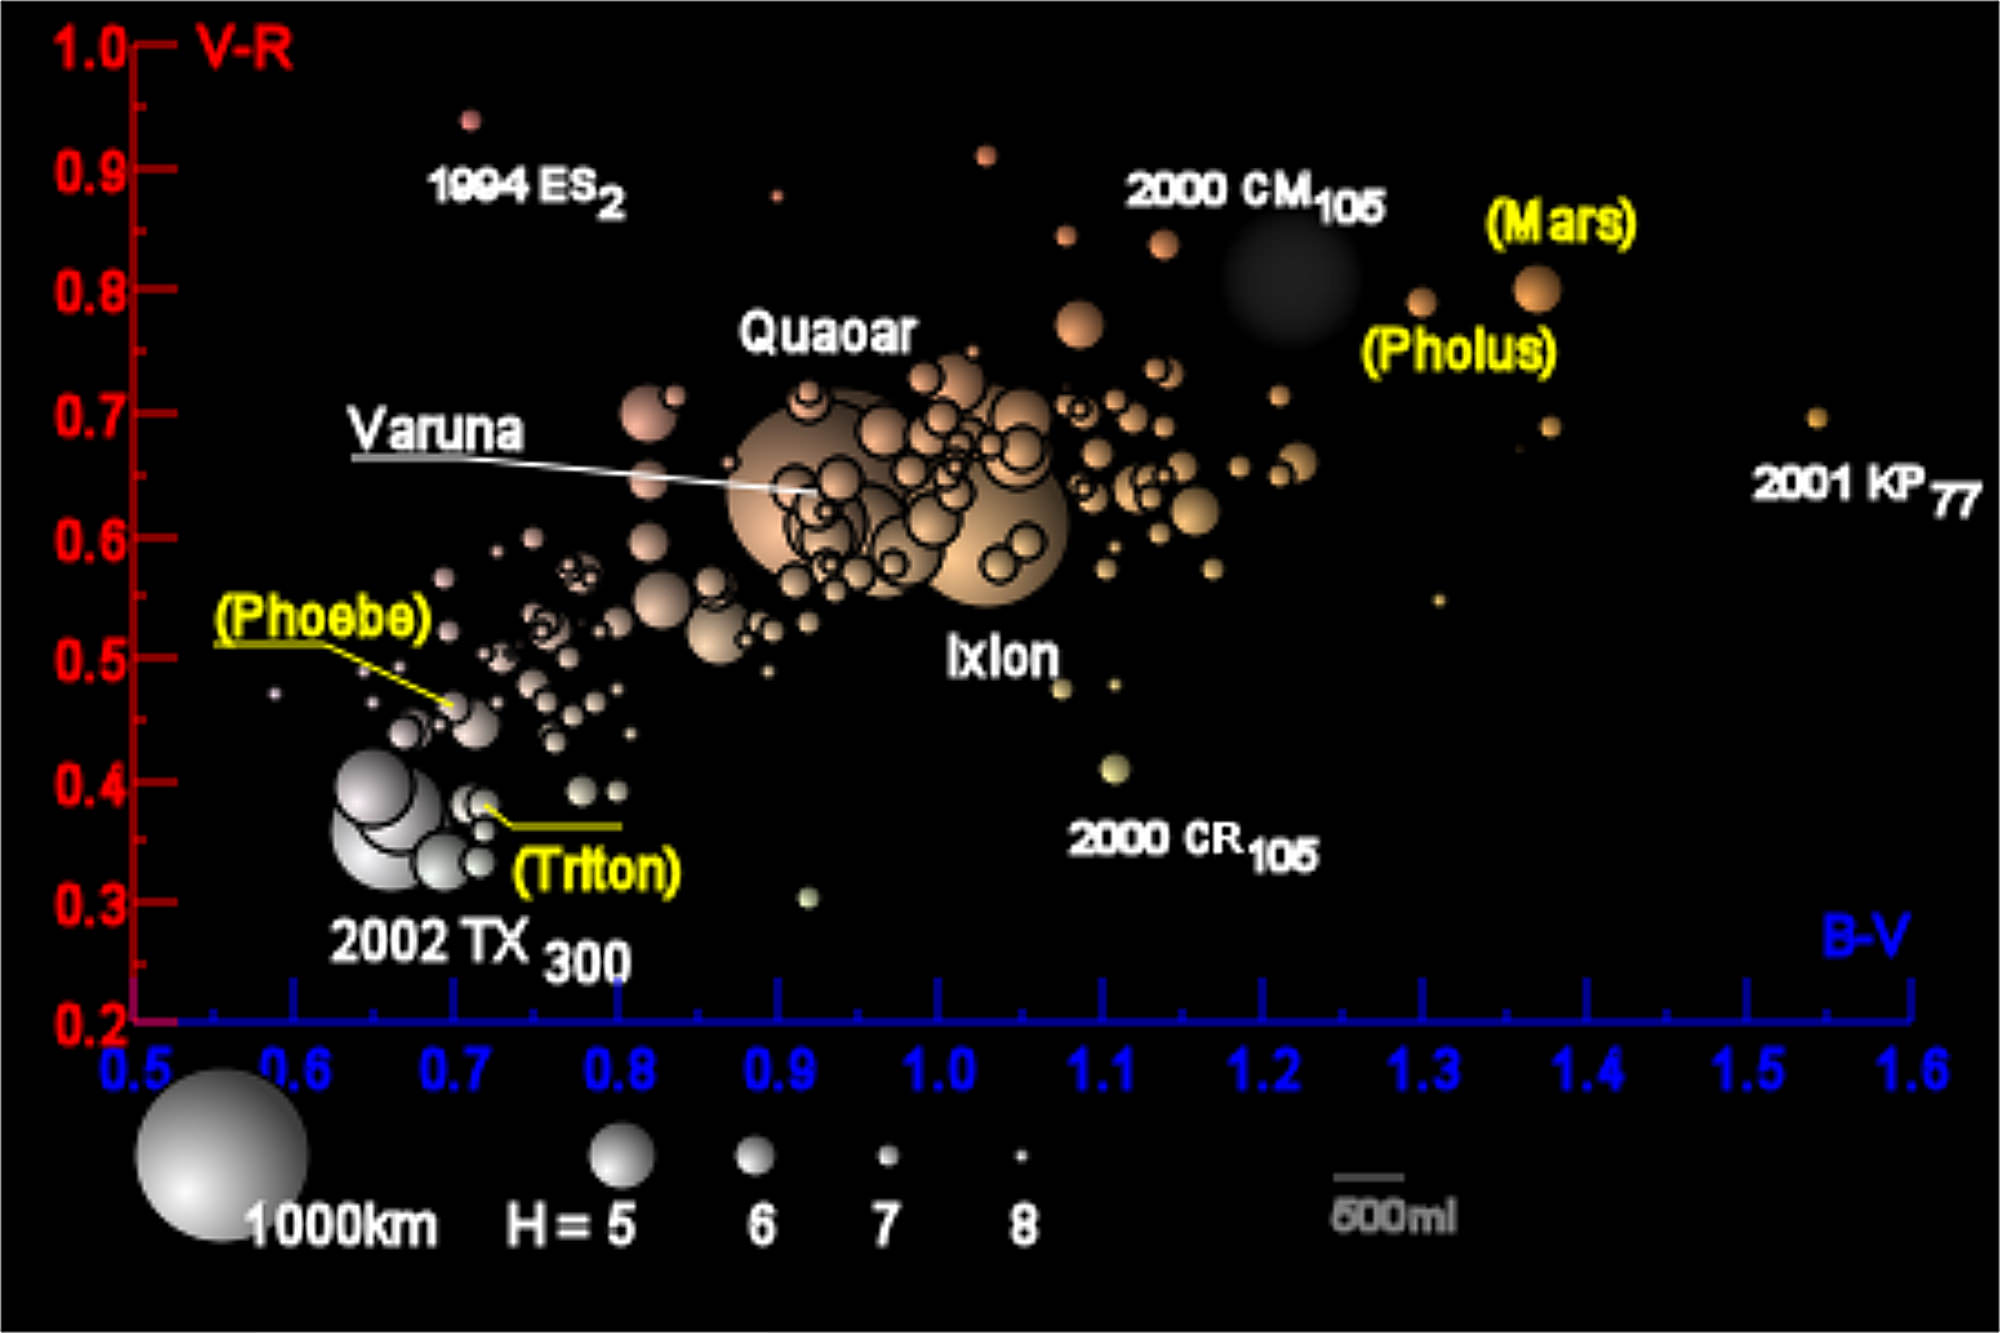
Illustration of color distribution of the trans-Neptunian objects. The horizontal axis represents the difference in intensity between visual (green & yellow) and blue of the object, while the vertical axis is the difference between visual and red. The distribution indicates how TNOs share a common origin and physical makeup, as well as common weathering in space. Yellow objects serve as reference: Neptune’s moon Triton, Saturn’s moon Phoebe, centaur Pholus, and the planet Mars. The object’s color represents the hue of the object. The size of the objects are relative – the larger objects are more accurate estimates, while smaller objects are simply based on absolute magnitude. (Credit: Wikimedia, Eurocommuter)
What does it all mean? It is further confirmation that the outer Solar System is chock-full of rocky-icy small bodies. There are other examples of recent discoveries, such as the search for a TNO for the New Horizons mission. As New Horizons has been approaching Pluto, the team turned to the Hubble space telescope to find a TNO to flyby after the dwarf planet. Hubble made short shrift of the work, finding three that the probe could reach. However, the demand for Hubble time does not allow long term searches for TNOs. A survey such as DES will serve to uncover many thousands of more objects in the outer Solar System. As Dr. Michael Brown of Caltech has stated, there is a fair likelihood that a Mars or Earth-sized object will be discovered beyond Neptune in the Oort Cloud.
A still photo from an animated flythrough of the universe using SDSS data. This image shows our Milky Way Galaxy. The galaxy shape is an artist’s conception, and each of the small white dots is one of the hundreds of thousands of stars as seen by the SDSS. Image credit:
Dana Berry / SkyWorks Digital, Inc. and Jonathan Bird (Vanderbilt University)
Imagine a single mission that would allow you to explore the Milky Way and beyond, investigating cosmic chemistry, hunting planets, mapping galactic structure, probing dark energy and analyzing the expansion of the wider Universe. Enter the Sloan Digital Sky Survey, a massive scientific collaboration that enables one thousand astronomers from 51 institutions around the world to do just that.
At Tuesday’s AAS briefing in Seattle, researchers announced the public release of data collected by the project’s latest incarnation, SDSS-III. This data release, termed “DR12,” represents the survey’s largest and most detailed collection of measurements yet: 2,000 nights’ worth of brand-new information about nearly 500 million stars and galaxies.
One component of SDSS is exploring dark energy by “listening” for acoustic oscillation signals from the the acceleration of the early Universe, and the team also shared a new animated “fly-through” of the Universe that was created using SDSS data.
The SDSS-III collaboration is based at the powerful 2.5-meter Sloan Foundation Telescope at the Apache Point Observatory in New Mexico. The project itself consists of four component surveys: BOSS, APOGEE, MARVELS, and SEGUE. Each of these surveys applies different trappings to the parent telescope in order to accomplish its own, unique goal.
BOSS (the Baryon Oscillation Spectroscopic Survey) visualizes the way that sound waves produced by interacting matter in the early Universe are reflected in the large-scale structure of our cosmos. These ancient imprints, which date back to the first 500,000 years after the Big Bang, are especially evident in high-redshift objects like luminous-red galaxies and quasars. Three-dimensional models created from BOSS observations will allow astronomers to track the expansion of the Universe over a span of 9 billion years, a feat that, later this year, will pave the way for rigorous assessment of current theories regarding dark energy.
At the press briefing, Daniel Eistenstein from the Harvard-Smithsonian Center for Astrophysics explained how BOSS requires huge volumes of data and that so far 1.4 million galaxies have been mapped. He indicated the data analyzed so far strongly confirm dark energy’s existence.
This tweet from the SDSS twitter account uses a bit of humor to explain how BOSS works:
It turns out that in space, everyone can hear you scream, if you do it in the early Universe and set up acoustic oscillations #aas225
APOGEE (the Apache Point Observatory Galactic Evolution Experiment) employs a sophisticated, near-infrared spectrograph to pierce through thick dust and gather light from 100,000 distant red giants. By analyzing the spectral lines that appear in this light, scientists can identify the signatures of 15 different chemical elements that make up the faraway stars – observations that will help researchers piece together the stellar history of our galaxy.
MARVELS (the Multi-Object APO Radial Velocity Exoplanet Large-Area Survey) identifies minuscule wobbles in the orbits of stars, movements that betray the gravitational influence of orbiting planets. The technology itself is unprecedented. “MARVELS is the first large-scale survey to measure these tiny motions for dozens of stars simultaneously,” explained the project’s principal investigator Jian Ge, “which means we can probe and characterize the full population of giant planets in ways that weren’t possible before.”
At the press briefing, Ge said that MARVELS observed 5,500 stars repeatedly, looking for giant exoplanets around these stars. So far, the data has revealed 51 giant planet candidates as well as 38 brown dwarf candidates. Ge added that more will be found with better data processing.
A still photo from an animated flythrough of the universe using SDSS data. This image shows a small part of the large-scale structure of the universe as seen by the SDSS — just a few of many millions of galaxies. The galaxies are shown in their proper positions from SDSS data. Image credit: Dana Berry / SkyWorks Digital, Inc.
SEGUE (the Sloan Extension for Galactic Understanding and Exploration) rounds out the quartet by analyzing visible light from 250,000 stars in the outer reaches of our galaxy. Coincidentally, this survey’s observations “segue” nicely into work being done by other projects within SDSS-III. Constance Rockosi, leader of the SDSS-III domain of SEGUE, recaps the importance of her project’s observations of our outer galaxy: “In combination with the much more detailed view of the inner galaxy from APOGEE, we’re getting a truly holistic picture of the Milky Way.”
One of the most exceptional attributes of SDSS-III is its universality; that is, every byte of juicy information contained in DR12 will be made freely available to professionals, amateurs, and lay public alike. This philosophy enables interested parties from all walks of life to contribute to the advancement of astronomy in whatever capacity they are able.
As momentous as the release of DR12 is for today’s astronomers, however, there is still much more work to be done. “Crossing the DR12 finish line is a huge accomplishment by hundreds of people,” said Daniel Eisenstein, director of the SDSS-III collaboration, “But it’s a big universe out there, so there is plenty more to observe.”
DR12 includes observations made by SDSS-III between July 2008 and June 2014. The project’s successor, SDSS-IV, began its run in July 2014 and will continue observing for six more years.
Here is the video animation of the fly-through of the Universe:
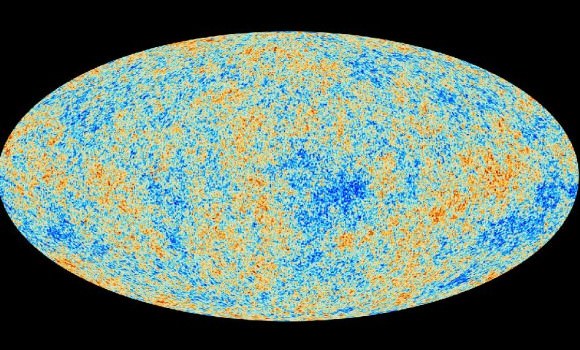
This image, the best map ever of the Universe, shows the oldest light in the universe. This glow, left over from the beginning of the cosmos called the cosmic microwave background, shows tiny changes in temperature represented by color. Credit: ESA and the Planck Collaboration.
The Cosmic Microwave Background (CMB) radiation is one of the greatest discoveries of modern cosmology. Astrophysicist George Smoot once likened its existence to “seeing the face of God.” In recent years, however, scientists have begun to question some of the attributes of the CMB. Peculiar patterns have emerged in the images taken by satellites such as WMAP and Planck – and they aren’t going away. Now, in a paper published in the December 1 issue of The Astronomical Journal, one scientist argues that the existence of these patterns may not only imply new physics, but also a revolution in our understanding of the entire Universe.
Let’s recap. Thanks to a blistering ambient temperature, the early Universe was blanketed in a haze for its first 380,000 years of life. During this time, photons relentlessly bombarded the protons and electrons created in the Big Bang, preventing them from combining to form stable atoms. All of this scattering also caused the photons’ energy to manifest as a diffuse glow. The CMB that cosmologists see today is the relic of this glow, now stretched to longer, microwave wavelengths due to the expansion of the Universe.
As any fan of the WMAP and Planck images will tell you, the hallmarks of the CMB are the so-called anisotropies, small regions of overdensity and underdensity that give the picture its characteristic mottled appearance. These hot and cold spots are thought to be the result of tiny quantum fluctuations born at the beginning of the Universe and magnified exponentially during inflation.
Temperature and polarization around hot and cold spots (Credit: NASA / WMAP Science Team)
Given the type of inflation that cosmologists believe occurred in the very early Universe, the distribution of these anisotropies in the CMB should be random, on the order of a Gaussian field. But both WMAP and Planck have confirmed the existence of certain oddities in the fog: a large “cold spot,” strange alignments in polarity known as quadrupoles and octupoles, and, of course, Stephen Hawking’s initials.
In his new paper, Fulvio Melia of the University of Arizona argues that these types of patterns (Dr. Hawking’s signature notwithstanding) reveal a problem with the standard inflationary picture, or so-called ΛCDM cosmology. According to his calculations, inflation should have left a much more random assortment of anisotropies than the one that scientists see in the WMAP and Planck data. In fact, the probability of these particular anomalies lining up the way they do in the CMB images is only about 0.005% for a ΛCDM Universe.
Melia posits that the anomalous patterns in the CMB can be better explained by a new type of cosmology in which no inflation occurred. He calls this model the R(h)=ct Universe, where c is the speed of light, t is the age of the cosmos, and R(h) is the Hubble radius – the distance beyond which light will never reach Earth. (This equation makes intuitive sense: Light, traveling at light speed (c) for 13.7 billion years (t), should travel an equivalent number of light-years. In fact, current estimates of the Hubble radius put its value at about 13.4 billion light-years, which is remarkably close to the more tightly constrained value of the Universe’s age.)
R(h)=ct holds true for both the standard cosmological scenario and Melia’s model, with one crucial difference: in ΛCDM cosmology, this equation only works for the current age of the Universe. That is, at any time in the distant past or future, the Universe would have obeyed a different law. Scientists explain this odd coincidence by positing that the Universe first underwent inflation, then decelerated, and finally accelerated again to its present rate.
Melia hopes that his model, a Universe that requires no inflation, will provide an alternative explanation that does not rely on such fine-tuning. He calculates that, in a R(h)=ct Universe, the probability of seeing the types of strange patterns that have been observed in the CMB by WMAP and Planck is 7–10%, compared with a figure 1000 times lower for the standard model.
So, could this new way of looking at the cosmos be a death knell for ΛCDM? Probably not. Melia himself cites a few less earth-shattering explanations for the anomalous signals in the CMB, including foreground noise, statistical biases, and instrumental errors. Incidentally, the Planck satellite is scheduled to release its latest image of the CMB this week at a conference in Italy. If these new results show the same patterns of polarity that previous observations did, cosmologists will have to look into each possible explanation, including Melia’s theory, more intensively.
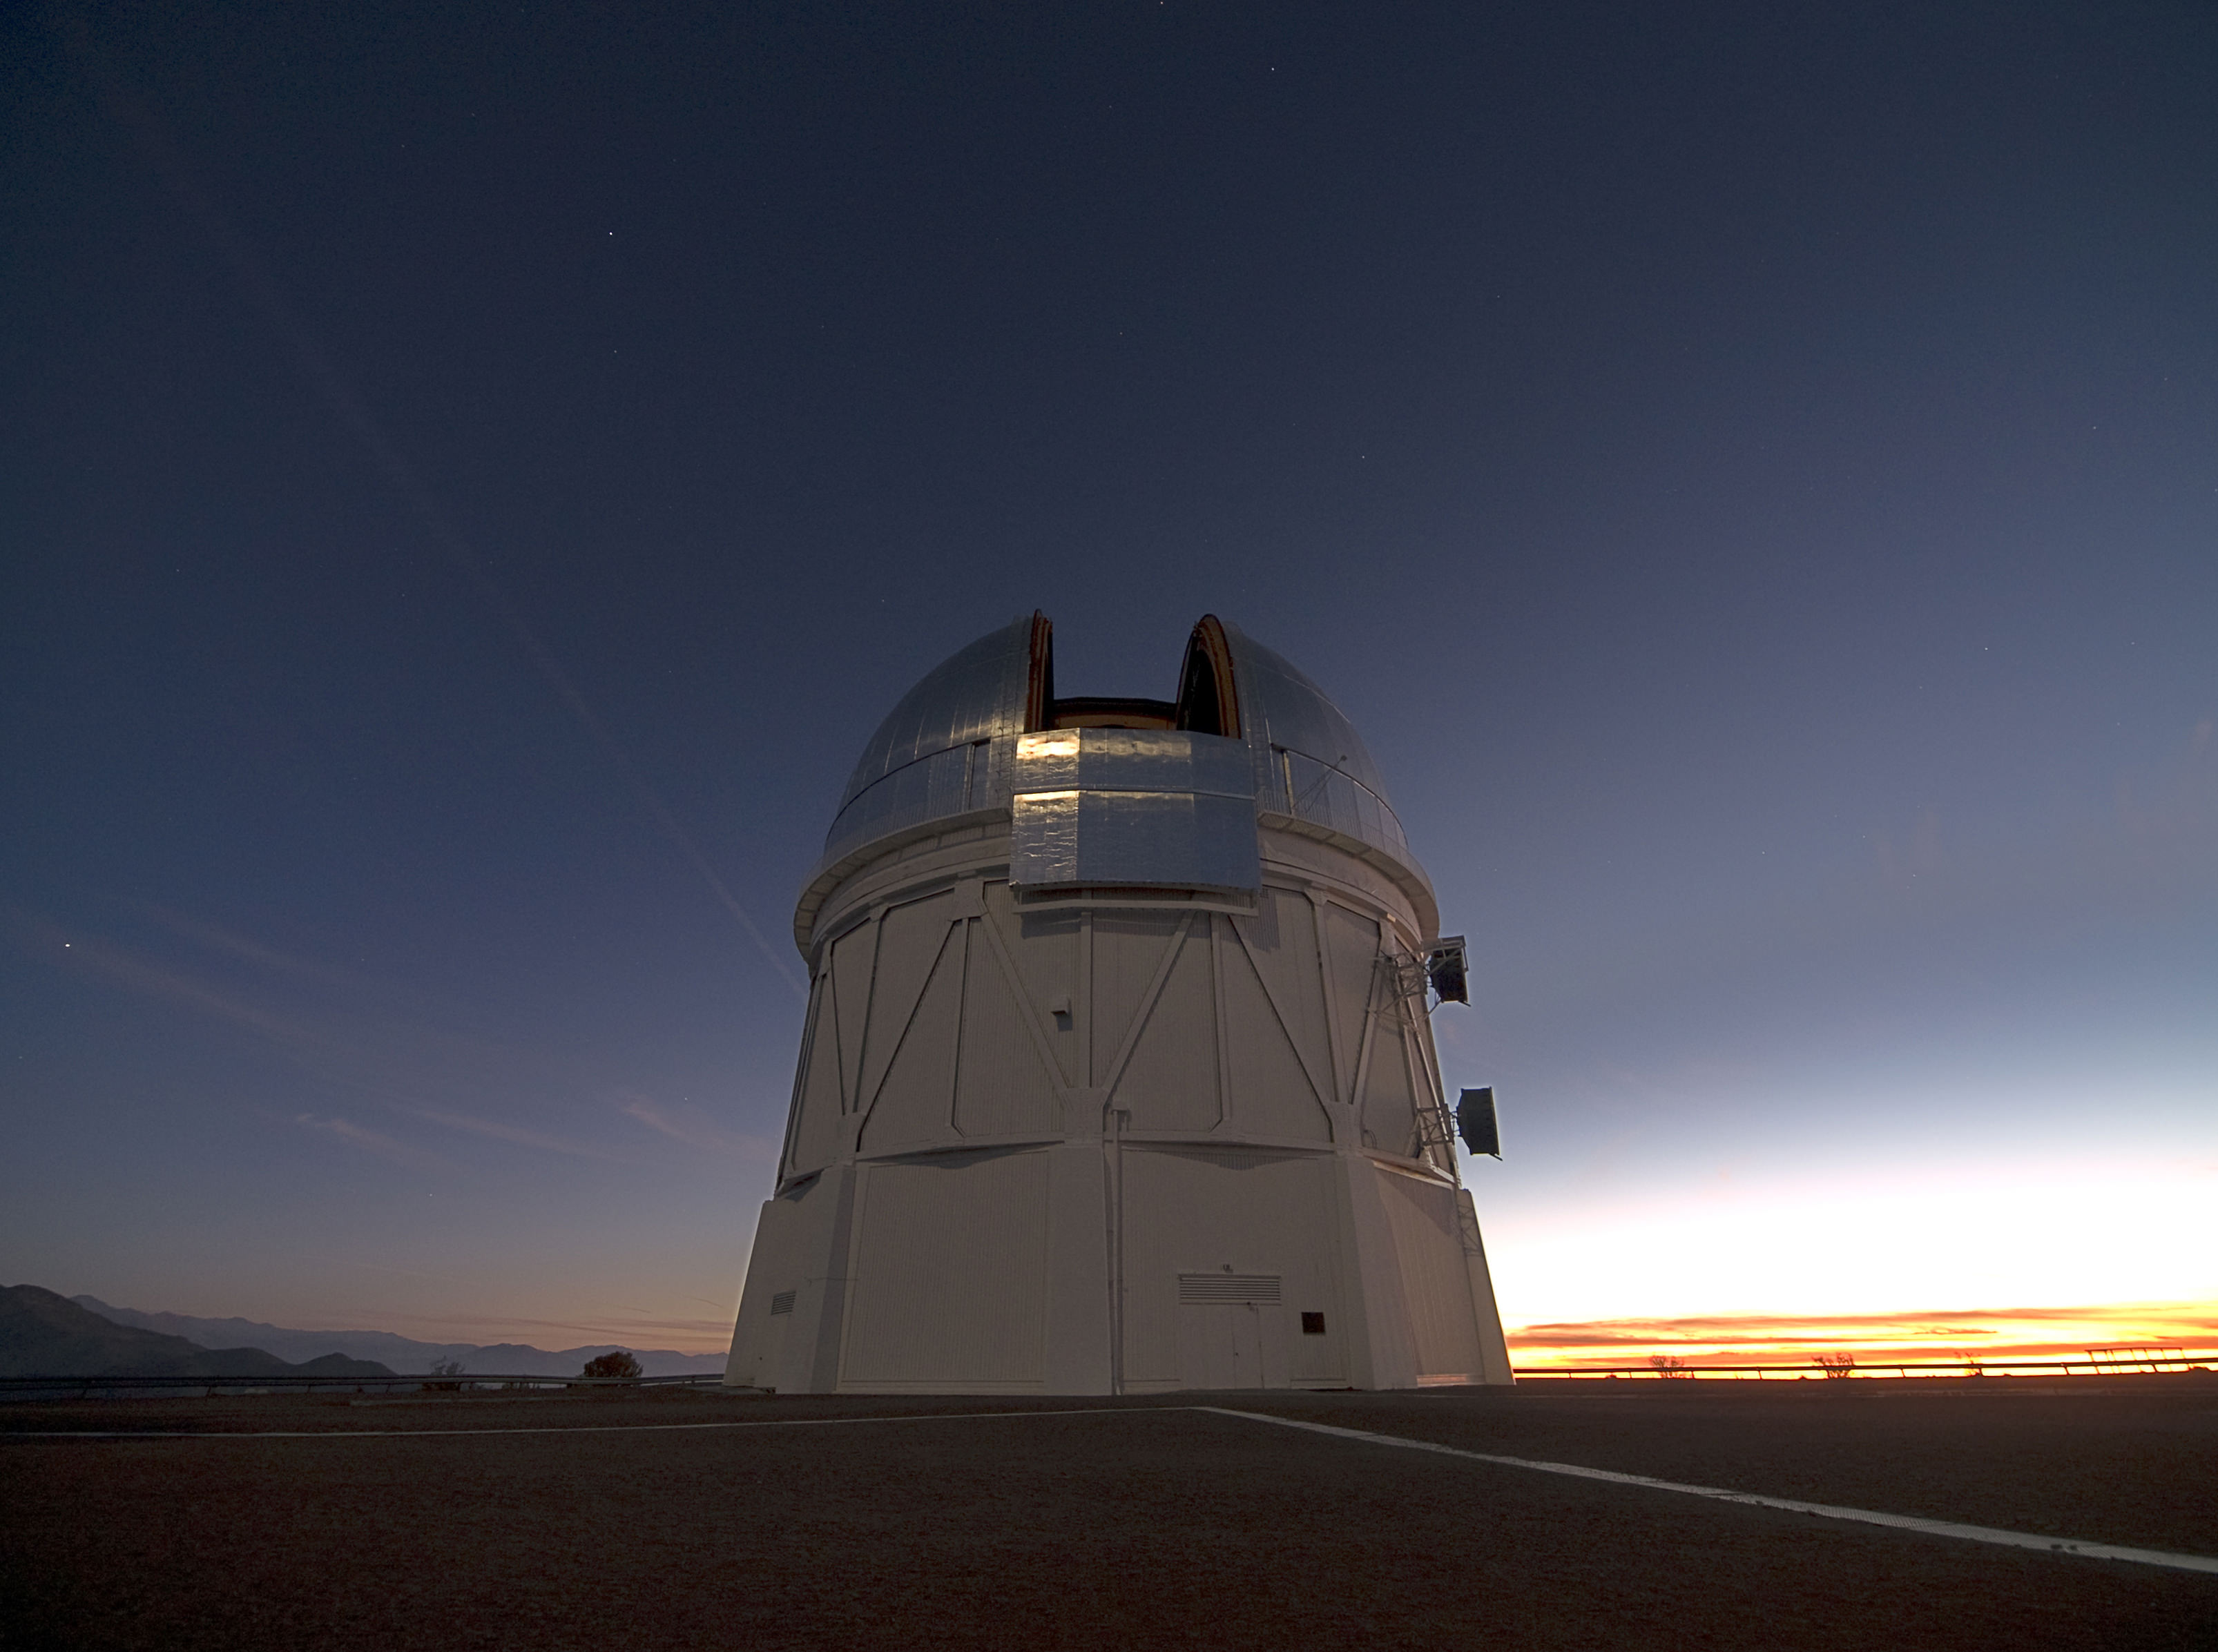
The Victor M. Blanco telescope at Cerro Tololo Interamerican Observatory (CTIO) in the Chilean Andes. Credit: Berkeley Lab
Since the early 20th century, scientists and physicists have been burdened with explaining how and why the Universe appears to be expanding at an accelerating rate. For decades, the most widely accepted explanation is that the cosmos is permeated by a mysterious force known as “dark energy”. In addition to being responsible for cosmic acceleration, this energy is also thought to comprise 68.3% of the universe’s non-visible mass.
Much like dark matter, the existence of this invisible force is based on observable phenomena and because it happens to fit with our current models of cosmology, and not direct evidence. Instead, scientists must rely on indirect observations, watching how fast cosmic objects (specifically Type Ia supernovae) recede from us as the universe expands.
This process would be extremely tedious for scientists – like those who work for the Dark Energy Survey (DES) – were it not for the new algorithms developed collaboratively by researchers at Lawrence Berkeley National Laboratory and UC Berkeley.
“Our algorithm can classify a detection of a supernova candidate in about 0.01 seconds, whereas an experienced human scanner can take several seconds,” said Danny Goldstein, a UC Berkeley graduate student who developed the code to automate the process of supernova discovery on DES images.
Currently in its second season, the DES takes nightly pictures of the Southern Sky with DECam – a 570-megapixel camera that is mounted on the Victor M. Blanco telescope at Cerro Tololo Interamerican Observatory (CTIO) in the Chilean Andes. Every night, the camera generates between 100 Gigabytes (GB) and 1 Terabyte (TB) of imaging data, which is sent to the National Center for Supercomputing Applications (NCSA) and DOE’s Fermilab in Illinois for initial processing and archiving.
By studying Type Ia supernova, astronomers can measure dark energy and the expansion of the universe. Credit: NASA/CXC/M. Weiss
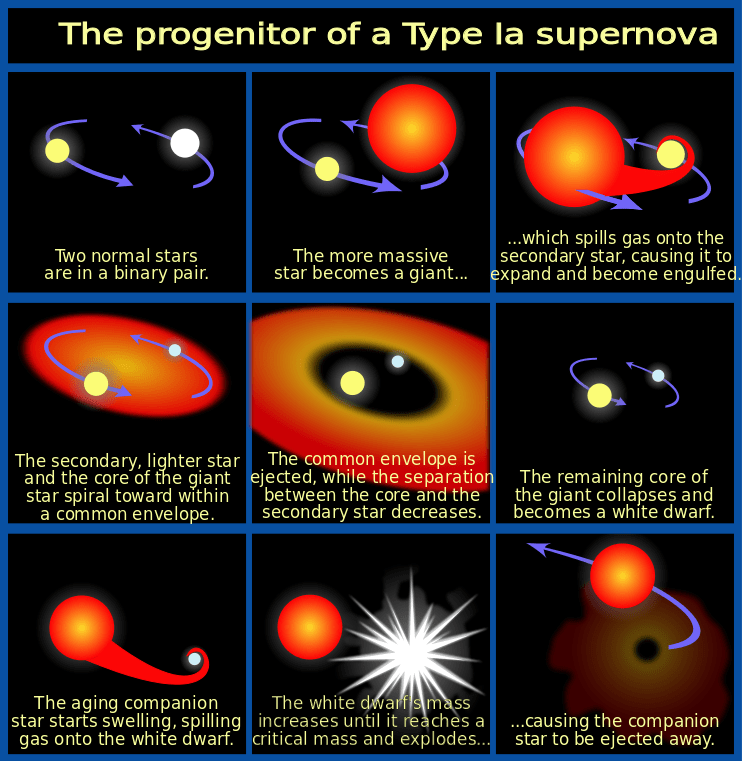
Object recognition programs developed at the National Energy Research Scientific Computing Center (NERSC) and implemented at NCSA then comb through the images in search of possible detections of Type Ia supernovae. These powerful explosions occur in binary star systems where one star is a white dwarf, which accretes material from a companion star until it reaches a critical mass and explodes in a Type Ia supernova.
“These explosions are remarkable because they can be used as cosmic distance indicators to within 3-10 percent accuracy,” says Goldstein.
Distance is important because the further away an object is located in space, the further back in time it is. By tracking Type Ia supernovae at different distances, researchers can measure cosmic expansion throughout the universe’s history. This allows them to put constraints on how fast the universe is expanding and maybe even provide other clues about the nature of dark energy.
“Scientifically, it’s a really exciting time because several groups around the world are trying to precisely measure Type Ia supernovae in order to constrain and understand the dark energy that is driving the accelerated expansion of the universe,” says Goldstein, who is also a student researcher in Berkeley Lab’s Computational Cosmology Center (C3).
Goldstein’s new code uses machine learning techniques to vet detections of supernova candidates. Credit: Danny Goldstein, UC Berkeley/Berkeley Lab)
The DES begins its search for Type Ia explosions by uncovering changes in the night sky, which is where the image subtraction pipeline developed and implemented by researchers in the DES supernova working group comes in. The pipeline subtracts images that contain known cosmic objects from new images that are exposed nightly at CTIO.
Each night, the pipeline produces between 10,000 and a few hundred thousand detections of supernova candidates that need to be validated.
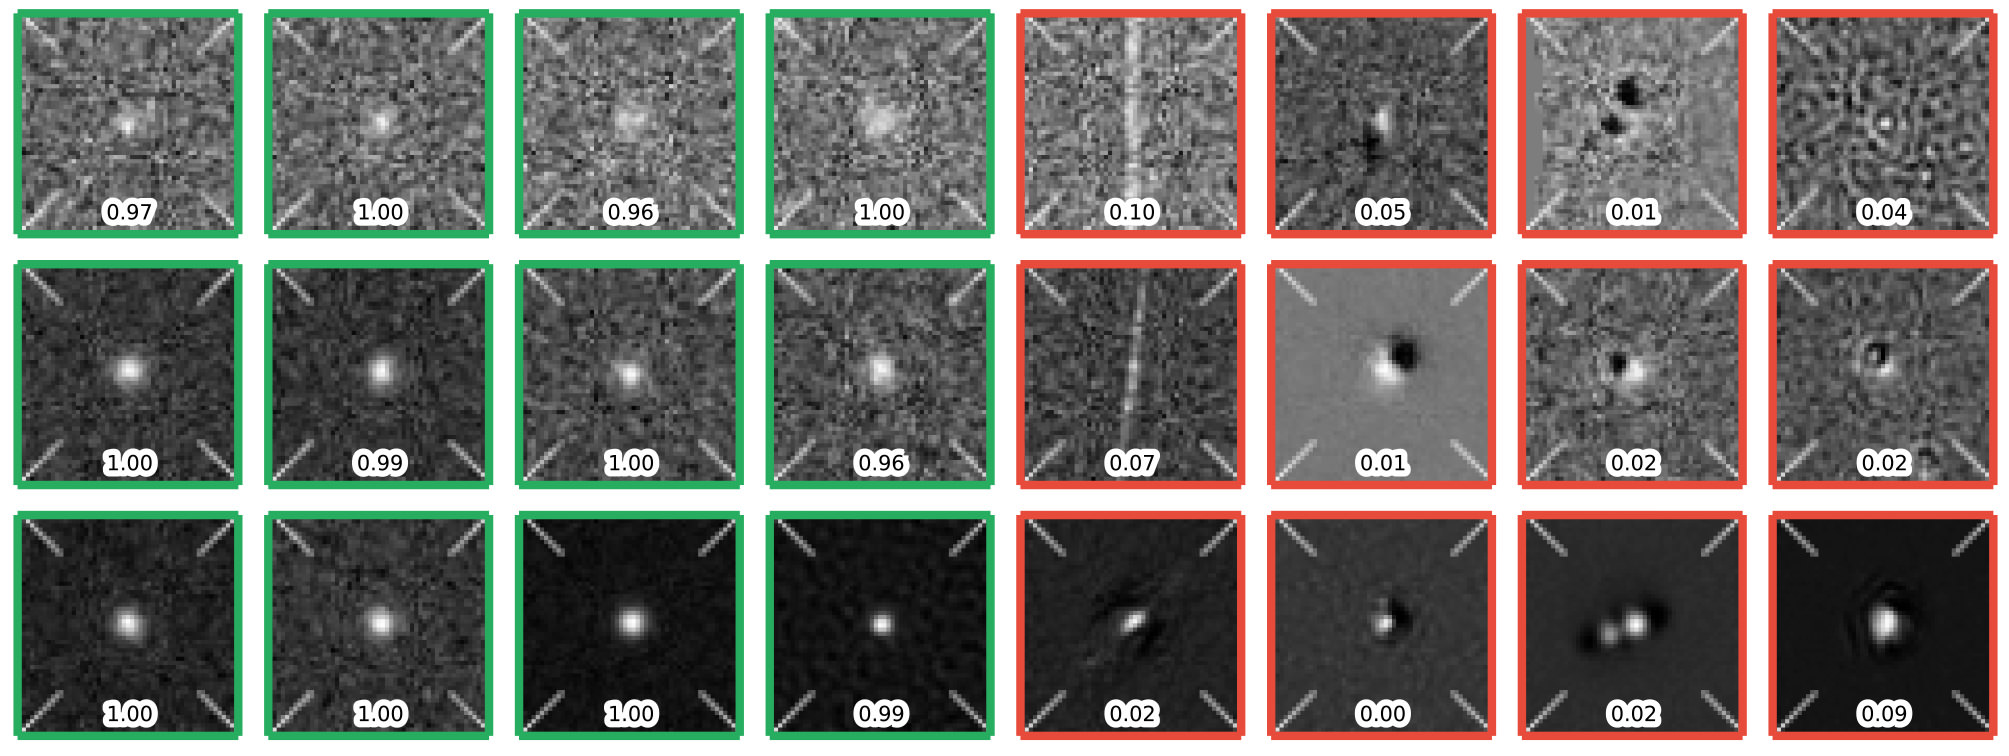
“Historically, trained astronomers would sit at the computer for hours, look at these dots, and offer opinions about whether they had the characteristics of a supernova, or whether they were caused by spurious effects that masquerade as supernovae in the data. This process seems straightforward until you realize that the number of candidates that need to be classified each night is prohibitively large and only one in a few hundred is a real supernova of any type,” says Goldstein. “This process is extremely tedious and time-intensive. It also puts a lot of pressure on the supernova working group to process and scan data fast, which is hard work.”
To simplify the task of vetting candidates, Goldstein developed a code that uses the machine learning technique “Random Forest” to vet detections of supernova candidates automatically and in real-time to optimize them for the DES. The technique employs an ensemble of decision trees to automatically ask the types of questions that astronomers would typically consider when classifying supernova candidates.
Evolution of a Type Ia supernova. Credit: NASA/ESA/A. Feild
At the end of the process, each detection of a candidate is given a score based on the fraction of decision trees that considered it to have the characteristics of a detection of a supernova. The closer the classification score is to one, the stronger the candidate. Goldstein notes that in preliminary tests, the classification pipeline achieved 96 percent overall accuracy.
“When you do subtraction alone you get far too many ‘false-positives’ — instrumental or software artifacts that show up as potential supernova candidates — for humans to sift through,” says Rollin Thomas, of Berkeley Lab’s C3, who was Goldstein’s collaborator.
He notes that with the classifier, researchers can quickly and accurately strain out the artifacts from supernova candidates. “This means that instead of having 20 scientists from the supernova working group continually sift through thousands of candidates every night, you can just appoint one person to look at maybe few hundred strong candidates,” says Thomas. “This significantly speeds up our workflow and allows us to identify supernovae in real-time, which is crucial for conducting follow up observations.”
“Using about 60 cores on a supercomputer we can classify 200,000 detections in about 20 minutes, including time for database interaction and feature extraction.” says Goldstein.
Goldstein and Thomas note that the next step in this work is to add a second-level of machine learning to the pipeline to improve the classification accuracy. This extra layer would take into account how the object was classified in previous observations as it determines the probability that the candidate is “real.” The researchers and their colleagues are currently working on different approaches to achieve this capability.
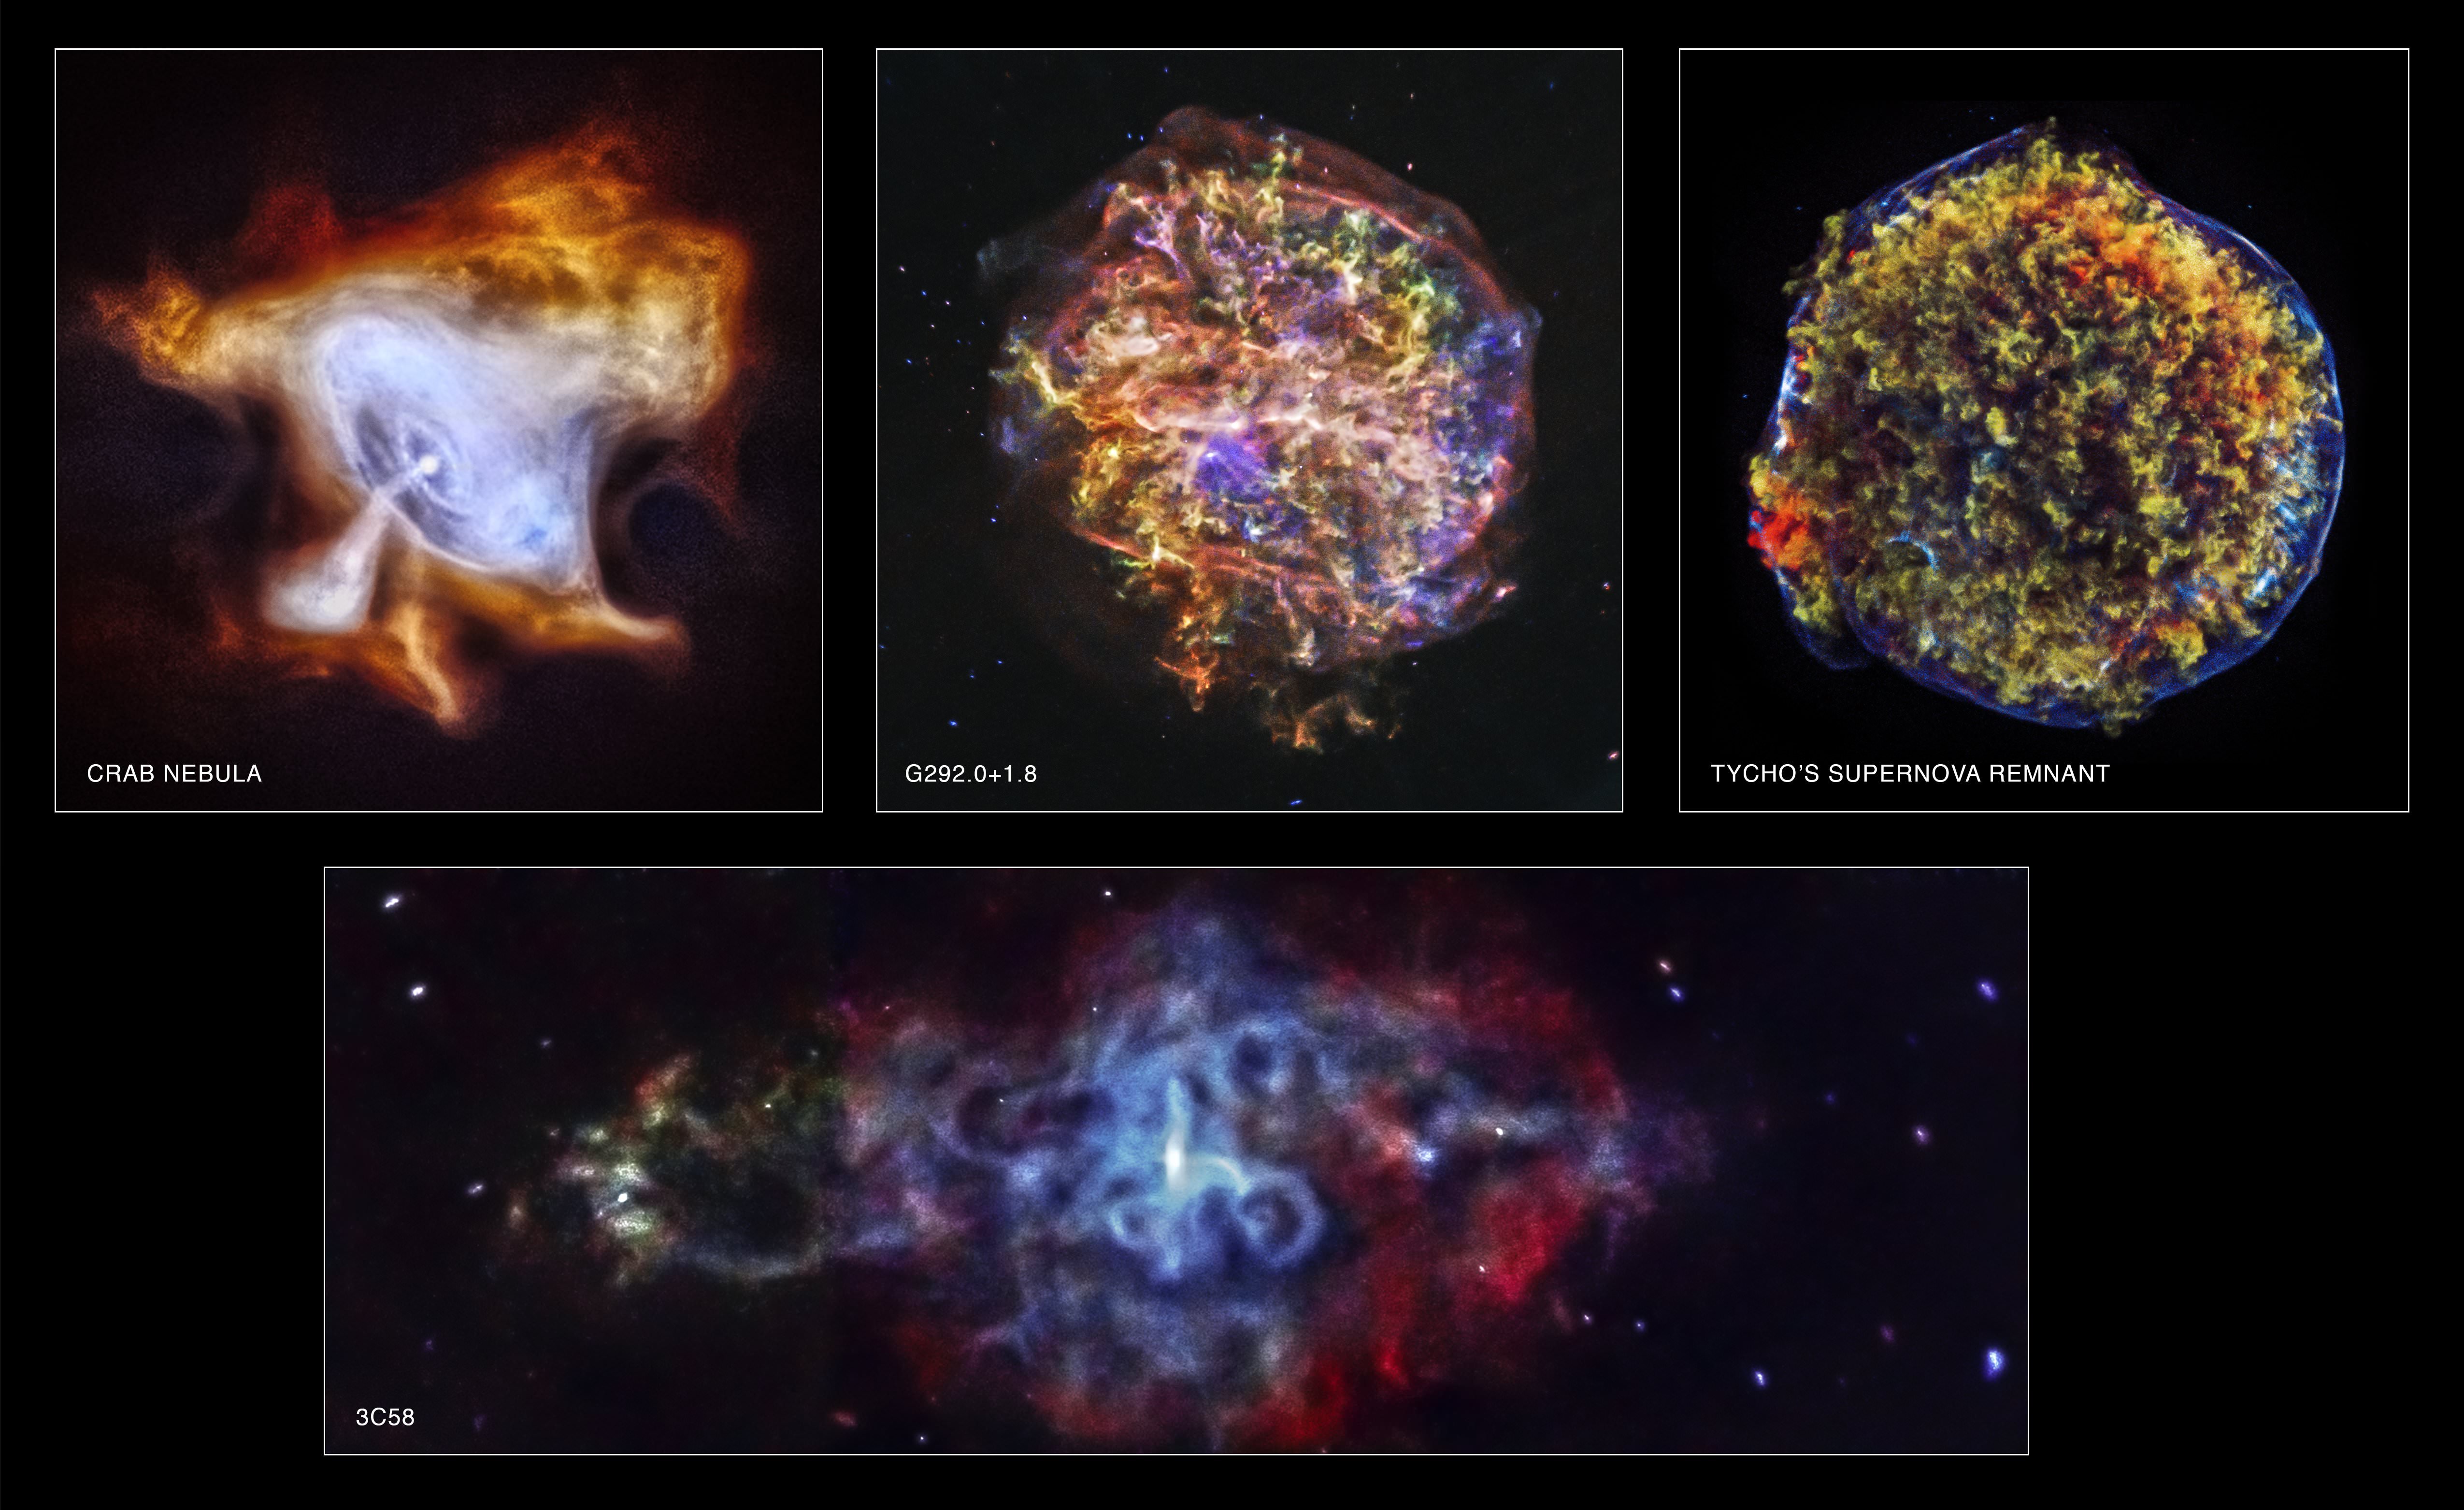
A collection of images from the Chandra X-Ray Observatory marking its 15th anniversary in space. Top, from left: the crab Nebula, supernova remnant G292.0+1.8 and the Crab Nebula. At bottom, supernova remnant 3C58. Credit: NASA/CXC/SAO
It’s well past the Fourth of July, but you can still easily find fireworks in the sky if you look around. The Chandra X-Ray Observatory has been doing just that for the past 15 years, revealing what the universe looks like in these longer wavelengths that are invisible to human eyes.
Just in time for the birthday, NASA released four pictures that Chandra took of supernova (star explosion) remnants it has observed over the years. The pictures stand as a symbol of what the telescope has shown us so far.
“Chandra changed the way we do astronomy. It showed that precision observation of the X-rays from cosmic sources is critical to understanding what is going on,” stated Paul Hertz, NASA’s Astrophysics Division director, in a press release. “We’re fortunate we’ve had 15 years – so far – to use Chandra to advance our understanding of stars, galaxies, black holes, dark energy, and the origin of the elements necessary for life.”
The telescope launched into space in 1999 aboard the space shuttle and currently works at an altitude as high as 86,500 miles (139,000 miles). It is named after Indian-American astrophysicist Subrahmanyan Chandrasekhar; the name “Chandra” also means “moon” or “luminous” in Sanskrit.
And there’s more to come. You can learn more about Chandra’s greatest discoveries and its future in this Google+ Hangout, which will start at 3 p.m. EDT (7 p.m. EDT) at this link.
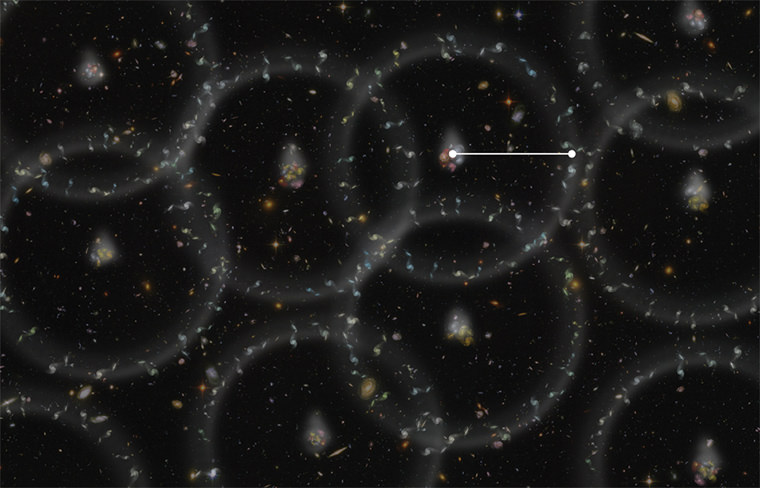
An artist's concept of the latest, highly accurate measurement of the Universe from BOSS. The spheres show the current size of the "baryon acoustic oscillations" (BAOs) from the early universe, which have helped to set the distribution of galaxies that we see in the universe today. Galaxies have a slight tendency to align along the edges of the spheres — the alignment has been greatly exaggerated in this illustration. BAOs can be used as a "standard ruler" (white line) to measure the distances to all the galaxies in the universe. Credit: Zosia Rostomian, Lawrence Berkeley National Laboratory
When it comes to accuracy, everyone strives for a hundred percent, but measuring cosmic distances leaves a bit more to chance. Just days ago, researchers from the Baryon Oscillation Spectroscopic Survey (BOSS) announced to the world that they have been able to measure the distance to galaxies located more than six billion light-years away to a confidence level of just one percent. If this announcement doesn’t seem exciting, then think on what it means to other studies. These new measurements give a parameter to the properties of the ubiquitous “dark energy” – the source of universal expansion.
“There are not many things in our daily lives that we know to one-percent accuracy,” said David Schlegel, a physicist at Lawrence Berkeley National Laboratory (LBNL) and the principal investigator of BOSS. “I now know the size of the universe better than I know the size of my house.”
The research team’s findings were presented at the meeting of the American Astronomical Society by Harvard University astronomer Daniel Eisenstein, the director of the Sloan Digital Sky Survey III (SDSS-III), the worldwide organization which includes BOSS. They are detailed in a series of articles submitted to journals by the BOSS collaboration last month, all of which are now available as online preprints.
“Determining distance is a fundamental challenge of astronomy,” said Eisenstein. “You see something in the sky — how far away is it? Once you know how far away it is, learning everything else about it is suddenly much easier.”
When it comes to measuring distances in space, astronomers have employed many methods. To measure distances to planets has been accomplished using radar, but it has its constraints and going further into space means a less direct method. Even though they have been proved to be amazingly accurate, there is still an uncertainty factor involved – one that is expressed as a percentage. For example, if you were to measure the distance from an object 200 miles away to within a true value of 2 miles, then you have measured with an accuracy of 1%. Cosmically speaking, just a few hundred stars and a handful of star clusters are actually close enough to have their distances so accurately predicted. They reside within the Milky Way and are just a few thousand light-years away. BOSS takes it to the extreme… its measurements go well beyond our galactic boundaries, more than a million times further, and maps the Universe with unparalleled accuracy.
Thanks to these new, highly-accurate distance measurements, BOSS astronomers are making headway in the field of dark energy. “We don’t yet understand what dark energy is,” explained Eisenstein, “but we can measure its properties. Then, we compare those values to what we expect them to be, given our current understanding of the universe. The better our measurements, the more we can learn.”
Just how is it done? To achieve a one-percent measurement at six billion light years isn’t as easy as measuring a solar system object, or even one contained within our galaxy. That’s where the BOSS comes into play. It’s the largest of the four projects that make up the Sloan Digital Sky Survey III (SDSS-III), and was built to take advantage of this technique: measuring the so-called “baryon acoustic oscillations” (BAOs), subtle periodic ripples in the distribution of galaxies in the cosmos. These ripples are the signature of pressure waves which once cruised the early Universe at a time when things were so hot and dense that photons marched along with baryons – the stuff which creates the nuclei of atoms. Since the size of the ripple is known, that size can now be measured by mapping galaxies.
“With these galaxy measurements, nature has given us a beautiful ruler,” said Ashley Ross, an astronomer from the University of Portsmouth. “The ruler happens to be half a billion light-years long, so we can use it to measure distances precisely, even from very far away.
Using its specialized instrumentation which can make detailed measurements of a thousand galaxies at a time, BOSS took on a huge challenge – mapping the location of more than a million galaxies. “On a clear night when everything goes perfectly, we can add more than 8000 galaxies and quasars to the map,” said Kaike Pan, who leads the team of observers at the SDSS-III’s Sloan Foundation 2.5-meter Telescope at Apache Point Observatory in New Mexico.
Although the BOSS research team presented its early galaxy maps and beginning BAO measurements a year ago, this new data covers twice as much territory and gives an even more accurate measurement – including those to nearby galaxies. “Making these measurements at two different distances allows us to see how the expansion of the universe has changed over time, which will help us understand why it is accelerating,” explained University of Portsmouth astronomer Rita Tojeiro, who co-chairs the BOSS galaxy clustering working group along with Jeremy Tinker of New York University.
Also doing a similar study is Mariana Vargas-Magana, a postdoctoral researcher at Carnegie Mellon University. To enable even more accuracy, she’s looking into any subtle effects which could influence the BOSS measurements. “When you’re trying to reach one percent, you have to be paranoid about everything that could go even slightly wrong,” said Vargas-Magana — for example, slight differences in how galaxies were identified could have thrown off the entire measurement of their distribution, so different parts of the sky had to be checked carefully. “Fortunately,” Vargas-Magana said, “there are plenty of careful people on our team to check our assumptions. By the time all of them are satisfied, we are sure we didn’t miss anything.”
As of the present, these new BOSS findings would seem to be consistent with what we consider to be form of dark energy – a constant found throughout the history of the Universe. According to the news release, this “cosmological constant” is one of just six numbers required to create a model which coincides with the scale and structure of the Universe. Schlegel compares this six-number model to a pane of glass, which is pinned in place by bolts that represent different measurements of the history of the Universe. “BOSS now has one of the tightest of those bolts, and we just gave it another half-turn,” said Schlegel. “Each time you ratchet up the tension and the glass doesn’t break, that’s a success of the model.”
The Hubble Space Telescope image of the inner regions of the lensing cluster Abell 1689 that is 2.2 billion light?years away. Light from distant background galaxies is bent by the concentrated dark matter in the cluster (shown in the blue overlay) to produce the plethora of arcs and arclets that were in turn used to constrain dark energy. Image courtesy of NASA?ESA, Jullo (JPL), Natarajan (Yale), Kneib (LAM)
We keep saying dark matter is so very hard to find. Astronomers say they can see its effects — such as gravitational lensing, or an amazing bendy feat of light that takes place when a massive galaxy brings forward light from other galaxies behind it. But defining what the heck that matter is, is proving elusive. And considering it makes up most of the universe’s matter, it would be great to know what dark matter looks like.
A new experiment — billed as the most sensitive dark matter detector in the world — spent three months searching for evidence of weakly interacting massive particles (WIMPs), which may be the basis of dark matter. So far, nothing, but researchers emphasized they have only just started work.
“Now that we understand the instrument and its backgrounds, we will continue to take data, testing for more and more elusive candidates for dark matter,” stated physicist Dan McKinsey of Yale University, who is one of the collaborators on the Large Underground Xenon (LUX) detector.
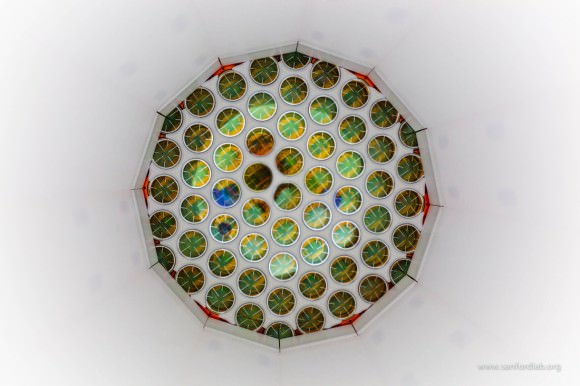
A view of the Large Underground Xenon (LUX) dark matter detector. Shown are photomultiplier tubes that can ferret out single photons of light. Signals from these photons told physicists that they had not yet found Weakly Interacting Massive Particles (WIMPs) Credit: Matthew Kapust / South Dakota Science and Technology Authority
LUX operates a mile (1.6 kilometers) beneath the Earth in the state-owned Sanford Underground Research Facility, which is located in South Dakota. The underground location is perfect for this kind of work because there is little interference from cosmic ray particles.
“At the heart of the experiment is a six-foot-tall titanium tank filled with almost a third of a ton of liquid xenon, cooled to minus 150 degrees Fahrenheit. If a WIMP strikes a xenon atom it recoils from other xenon atoms and emits photons (light) and electrons. The electrons are drawn upward by an electrical field and interact with a thin layer of xenon gas at the top of the tank, releasing more photons,” stated the Lawrence Berkeley National Laboratory, which leads operations at Sanford.
“Light detectors in the top and bottom of the tank are each capable of detecting a single photon, so the locations of the two photon signals – one at the collision point, the other at the top of the tank – can be pinpointed to within a few millimeters. The energy of the interaction can be precisely measured from the brightness of the signals.”
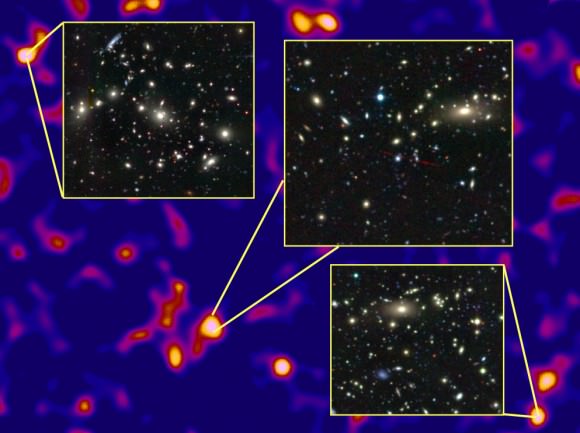
The densest regions of the dark matter cosmic web host massive clusters of galaxies. Credit: Van Waerbeke, Heymans, and CFHTLens collaboration.
LUX’s sensitivity for low-mass WIMPs is more than 20 times better than other detectors. That said, the detector was unable to confirm possible hints of WIMPs found in other experiments.
“Three candidate low-mass WIMP events recently reported in ultra-cold silicon detectors would have produced more than 1,600 events in LUX’s much larger detector, or one every 80 minutes in the recent run,” the laboratory added.
Don’t touch that dial yet, however. LUX plans to do more searching in the next two years. Also, the Sanford Lab is proposing an even more sensitive LUX-ZEPLIN experiment that would be 1,000 times more sensitive than LUX. No word yet on when LUX-ZEPLIN will get off the ground, however.