If We Live in a Multiverse, How Many Are There?

Artist concept of the cyclic universe.

[/caption]
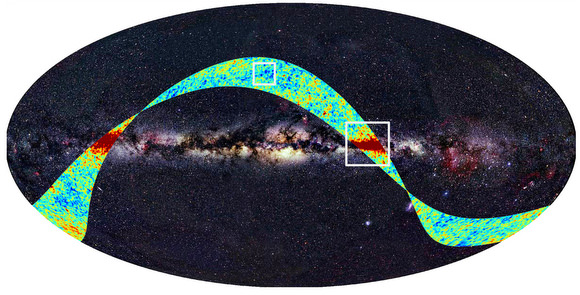
Theoretical physics has brought us the notion that our single universe is not necessarily the only game in town. Satellite data from WMAP, along with string theory and its 11- dimensional hyperspace idea has produced the concept of the multiverse, where the Big Bang could have produced many different universes instead of a single uniform universe. The idea has gained popularity recently, so it was only a matter of time until someone asked the question of how many multiverses could possibly exist. The number, according to two physicists, could be “humongous.”

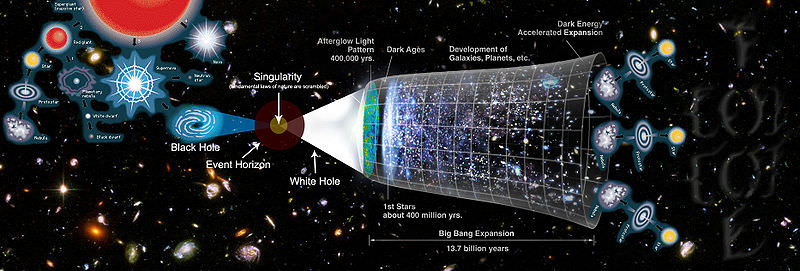
Andrei Linde and Vitaly Vanchurin at Stanford University in California, did a few back-of- the- envelope calculations, starting with the idea that the Big Bang was essentially a quantum process which generated quantum fluctuations in the state of the early universe. The universe then underwent a period of rapid growth called inflation during which these perturbations were “frozen,” creating different initial classical conditions in different parts of the cosmos. Since each of these regions would have a different set of laws of low energy physics, they can be thought of as different universes.

Linde and Vanchurin then estimated how many different universes could have appeared as a result of this effect. Their answer is that this number must be proportional to the effect that caused the perturbations in the first place, a process called slow roll inflation, — the solution Linde came up with previously to answer the problem of the bubbles of universes colliding in the early inflation period. In this model, inflation occurred from a scalar field rolling down a potential energy hill. When the field rolls very slowly compared to the expansion of the universe, inflation occurs and collisions end up being rare.

Using all of this (and more – see their paper here) Linde and Vanchurin calculate that the number of universes in the multiverse and could be at least 10^10^10^7, a number which is definitely “humungous,” as they described it.

The next question, then, is how many universes could we actually see? Linde and Vanchurin say they had to invoke the Bekenstein limit, where the properties of the observer become an important factor because of a limit to the amount of information that can be contained within any given volume of space, and by the limits of the human brain.

The total amount of information that can be absorbed by one individual during a lifetime is about 10^16 bits. So a typical human brain can have 10^10^16 configurations and so could never distinguish more than that number of different universes.

The number of multiverses the human brain could distinguish. Credit: Linde and Vanchurin

“So, the total number of possibilities accessible to any given observer is limited not only by the entropy of perturbations of metric produced by inflation and by the size of the cosmological horizon, but also by the number of degrees of freedom of an observer,” the physicists write.

“We have found that the strongest limit on the number of different locally distinguishable geometries is determined mostly by our abilities to distinguish between different universes and to remember our results,” wrote Linde and Vanchurin. “Potentially it may become very important that when we analyze the probability of existencse of a universe of a given type, we should be talking about a consistent pair: the universe and an observer who makes the rest of the universe “alive” and the wave function of the rest of the universe time-dependant.”

So their conclusion is that the limit does not depend on the properties of the multiverse itself, but on the properties of the observer.

They hope to further study this concept to see if this probability if proportional to the observable entropy of inflation.

Sources: ArXiv, Technology Review Blog

Planck First Light

Strips of the sky measured by Planck. Credit: ESA

[/caption]
One of the newest telescopes in space, the Planck spacecraft, recently completed its “first light” survey which began on August 13. Astronomers say the initial data, gathered from Planck’s vantage point at the L2 point in space, is excellent. Planck is studying the Cosmic Microwave Background, looking for variations in temperature that are about a million times smaller than one degree. This is comparable to measuring from Earth the body heat of a rabbit sitting on the Moon.

The initial survey yielded maps of a strip of the sky, one for each of Planck’s nine frequencies. Each map is a ring, about 15° wide, stretching across the full sky.

The the differences in color in the strips indicate the magnitude of the deviations of the temperature of the Cosmic Microwave Background from its average value, as measured by Planck at a frequency close to the peak of the CMB spectrum (red is hotter and blue is colder).

The large red strips trace radio emission from the Milky Way, whereas the small bright spots high above the galactic plane correspond to emission from the Cosmic Microwave Background itself.

In order to do its work, Planck’s detectors must be cooled to extremely low temperatures, some of them being very close to absolute zero (–273.15°C, or zero Kelvin, 0K).

Routine operations are now underway, and surveying will continue for at least 15 months without a break. In approximately 6 months, the first all-sky map will be assembled.

Within its projected operational life of 15 months, Planck will gather data for two complete sky maps. To fully exploit the high sensitivity of Planck, the data will require delicate adjustments and careful analysis. It promises to return a treasure trove that will keep both cosmologists and astrophysicists busy for decades to come.

Source: ESA

What! No Parallel Universe? Cosmic Cold Spot Just Data Artifact

Region in space detected by WMAP cooler than its surroundings. But not really. Rudnick/NRAO/AUI/NSF, NASA.

Rats! Another perplexing space mystery solved by science. New analysis of the famous “cold spot” in the cosmic microwave background reveals, and confirms, actually, that the spot is just an artifact of the statistical methods used to find it. That means there is no supervoid lurking in the CMB, and no parallel universe lying just beyond the edge of our own. What fun is that?

Back in 2004, astronomers studying data from the Wilkinson Microwave Anisotropy Probe (WMAP) found a region of the cosmic microwave background in the southern hemisphere in the direction of the constellation of Eridanus that was significantly colder than the rest by about 70 microkelvin. The probability of finding something like that was extremely low. If the Universe really is homogeneous and isotropic, then all points in space ought to experience the same physical development, and appear the same. This just wasn’t supposed to be there.

Some astronomers suggested the spot could be a supervoid, a remnant of an early phase transition in the universe. Others theorized it was a window into a parallel universe.

Well, it turns out, it wasn’t there.

Ray Zhang and Dragan Huterer at the University of Michigan in Ann Arbor say that the cold spot is simply an artifact of the statistical method–called Spherical Mexican Hat Wavelets–used to analyze the WMAP data. Use a different method of analysis and the cold spot disappears (or at least is no colder than expected).

“We trace this apparent discrepancy to the fact that WMAP cold spot’s temperature profile just happens to favor the particular profile given by the wavelet,” the duo says in their paper. “We find no compelling evidence for the anomalously cold spot in WMAP at scales between 2 and 8 degrees.”

This confirms another paper from 2008 also by Huterer along with colleague Kendrick Smith from the University of Cambridge who showed that the huge void could be considered as a statistical fluke because it had stars both in front of and behind it.

And in fact, one of the earlier papers suggesting the cold spot by Lawrence Rudnick from the University of Minnesota does indeed say that statistical uncertainties have not been accounted for.

Oh well. Now, on to the next cosmological mysteries like dark matter and dark energy!

Zhang and Huterer’s paper.

Huterer and Smith’s paper (2008)

Rudnick’s paper 2007

Original paper “finding” the cold spot

Sources: Technology Review Blog, Science

The Big Bang Writ Little

If you are into Twitter (as I am), you might enjoy this: New Scientist challenged their readers to encompass the Big Bang into a Tweet. That means the description of the event that started everything that is needs to be 140 characters or less –and actually it was only 133 characters because to qualify, the Tweet had to include the #sci140 hashtag so the folks at New Scientist could gather them all together. Some went the complete science route by trying to summarize the physics (at least one person fit in the equation for Hubble’s Law), others quoted (“In the beginning the universe was created. This has made a lot of people very angry and has been widely regarded as a bad move.” — Douglas Adams), others took a religious bend, and still others described the event in how it might sound (boom, bang, kaboom or tweeeet). Here’s my favorite:

@newscientist < &#8734 #sci140 yanikproulx

A fun exercise in brevity.

Here’s the rest of their top 10:

Timeless energy, / all dressed up, no place to go: / had to create space. / – #BigBang #haiku #sci140 – haiQ

God said delB=0 etc, & then light (sym breaking), separation light from darkness (recombination), man created from dirt (evolution) #sci140 – dmadance

#sci140 starburst, molecule, amino acid, protein, cell development, cell division, sex, technology, war, religion, OK magazine. – jonotrumpeto

@newscientist #sci140 Antimatter and matter duke it out. Matter wins 1 billion and one to 1 billion. The matter left expands and makes us. – zeroentropy

#sci140 A place for everything, and everything in one place. Then — kaboom, everything all over the place. – tui4

@newscientist The Big Bang: the moment the universe vanishes when extrapolating its expansion backwards into the past #sci140 – hubi1857

For t<0 some say there was no matter, others say it does not matter. For t>0 its a matter of life and death – as a matter of fact #sci140 – thebeerhunter

an argument between the 9th and 10th dimensions overspilled into the 1st, 2nd, 3rd and 4th. #sci140 – AlexStavrinides

The Big Bang: Basically a ballooning of bosons, belatedly bloating into our beautiful universe. Brought to you by the letter ‘B’. #sci140 – CoyoteTrax

Source: New Scientist

New Way to Measure Curvature of Space Could Unite Gravity Theory

The curvature of space due to gravity.

[/caption]
Einstein’s general theory of relativity describes gravity in terms of the geometry of both space and time. Far from a source of gravity, such as a star like our sun, space is “flat” and clocks tick at their normal rate. Closer to a source of gravity, however, clocks slow down and space is curved. But measuring this curvature of space is difficult. However, scientists have now used a continent-wide array of radio telescopes to make an extremely precise measurement of the curvature of space caused by the Sun’s gravity. This new technique promises to contribute greatly in studying quantum physics.

“Measuring the curvature of space caused by gravity is one of the most sensitive ways to learn how Einstein’s theory of General Relativity relates to quantum physics. Uniting gravity theory with quantum theory is a major goal of 21st-Century physics, and these astronomical measurements are a key to understanding the relationship between the two,” said Sergei Kopeikin of the University of Missouri.

Kopeikin and his colleagues used the National Science Foundation’s Very Long Baseline Array (VLBA) radio-telescope system to measure the bending of light caused by the Sun’s gravity to within one part in 30,000 3,333 (corrected by NRAO and updated here on 9/03/09 — see this link provided by Ned Wright of UCLA for more information on deflection and delay of light). With further observations, the scientists say their precision technique can make the most accurate measure ever of this phenomenon.

Bending of starlight by gravity was predicted by Albert Einstein when he published his theory of General Relativity in 1916. According to relativity theory, the strong gravity of a massive object such as the Sun produces curvature in the nearby space, which alters the path of light or radio waves passing near the object. The phenomenon was first observed during a solar eclipse in 1919.

Though numerous measurements of the effect have been made over the intervening 90 years, the problem of merging General Relativity and quantum theory has required ever more accurate observations. Physicists describe the space curvature and gravitational light-bending as a parameter called “gamma.” Einstein’s theory holds that gamma should equal exactly 1.0.

“Even a value that differs by one part in a million from 1.0 would have major ramifications for the goal of uniting gravity theory and quantum theory, and thus in predicting the phenomena in high-gravity regions near black holes,” Kopeikin said.

To make extremely precise measurements, the scientists turned to the VLBA, a continent-wide system of radio telescopes ranging from Hawaii to the Virgin Islands. The VLBA offers the power to make the most accurate position measurements in the sky and the most detailed images of any astronomical instrument available.

Sun's Path in Sky in Front of Quasars, 2005. Credit: NRAO

The researchers made their observations as the Sun passed nearly in front of four distant quasars — faraway galaxies with supermassive black holes at their cores — in October of 2005. The Sun’s gravity caused slight changes in the apparent positions of the quasars because it deflected the radio waves coming from the more-distant objects.

The result was a measured value of gamma of 0.9998 +/- 0.0003, in excellent agreement with Einstein’s prediction of 1.0.

“With more observations like ours, in addition to complementary measurements such as those made with NASA’s Cassini spacecraft, we can improve the accuracy of this measurement by at least a factor of four, to provide the best measurement ever of gamma,” said Edward Fomalont of the National Radio Astronomy Observatory (NRAO). “Since gamma is a fundamental parameter of gravitational theories, its measurement using different observational methods is crucial to obtain a value that is supported by the physics community,” Fomalont added.

Kopeikin and Fomalont worked with John Benson of the NRAO and Gabor Lanyi of NASA’s Jet Propulsion Laboratory. They reported their findings in the July 10 issue of the Astrophysical Journal.

Source: NRAO

New Limits on Gravitational Waves From the Big Bang

Artists concept of graviational waves. Credit: NASA

[/caption]
The only way to know what the Universe was like at the moment of the Big Bang requires analysis of gravitational waves created when the Universe began. Scientists working with the Laser Interferometer Gravitational-Wave Observatory (LIGO) say their initial investigations of these gravitiation waves have turned up nothing. But that’s a good thing. Not detecting the waves provides constraints about the initial conditions of the universe, and narrows the field of where we actually do need to look in order to find them.

Much like it produced the cosmic microwave background, the Big Bang is believed to have created a flood of gravitational waves — ripples in the fabric of space and time. From our current understanding, gravitational waves are the only known form of information that can reach us undistorted from the beginnings of the Universe. They would be observed as a “stochastic” or random background, and would carry with them information about their violent origins and about the nature of gravity that cannot be obtained by conventional astronomical tools. The existence of the waves was predicted by Albert Einstein in 1916 in his general theory of relativity.

Analysis of data taken over a two-year period, from 2005 to 2007, yields that the stochastic background of gravitational waves has not yet been discovered. But the nondiscovery of the background, described in a new paper in the August 20 Nature, offers its own brand of insight into the universe’s earliest history.

“Since we have not observed the stochastic background, some of these early-universe models that predict a relatively large stochastic background have been ruled out,” said Vuk Mandic, assistant professor at the University of Minnesota and the head of the group that performed the analysis. “We now know a bit more about parameters that describe the evolution of the universe when it was less than one minute old.”

According to Mandic, the new findings constrains models of cosmic strings, objects that are proposed to have been left over from the beginning of the universe and subsequently stretched to enormous lengths by the universe’s expansion; the strings, some cosmologists say, can form loops that produce gravitational waves as they oscillate, decay, and eventually disappear.

“Since we have not observed the stochastic background, some of these early-universe models that predict a relatively large stochastic background have been ruled out,” said Mandic. “If cosmic strings or superstrings exist, their properties must conform with the measurements we made—that is, their properties, such as string tension, are more constrained than before.”

This is interesting, he says, “because such strings could also be so-called fundamental strings, appearing in string-theory models. So our measurement also offers a way of probing string-theory models, which is very rare today.”

The analysis used data collected from the LIGO interferometers in Hanford, Wash., and Livingston, La. Each of the L-shaped interferometers uses a laser split into two beams that travel back and forth down long interferometer arms. The two beams are used to monitor the difference between the two interferometer arm lengths.

The next phase of the project, called Advanced LIGO, will go online in 2014, and be 10 times more sensitive than the current instrument. It will allow scientists to detect cataclysmic events such as black-hole and neutron-star collisions at 10-times-greater distances.

The Nature paper is entitled “An Upper Limit on the Amplitude of Stochastic Gravitational-Wave Background of Cosmological Origin.”

Source: EurekAlert

What If There Is Only One Universe?

When it comes to universes, perhaps one is enough after all.

Many theories in physics and cosmology require the existence of alternate, or parallel, universes.  But Dr. Lee Smolin of the Perimeter Institute for Theoretical Physics in Waterloo, Canada, explains the flaws of theories that suggest our universe is just one of many, and which also perpetuate the notion that time does not exist.  Smolin, author of the bestselling science book ‘The Trouble with Physics’ and a founding member of the Perimeter Institute, explains his views in the June issue of Physics World.

Smolin explains how theories describing a myriad of possible universes, or a “multiverse”, with many dimensions and particles and forces have become more popular in the last few years. However, through his work with the Brazilian philosopher Roberto Mangabeira Unger, Smolin believes that multiverse theories, which imply that time is not a fundamental concept, are “profoundly mistaken”.

Smolin says a timeless multiverse means our laws of physics can’t be determined from experiment.  And he explains the unclear connection between fundamental laws, which are unique and applicable universally, and effective laws, which hold based on what we can actually observe.

Smolin suggests new principles that rethink the notion of physical law to apply to a single universe.  These principles say there is only one universe; that all that is real is real in a moment, as part of a succession of moments; and that everything real in each moment is a process of change leading to future moments. As he explains, “If there is just one universe, there is no reason for a separation into laws and initial conditions, as we want a law to explain just one history of one universe.”

He hopes these principles will bring a fresh adventure in science.

If we accept there is only one universe and that time is a fundamental property of nature, then this opens up the possibility that the laws of physics evolve with time. As Smolin writes, “The notion of transcending our time-bound experiences in order to discover truths that hold timelessly is an unrealizable fantasy. When science succeeds, we do nothing of the sort; what we physicists really do is discover laws that hold in the universe we experience within time. This, I would claim, should be enough; anything beyond that is more a religious urge for transcendence than science.”

Source: Institute of Physics

Cosmologists Improve on Standard Candles Measurement

The warm colors in this diagram stand for strong correlations of the brightness ratios between two wavelengths and a Type Ia supernova's absolute magnitude. (Diagram colors are unrelated to those in the spectrum itself.) Wavelengths are in nanometers. The upper left triangle shows correlations with uncorrected magnitudes; at lower right are correlations using color-corrected data. Credit: Nearby Supernova Factory

[/caption]
Cosmologists have found a new and quicker technique that establishes the intrinsic brightness of Type Ia supernovae more accurately than ever before. These exploding stars are the best standard candles for measuring cosmic distances and are the tools that made the discovery of dark energy possible. An international team has found a way to do the job of measuring stellar distances in just a single night as opposed to months of observations by simply measuring the ratio of the flux (visible power, or brightness) between two specific regions in the spectrum of a Type Ia supernova. With this new method, a supernova’s distance can be determined to better than 6 percent uncertainty.

Using classic methods, which are based on a supernova’s color and the shape of its light curve – the time it takes to reach maximum brightness and then fade away – the distance to Type Ia supernovae can be measured with a typical uncertainty of 8 to 10 percent. But obtaining a light curve takes up to two months of high-precision observations. The new method provides better correction with a single night’s full spectrum, which can be scheduled based on a much less precise light curve.

Members of the international Nearby Supernova Factory (SNfactory), a collaboration among the U.S. Department of Energy’s Lawrence Berkeley National Laboratory, a consortium of French laboratories, and Yale University, searched the spectra of 58 Type Ia supernovae in the SNfactory’s dataset and found the key spectroscopic ratio.

The new brightness-ratio correction appears to hold no matter what the supernova’s age or metallicity (mix of elements), its type of host galaxy, or how much it has been dimmed by intervening dust.

Team member Stephen Bailey from the Laboratory of Nuclear and High-Energy Physics (LPNHE) in Paris, France, says that the SNfactory’s library of high-quality spectra is what made his successful results possible. “Every supernova image the SNfactory takes is a full spectrum,” he says. “Our dataset is by far the world’s largest collection of excellent Type Ia time series, totaling some 2,500 spectra.”

The most accurate standardization factor Bailey found was the ratio between the 642-nanometer wavelength, in the red-orange part of the spectrum, and the 443-nanometer wavelength, in the blue-purple part of the spectrum. In his analysis he made no assumptions about the possible physical significance of the spectral features. Nevertheless he turned up multiple brightness ratios that were able to improve standardization over current methods applied to the same supernovae.

SNfactory member Rollin Thomas of Berkeley Lab’s Computational Research Division, who analyzes the physics of supernovae, says, “While the luminosity of a Type Ia supernova indeed depends on its physical features, it also depends on intervening dust. The 642/443 ratio somehow aligns those two factors, and it’s not the only ratio that does. It’s as if the supernova were telling us how to measure it.”

The Nearby Supernova Factory describes the discovery of the new standardization technique in an article in the forthcoming issue of the journal Astronomy & Astrophysics, and the abstract is available online.

Source: Berkeley

Astronomers Closing in on Dark Energy with Refined Hubble Constant


The name “dark energy” is just a placeholder for the force — whatever it is — that is causing the Universe to expand. But astronomers are perhaps getting closer to understanding this force. New observations of several Cepheid variable stars by the Hubble Space Telescope has refined the measurement of the Universe’s present expansion rate to a precision where the error is smaller than five percent. The new value for the expansion rate, known as the Hubble constant, or H0 (after Edwin Hubble who first measured the expansion of the universe nearly a century ago), is 74.2 kilometers per second per megaparsec (error margin of ± 3.6). The results agree closely with an earlier measurement gleaned from Hubble of 72 ± 8 km/sec/megaparsec, but are now more than twice as precise.

The Hubble measurement, conducted by the SHOES (Supernova H0 for the Equation of State) Team and led by Adam Riess, of the Space Telescope Science Institute and the Johns Hopkins University, uses a number of refinements to streamline and strengthen the construction of a cosmic “distance ladder,” a billion light-years in length, that astronomers use to determine the universe’s expansion rate.

Hubble observations of the pulsating Cepheid variables in a nearby cosmic mile marker, the galaxy NGC 4258, and in the host galaxies of recent supernovae, directly link these distance indicators. The use of Hubble to bridge these rungs in the ladder eliminated the systematic errors that are almost unavoidably introduced by comparing measurements from different telescopes.

Steps to the Hubble Constant.  Credit: NASA, ESA, and A. Feild (STScI)
Steps to the Hubble Constant. Credit: NASA, ESA, and A. Feild (STScI)

Riess explains the new technique: “It’s like measuring a building with a long tape measure instead of moving a yard stick end over end. You avoid compounding the little errors you make every time you move the yardstick. The higher the building, the greater the error.”

Lucas Macri, professor of physics and astronomy at Texas A&M, and a significant contributor to the results, said, “Cepheids are the backbone of the distance ladder because their pulsation periods, which are easily observed, correlate directly with their luminosities. Another refinement of our ladder is the fact that we have observed the Cepheids in the near-infrared parts of the electromagnetic spectrum where these variable stars are better distance indicators than at optical wavelengths.”

This new, more precise value of the Hubble constant was used to test and constrain the properties of dark energy, the form of energy that produces a repulsive force in space, which is causing the expansion rate of the universe to accelerate.

By bracketing the expansion history of the universe between today and when the universe was only approximately 380,000 years old, the astronomers were able to place limits on the nature of the dark energy that is causing the expansion to speed up. (The measurement for the far, early universe is derived from fluctuations in the cosmic microwave background, as resolved by NASA’s Wilkinson Microwave Anisotropy Probe, WMAP, in 2003.)

Their result is consistent with the simplest interpretation of dark energy: that it is mathematically equivalent to Albert Einstein’s hypothesized cosmological constant, introduced a century ago to push on the fabric of space and prevent the universe from collapsing under the pull of gravity. (Einstein, however, removed the constant once the expansion of the universe was discovered by Edwin Hubble.)

Detail from NGC 3021. Credit: NASA, ESA, and A. Riess (STScI/JHU)

“If you put in a box all the ways that dark energy might differ from the cosmological constant, that box would now be three times smaller,” says Riess. “That’s progress, but we still have a long way to go to pin down the nature of dark energy.”

Though the cosmological constant was conceived of long ago, observational evidence for dark energy didn’t come along until 11 years ago, when two studies, one led by Riess and Brian Schmidt of Mount Stromlo Observatory, and the other by Saul Perlmutter of Lawrence Berkeley National Laboratory, discovered dark energy independently, in part with Hubble observations. Since then astronomers have been pursuing observations to better characterize dark energy.

Riess’s approach to narrowing alternative explanations for dark energy—whether it is a static cosmological constant or a dynamical field (like the repulsive force that drove inflation after the big bang)—is to further refine measurements of the universe’s expansion history.

Before Hubble was launched in 1990, the estimates of the Hubble constant varied by a factor of two. In the late 1990s the Hubble Space Telescope Key Project on the Extragalactic Distance Scale refined the value of the Hubble constant to an error of only about ten percent. This was accomplished by observing Cepheid variables at optical wavelengths out to greater distances than obtained previously and comparing those to similar measurements from ground-based telescopes.

The SHOES team used Hubble’s Near Infrared Camera and Multi-Object Spectrometer (NICMOS) and the Advanced Camera for Surveys (ACS) to observe 240 Cepheid variable stars across seven galaxies. One of these galaxies was NGC 4258, whose distance was very accurately determined through observations with radio telescopes. The other six galaxies recently hosted Type Ia supernovae that are reliable distance indicators for even farther measurements in the universe. Type Ia supernovae all explode with nearly the same amount of energy and therefore have almost the same intrinsic brightness.

By observing Cepheids with very similar properties at near-infrared wavelengths in all seven galaxies, and using the same telescope and instrument, the team was able to more precisely calibrate the luminosity of supernovae. With Hubble’s powerful capabilities, the team was able to sidestep some of the shakiest rungs along the previous distance ladder involving uncertainties in the behavior of Cepheids.

Riess would eventually like to see the Hubble constant refined to a value with an error of no more than one percent, to put even tighter constraints on solutions to dark energy.

Source: Space Telescope Science Institute

New Hubble Survey Supports Cold Dark Matter in Early Universe

NICMOS Image of the GOODS North field. Credit: C Conselice, A Bluck, GOODS NICMOS Team.

[/caption]

A new survey is revealing how the most massive galaxies formed in the early Universe, and the findings support the theory that Cold Dark Matter played a role. A team of scientists from six countries used the NICMOS near infrared camera on the Hubble Space Telescope to carry out the deepest ever survey of its type at near infrared wavelengths. Early results show that the most massive galaxies, which have masses roughly 10 times larger than the Milky Way, were involved in significant levels of galaxy mergers and interactions when the Universe was just 2-3 billion years old.

“As almost all of these massive galaxies are invisible in the optical wavelengths, this is the first time that most of them have been observed,” said Dr. Chris Conselice, who is the Principal Investigator for the survey. “To assess the level of interaction and mergers between the massive galaxies, we searched for galaxies in pairs, close enough to each other to merge within a given time-scale. While the galaxies are very massive and at first sight may appear fully formed, the results show that they have experienced an average of two significant merging events during their life-times.”

The results show that these galaxies did not form in a simple collapse in the early universe, but that their formation is more gradual over the course of the Universe’s evolution, taking about 5 billion years.

NICMOS image of merging galaxies.  Credit: C Conselice, A Bluck, GOODS NICMOS Team
NICMOS image of merging galaxies. Credit: C Conselice, A Bluck, GOODS NICMOS Team

“The findings support a basic prediction of the dominant model of the Universe, known as Cold Dark Matter,” said Conselice, “so they reveal not only how the most massive galaxies are forming, but also that the model that’s been developed to describe the Universe, based on the distribution of galaxies that we’ve observed overall, applies in its basic form to galaxy formation.”

The Cold Dark Matter theory is a refinement of the Big Bang theory, which includes the assumption that most of the matter in the Universe consists of material that cannot be observed by its electromagnetic radiation and hence is dark matter, while at the same time the particles making up this matter are slow and are thereforer cold.

The preliminary results are based on a paper led by PhD student Asa Bluck at the University of Nottingham, and were presented this week at the European Week of Astronomy and Space Science at the University of Hertfordshire.

The observations are part of the Great Observatories Origins Deep Survey (GOODS), a campaign that is using NASA’s Spitzer, Hubble and Chandra space telescopes together with ESA’s XMM Newton X-ray observatory to study the most distant Universe.

Source: RAS