The month of August is upon us once again, bringing with it humid days and sultry nights for North American observers.
You’ll often hear the first few weeks of August referred to as the Dog Days of Summer. Certainly, the oppressive midday heat may make you feel like lounging around in the shade like our canine companions. But did you know there is an astronomical tie-in for the Dog Days as well?
We’ve written extensively about the Dog Days of Summer previously, and how the 1460 year long Sothic Cycle of the ancient Egyptians became attributed to the Greek adoption of Sothis, and later in medieval times to the ‘Dog Star’ Sirius. Like the Blue Moon, say something wrong enough, long enough, and it successfully sticks and enters into meme-bank of popular culture.

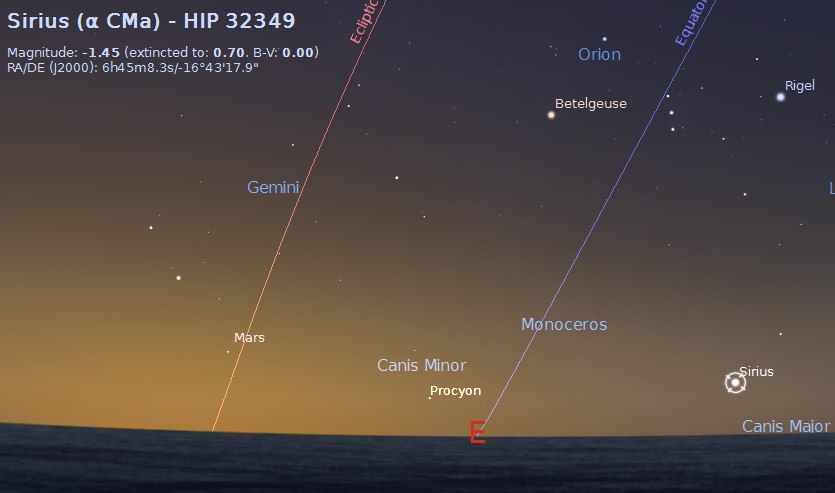
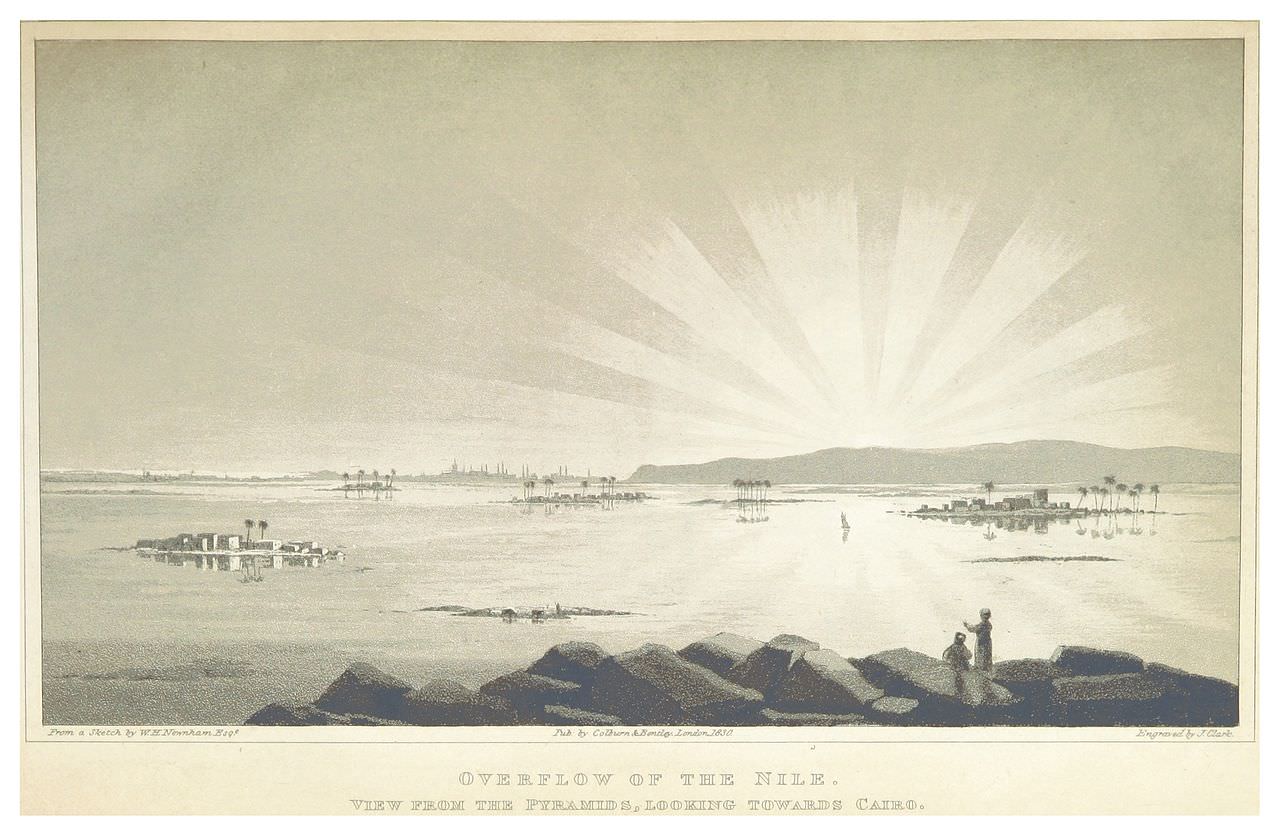
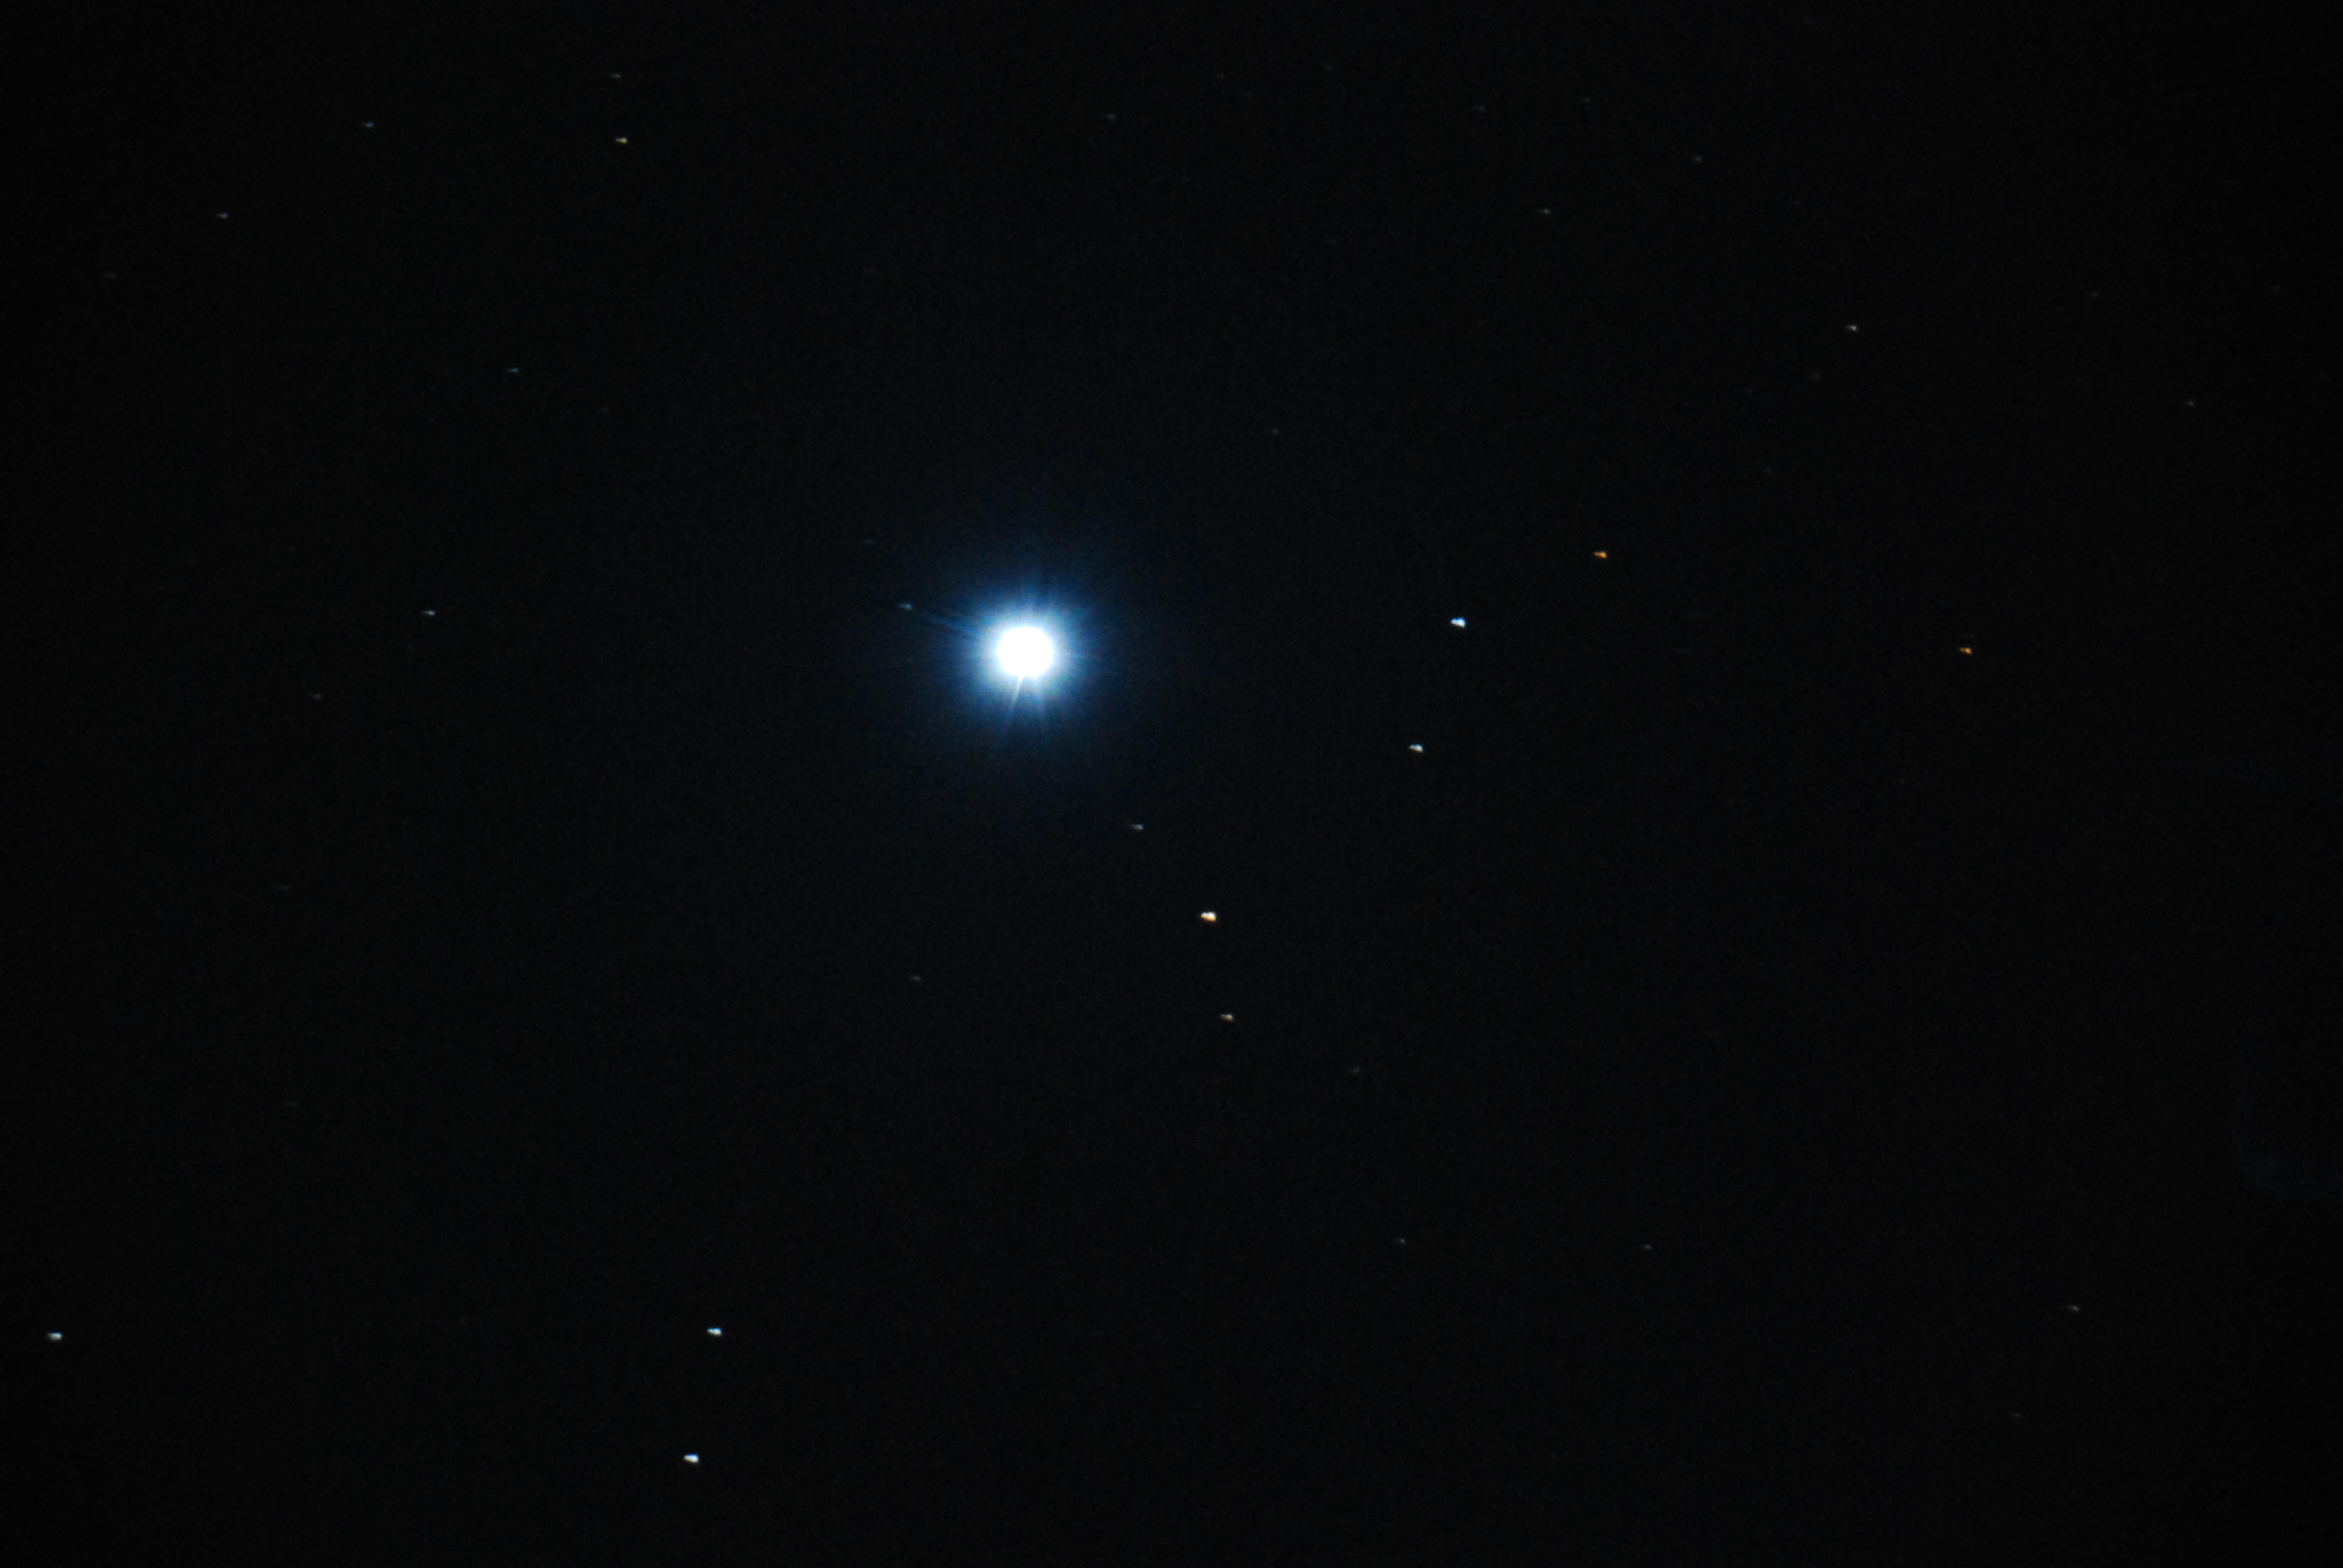
A water monopoly empire, the Egyptians livelihood rested on knowing when the annual flooding of the Nile was about to occur. To this end, they relied on the first seasonal spotting of Sirius at dawn. Sirius is the brightest star in the sky, and you can just pick out the flicker of Sirius in early August low to the southeast if you know exactly where to look for it.
Sirius lies at a declination of just under 17 degrees south of the celestial equator. It’s interesting to note that in modern times, the annual flooding of the Nile (prior to the completion of the Aswan Dam in 1970) is commemorated as occurring right around August 15th. Why the discrepancy? Part of it is due to the 26,000 year wobbling of the Earth’s axis known as the Precession of the Equinoxes; also, the Sothic calendar had no intercalculary or embolismic (think leap days) to keep a Sothic year in sync with the sidereal year. The Sothic cycle from one average first sighting of Sirius to another is 365.25 days, and just 9 minutes and 8 seconds short of a sidereal year.
But that does add up over time. German historian Eduard Meyer first described the Sothic Cycle in 1904, and tablets mention its use as a calendar back to 2781 BC. And just over 3 Sothic periods later (note that 1460= 365.25 x 4, which is the number of Julian years equal to 1461 Sothic years, as the two cycles ‘sync up’), and the flooding of the Nile now no longer quite coincides with the first sighting of Sirius.
Such a simultaneous sighting with the sunrise is known in astronomy as a heliacal rising. Remember that atmospheric extinction plays a role sighting Sirius in the swampy air mass of the atmosphere low to the horizon, taking its usual brilliant luster of magnitude -1.46 down to a more than a full magnitude and diminishing its intensity over 2.5 times.
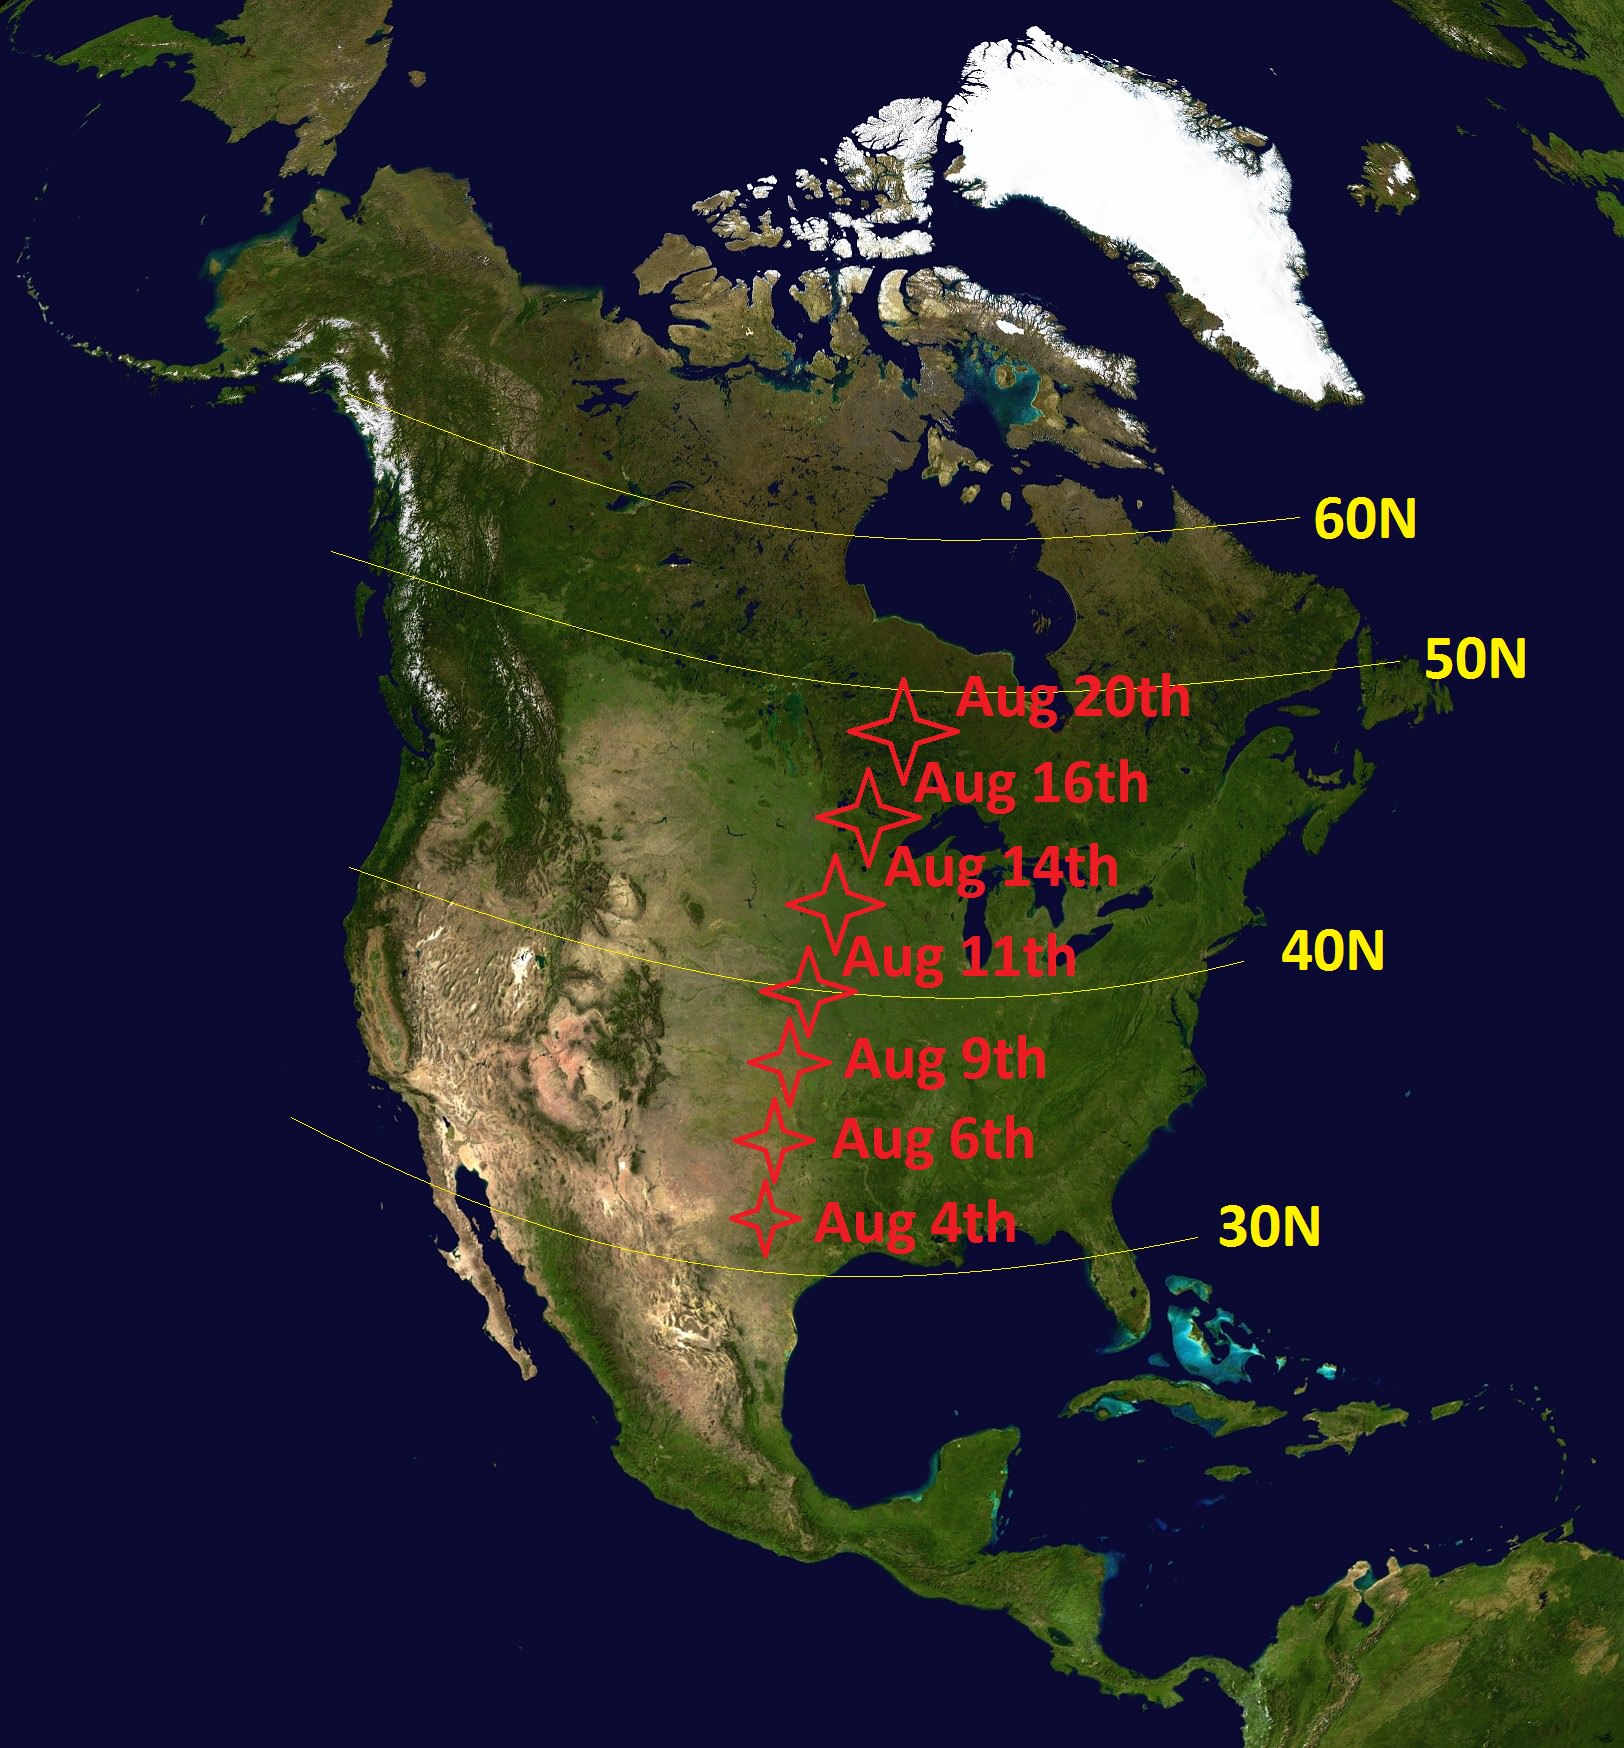
This year, we transposed the seasonal predicted ‘first sightings’ of Sirius versus latitude onto a map of North America:
Another factor that has skewed the date of first ‘Sirius-sign’ is the apparent motion of the star itself. At 8.6 light years distant, Sirius appears to move 1.3 arc seconds per year. That’s not much, but over the span of one Sothic cycle, that amounts up to 31.6’, just larger than the average diameter of a Full Moon.
Sirius has been the star of legends and lore as well, not the least of which is the curious case of the Dogon people of Mali and their supposed privileged knowledge of its white dwarf companion star. Alvan Graham Clark and his father discovered Sirius B in 1862 as they tested out their shiny new 18.5-inch refractor. And speaking of Sirius B, keep a telescopic eye on the Dog Star, as the best chances to spy Sirius B peeking out from the glare of its primary are coming right up around 2020.
Repeating the visual feat of spying Sirius B low in the dawn can give you an appreciation as to the astronomical skill of ancient cultures. They not only realized the first sighting of Sirius in the dawn skies coincided with the annual Nile flooding, but they identified the discrepancy between the Sothic and sidereal year, to boot. Not bad, using nothing but naked eye observations. Such ability must have almost seemed magical to the ancients, as if the stars had laid out a celestial edge for the Egyptians to exploit.
You can also exploit one method of teasing out Sirius from the dawn sky a bit early that wasn’t available to those Egyptian astronomer priests: using a pair of binoculars to sweep the skies. Can you nab Sirius with a telescope and track it up into the daytime skies? Sirius is just bright enough to see in the daytime against a clear blue sky with good transparency if you know exactly where to look for it.
Let the Dog Days of 2015 begin!