Van Allen Safe Zone Migrates

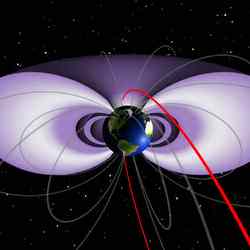
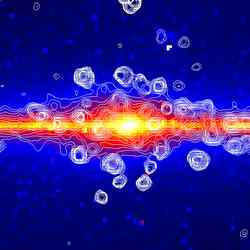
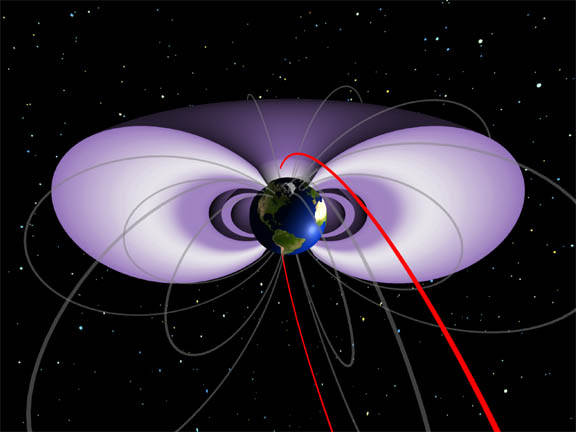
The Van Allen Belts pulsing from solar particles. Image credit: NASA/Tom Bridgman. Click to enlarge
A “safe zone” in the radiation belts surrounding Earth moves higher in altitude and latitude during peaks in solar activity, according to new research by a NASA-led team. The safe zone offers reduced radiation intensities to any potential spacecraft that must fly in the radiation belt region.

“This new research brings us closer to understanding how a section of the radiation belt disappears,” said Dr. Shing Fung of NASA’s Goddard Space Flight Center, Greenbelt, Md. Fung is lead author of a paper on this research appearing in the on-line version of Geophysical Research Letters February 22.

The team based its results on measurements of high-speed particles (electrons), which comprise the “Van Allen radiation belt”, from the National Oceanic and Atmospheric Administration’s series of polar-orbiting meteorological spacecraft during 1978 to 1999. As the spacecraft flew in their polar orbits, they detected fewer radiation belt particles at a certain latitude range, indicating safe zone passages by the spacecraft. The researchers compared the data taken during relatively low solar activity periods, called solar minimum, to data from peak solar activity periods, called solar maximum. They noticed a shift in the safe-zone location towards higher latitudes, and therefore altitudes, during solar maximum.

If the radiation belts were visible, they would resemble a pair of donuts around the Earth, one inside the other with the Earth in the “hole” of the innermost donut. The safe zone, called the “slot region”, would appear as a gap between the inner and outer donut. The belts are actually comprised of high-speed electrically charged particles (electrons and atomic nuclei) that are trapped in the Earth’s magnetic field.

The Earth’s magnetic field can be represented by lines of magnetic force emerging from the South Polar region, out into space and back into the North Polar region. Because radiation-belt particles are charged, their motions are guided by the magnetic lines of force. Trapped particles would bounce between the poles while spiraling around the field lines.

Very Low Frequency (VLF) radio waves and background gas (plasma) are also trapped in this region. Just like a prism that can bend a light beam, the plasma can bend the VLF wave propagation paths, causing the waves to flow along the Earth’s magnetic field. VLF waves clear the safe zone by interacting with the radiation belt particles, removing a little of their energy and changing their direction. This lowers the place above the polar regions where the particles bounce (called the mirror point). Eventually, the mirror point becomes so low that it is in the Earth’s atmosphere. When this happens, the trapped particles collide with atmospheric particles and are lost.

According to the team, the safe zone is created in a region where conditions are favorable for the VLF waves to kick the particles. Their research is the first indication that the location of this region can change with the solar activity cycle. The Sun goes through an 11-year cycle of activity, from maximum to minimum, and back again. During solar maximum, increased solar ultraviolet (UV) radiation heats the Earth’s upper atmosphere, the ionosphere, causing it to expand. This increases the density of the plasma trapped in Earth’s magnetic field.

Favorable conditions for the VLF wave-particle interaction depend on the specific combination of plasma density and magnetic field strength. Although plasma density generally decreases with altitude, expansion of the ionosphere during solar maximum makes the plasma denser at the safe zone’s solar-minimum altitude, and forces the favorable plasma density for the safe zone to migrate to a higher altitude. In addition, magnetic field strength also decreases with altitude. To find the favorable magnetic field strength for the safe zone at higher altitudes, one would have to migrate toward the poles (higher latitudes), where the magnetic field lines are more concentrated and thus stronger.

“This discovery helps narrow down the search for the primary wave-particle interaction region that creates the safe zone,” said Fung. “Although no known spacecraft uses the safe zone extensively now, our knowledge could help planning and operations of future missions that want to take advantage of the zone.”

According to the researchers, their discovery was enabled by a new data selection and retrieval tool developed by the team, called the Magnetospheric State Query System. The research was funded by NASA and the National Research Council. The team includes Fung, Dr. Xi Shao (National Research Council, Washington), and Dr. Lun C. Tan (QSS Group, Inc., Lanham, Md.).

Original Source: NASA News Release

New Type of Star Discovered

An artist’s impression of a neutron star with its magnetic field lines showing. Image credit: Russell Kightly Media. Click to enlarge
Astronomers of the University of Manchester’s Jodrell Bank Observatory (UK) have led an international team which used the Parkes radio telescope in Australia to find a new kind of cosmic object which sends out radio flashes. These flashes are very short and very rare: one hundredth of a second long, the total time the objects are visible amounts to only about one tenth of a second per day.

The discovery will be published in this week’s issue of the journal Nature.

Eleven sources of flashes have been found in different parts of the plane of the Milky Way in a survey for radio pulsars, which are small, compressed, highly-magnetised, neutron stars that produce regular pulses as they rotate, like cosmic light-houses. While that survey found over 800 pulsars and is the most successful in history, it also uncovered this new type of star. Rather than searching only for the periodic trains of pulses, the astronomers developed new techniques for detecting single short bursts of radiation.

Dr Maura McLaughlin explained: “It was difficult to believe that the flashes we saw came from outer space, because they looked very much like man-made interference”. The isolated flashes last for between 2 and 30 milliseconds. In between, for times ranging from 4 minutes to 3 hours, the new stars are silent.

After confirmation of their celestial nature, studies over the next 3 years revealed that 10 of the 11 sources have underlying periods of between 0.4 seconds and seven seconds.

“The periodicities found suggest that these new sources are also rotating neutron stars, but different from radio pulsars”, says Professor Andrew Lyne. “It is for this reason that we call them Rotating Radio Transients or RRATs. It’s as if, following a flash, a RRAT has to gather its strength during perhaps a thousand rotations before it can do it again !”.

RRATs are a new flavour of neutron stars in addition to the conventional radio pulsars and to the magnetars, which are also believed to be rotating neutron stars and are known to give off powerful X-ray and gamma-ray bursts. It is possible that RRATs represent a different evolutionary phase of neutron stars to or from magnetars.

The new objects probably far outnumber both their cousins. “Because of their ephemeral nature, RRATs are extremely difficult to find and so we believe that there are about 4 RRATs for every pulsar” says Dr Richard Manchester of the Australia Telescope National Facility. He is part of the team which also includes astronomers from the US, Canada and Italy.

Original Source: Jodrell Bank Observatory

Gemini Counts Up the Dark Matter in NGC 3379

NGC 3379. Image credit: NASA/University of Michigan. Click to enlarge
Using Gemini observations of globular clusters in NGC 3379 (M105), a team led by PhD student Michael Pierce and Prof. Duncan Forbes of Swinburne University in Australia, have found evidence for normal quantities of dark matter in the galaxy??bf?s dark halo. This is contrary to previous observations of planetary nebulae that indicated a paucity of dark matter in the galaxy.

The observations of 22 globular clusters in the Leo Group elliptical galaxy were made using the Gemini Multi-Object Spectrograph (GMOS) on Gemini North in early 2003. The data were obtained in the GMOS multi-slit mode with exposures of 10 hours on-source at a spectral resolution of FWHM ~4Aa over an effective wavelength range of 3800A-6660A. The final spectra have a signal-to-noise ratio of 18-58/A at 5000 A. The spectroscopic data allowed the team to derive ages, metallicities and α-element abundance ratios for the sample of globular clusters. All of the globular clusters were found to be >~ 10 Gyr, with a wide range of metallicities. A trend of decreasing α-element abundance ratio with increasing metallicity is also identified.

Most significantly, including 14 extra globular clusters from Puzia, et al. (2004), the projected velocity dispersion of the globular cluster system was found to be constant with radius from the galaxy center, indicating significant dark matter at large radii in its halo. This result is in stark contrast to the ??bf?No/Low Dark Matter??bf? interpretation by Romanowsky, et al. (2003) in the journal Science using observations of planetary nebula that indicated a decrease in the velocity dispersion profile with radius.

Reconciling the two velocity dispersion profiles is possible. Dekel, et al. (2005) recently showed that stellar orbits in the outer regions of merger-remnant elliptical galaxies are elongated and that declining planetary nebula velocity dispersions do not necessarily imply a dearth of dark matter.

Another possibility the authors suggest is that NGC 3379 could be a face-on S0 galaxy (as originally suggested by Capaccioli, et al. 1991). If a significant fraction of the planetary nebulae belong to the disk, this could suppress the line-of-sight velocity dispersion of the planetary nebulae relative to that of the globular clusters that lie in a more spherical halo.

Original Source: Gemini Observatory

So, Is Pluto a Planet or Not?

Hubble photograph of Pluto and its three moons. Image credit: Hubble. Click to enlarge.
Unfortunately, the Solar System isn’t so simple. The case for Pluto’s planethood status has gotten a little eroded since its discovery, and there are further challenges facing it into the future.

The four gas giants are clearly planets. They dominate their respective orbits, and have clusters of moons, rings and all sorts of features that separate them from the rock and rubble of asteroids, comets, and other icy objects. Pluto, on the other hand, is nestled inside the Kuiper Belt; a vast population of ice bodies extending beyond the orbit of Neptune. There are an estimated 70,000 objects in the belt larger than 100 km (62 miles) across, and Pluto appears to just be a particularly large example.

As powerful observatories and space-based telescopes push out our understanding of the Kuiper Belt, many new objects have been discovered; several are close in size to Pluto. For every scientific measurement you can give Pluto: size, mass, moons, orbit, it ends up being a large Kuiper Belt Object. The brave members of the Bad Astronomy/Universe Today forum are giving this challenge their best attempt to define a planet.

And this controversy has been expanded with the discovery of 2003UB313 by the team of Michael Brown, Chad Trujillo, and David Rabinowitz. Also part of the Kuiper Belt, this object – code named Xena for now – is about 3000 km across. That makes it 700 km (430 miles) larger than Pluto! Its 557-year orbit is highly eccentric, varying between 38 and 98 astronomical units (the distance of the Earth to the Sun). Pluto, on the other hand, has an orbit that varies between 29 and 49 AU, and Neptune is 30 AU.

So there are times when Xena gets closer to the Sun than Pluto… and it’s bigger. Oh, and it probably has a moon too (code named Gabrielle). Is Xena a planet? If not, why does Pluto get to remain a planet, since it’s smaller, and sometimes orbits further from the Sun.

Objects have been unplaneted already. Before astronomers realized there were thousands of asteroids in the main asteroid belt, the first 4 discovered were considered planets for several decades: Ceres, Pallas, Juno and Vesta.

What’s a planet then? The International Astronomical Union has developed some definitions in 2001 for extrasolar planets, and modified them as recently as 2003, so we can start there.

Under their definition, planets are any objects orbiting stars or stellar remnants (like pulsars) which are below the limiting mass for thermonuclear fusion of deuterium. This sets an upper limit at about 13 times the mass of Jupiter.

What about a lower limit? Well, the IAU goes on to state that the minimum size/mass for an extrasolar planet should be under the same criteria for what’s used to define planets in the Solar System. This brings us right back to the beginning. When super powerful telescopes are developed that can detect objects as small as Pluto around other stars, whether or not they’re planets depends on Pluto’s planetary status.

Back to the beginning, then.

Mike Brown, one of the astronomers who original discovered Xena, has heard rumours that the International Astronomical Union is going to be discussing this dilemma at their upcoming meeting in Prague in August 2006. We could wind up with 8 planets (sorry Pluto), 9 planets (nothing changes), or 10 planets (welcome Xena and all future super-Plutos). And if the IAU extends this to 10 planets, will 11 be around the corner? Are you ready to memorize the 30 planets?

Brown states on his website:

  • A special committee of the International Astronomical Union (IAU) was charged with determining “what is a planet.”
  • Sometime around the end of 2005, this committee voted by a narrow margin for the “pluto and everything bigger” definition, or something close to it.
  • The executive committee of the IAU then decided to ask the Division of Planetary Sciences (DPS) of the American Astronomical Society to make a recommendation.
  • The DPS asked their committee to look in to it.
  • The DPS committee decided to form a special committee.
  • Rumor has emerged that when the IAU general assembly meets in August in Prauge they will make a decision on how to make a final decision!

Whatever they decide, NASA is going to see Pluto up close. New Horizons just launched earlier this year, and it will take 9 years to reach Pluto in 2015. Its Pluto/Charon encounter will begin in July, and last for more than 100 days, giving us our first close up look at this planet/big Kuiper Belt Object. By the time it arrives, we can only hope the IAU has made up their minds.

If the decision were up to me, I’d say Pluto is a planet. For starters we wouldn’t have to go back and edit all those astronomy textbooks, websites, sculptures, museum exhibits and PBS documentaries. Our Solar System just isn’t so simple; objects scale from the tiny to the huge, with all sizes in between. Any decision on Pluto’s planethood will be an arbitrary one, and the arbitrary decision I like is… Pluto’s a planet.

Written by Fraser Cain

Great Mercury Viewing This Week

Mercury on Feb. 13, 2006. Image credit: Jeffrey Beall. Click to enlarge
It’s not every day you get to see a shrinking planet. Today could be the day.

Step outside this evening at sunset and look west toward the glow of the setting sun. As the sky fades to black, a bright planet will emerge. It’s Mercury, first planet from the sun, also known as the “Incredible Shrinking Planet.”

“This is only the second time in my life I’ve seen Mercury,” says sky watcher Jeffrey Beall who snapped this picture looking west from his balcony in Denver, Colorado:

Mercury is the bright “star” just above the mountain ridge, rivaling the city lights.

Mercury is elusive because it spends most of its time hidden by the glare of the sun. This week is different. From now until about March 1st, Mercury moves out of the glare and into plain view. It’s not that Mercury is genuinely farther from the sun. It just looks that way because of the Earth-sun-Mercury geometry in late February. A picture is worth a thousand words: diagram.

Friday, Feb. 24th, is the best day to look (sky map); that’s the date of greatest elongation or separation from the sun. Other dates of note are Feb 28th (sky map) and March 1st (sky map) when the crescent moon glides by Mercury??bf?very pretty.

When you see Mercury popping out of the evening twilight, you’re looking at a very strange place. “Shrinking” is a good example:

In 1974, NASA’s Mariner 10 spacecraft flew by Mercury and, for the first time, photographed the planet from close range. Cameras revealed a densely cratered world??bf?with wrinkles. Planetary geologists call them “lobate scarps” and, like wrinkles on a raisin, they are thought to be a sign of shrinking. What would make a planet shrink? One possibility: Mercury’s oversized iron core has been cooling for billions of years, and its contraction may be the driving force behind the wrinkles. No one knows for sure.

No one knows because Mercury has hardly been explored. Only one spacecraft has ever been there, and during its oh-so-brief visit Mariner 10 managed to photograph less than half (45%) of Mercury’s surface: image. The majority is terra incognita.

Another puzzle is the mystery-substance at Mercury’s poles. Radio astronomers have pinged Mercury from afar using radars on Earth, and they have found something very bright in Mercury’s polar craters. Again, no one knows what it is, although a favorite possibility is ice. Frozen water is a good reflector of radio waves and would explain the observations nicely.

How could frozen water exist on Mercury? The sun heats the planet’s surface to 400 ??bf?C (750 ??bf?F) or more, too hot for frozen anything. Yet deep down in some polar craters, researchers believe, the sun never shines. In permanent shadow, the temperature drops below -212??bf? C (-350??bf? F). Suppose a piece of an icy comet or meteorite landed in such a crater; some of the ice might survive.

Or it could be something else entirely.

What does the unknown half of Mercury look like? Is the planet really shrinking? Can ice stay frozen in an inferno? Mercury poses many questions: list. A new NASA probe named “MESSENGER” is en route to find some answers, but it will not reach Mercury until 2008.

For now, one can only peer into the twilight and wonder. Give it a try, this evening.

Original Source: NASA News Release

The Milky Way Shines in X-Rays Too

The X-ray background consists of a huge number of faint objects. Image credit: NASA Click to enlarge
Using the most sensitive X-ray map of the Galaxy, obtained combining 10 years of data of Rossi XTE orbital observatory, scientists from the Max Planck Institute for Astrophysics have discovered the origin of the galactic background emission. They show that it consists of emission from a million accreting white dwarf binaries and hundreds of millions of normal stars with active coronas.

Nearly 400 years after Galileo determined that the wispy Milky Way actually comprises a multitude of individual stars, scientists using NASA’s Rossi X-ray Timing Explorer have done the same for the X-ray Milky Way.

The origin of the so-called galactic X-ray background has been a long-standing mystery. Scientists now say that this blanket of X-ray light is not diffuse, as many have thought, but emanates from untold hundreds of millions of individual sources dominated by a type of dead star called a white dwarf.

If confirmed, this new finding would have a profound impact on our understanding of the history of our galaxy, from star-formation and supernova rates to stellar evolution. The results solve major theoretical problems, yet point to a surprising undercounting of stellar objects.

Scientists from the Max Planck Institute for Astrophysics (MPA) in Garching, Germany, and the Space Research Institute of the Russian Academy of Sciences in Moscow discuss these results in two papers published in Astronomy & Astrophysics.

“From an airplane you can see a diffuse glow from a city at night,” said Dr. Mikhail Revnivtsev of MPA, lead author on one of the papers. “To say a city produces light is not enough. Only when you get closer do you see individual sources that make up that glow – the house lights, street lamps and automobile headlights. In this respect, we have identified the individual sources of local X-ray light. What we found will surprise many scientists.”

X-rays are a high-energy form of light, invisible to our eyes and far more energetic than optical and ultraviolet light. Our eyes see individual stars sprinkled in a largely dark sky. In X-ray bandwidths the sky is never dark; there is a pervasive and constant glow.

Previous observations could not reveal enough X-ray sources to account for the “X-ray milky way.” This led to theoretical problems. If the X-ray glow were from hot and diffuse gas, it would ultimately “rise” and escape the confines of the galaxy. Furthermore, all that hot gas would need to have come from millions of past star explosions called supernovae, which would imply that estimates of star formation and star death were way off.

“X-ray telescopes can resolve the emission into discrete sources but can only account for about 30 percent of the emission,” said Dr. Jean Swank, project scientist for the Rossi Explorer at NASA Goddard Space Flight Center in Greenbelt, Maryland, USA. “Many have thought that the lion’s share was truly diffuse, for example, from hot gas between the stars. Now it seems that it can all be accounted for a combination of two types of stars.”

The new study is based on nearly 10 years of data collected by the Rossi Explorer and constitutes the most thorough map of the galaxy in X-ray bandwidths. The science team concluded that the Milky Way galaxy is indeed teeming with X-ray stars, most of them not very bright, and that scientists over the years had underestimated their numbers by perhaps a hundredfold.

Surprisingly, the usual suspects of X-ray emission – black holes and neutron stars – are not implicated here. At higher X-ray energies, the X-ray glow arises almost entirely from sources called cataclysmic variables.

A cataclysmic variable is a binary star system containing a relatively normal star and a white dwarf, which is a stellar ember of a star like our sun that has run out of fuel. On its own, a white dwarf is dim. In a binary, it can pull away matter from its companion star to heat itself in a process called accretion. The accreted gas is very hot, a source of considerable X-rays.

At slightly lower X-ray energies, the glow is a mix of about one-third cataclysmic variables and two-thirds active stellar coronas. Most of the stellar corona activity also takes place in binaries, where a nearby companion effectively stirs up the outer parts of the star. This energizes the stellar analogue to produce solar flares, which emits X-rays. The science team says there are upwards of a million cataclysmic variables in our galaxy and close to a billion active stars. Both of these numbers reflect a major undercounting in previous estimates.

“Like a medical x-ray, the chart of the galactic X-ray background reveals details of the Milky Way’s structure,” said Revnivtsev. “We can see through the whole galaxy and count X-ray sources. This is very important to astronomers who calculate the lives of stars.”

NASA Goddard Space Flight Center in Greenbelt, Maryland, USA manages the Rossi Explorer, which was launched in December 1995.

Original Source: Max Planck Society

Tiny Crystals in Violent Galaxies

An artist’s illustration showing the greenish tiny crystals sprinkled throughout the core of a pair of colliding galaxies. Image credit: NASA Click to enlarge
NASA’s Spitzer Space Telescope has observed a rare population of colliding galaxies whose entangled hearts are wrapped in tiny crystals resembling crushed glass.

The crystals are essentially sand, or silicate, grains that were formed like glass, probably in the stellar equivalent of furnaces. This is the first time silicate crystals have been detected in a galaxy outside of our own.

“We were surprised to find such delicate, little crystals in the centers of some of the most violent places in the universe,” said Dr. Henrik Spoon of Cornell University, Ithaca, N.Y. He is first author of a paper on the research appearing in the Feb. 20 issue of the Astrophysical Journal. “Crystals like these are easily destroyed, but in this case, they are probably being churned out by massive, dying stars faster than they are disappearing.”

The discovery will ultimately help astronomers better understand the evolution of galaxies, including our Milky Way, which will merge with the nearby Andromeda galaxy billions of years from now.

“It’s as though there’s a huge dust storm taking place at the center of merging galaxies,” said Dr. Lee Armus, a co-author of the paper from NASA’s Spitzer Science Center at the California Institute of Technology in Pasadena. “The silicates get kicked up and wrap the galaxies’ nuclei in giant, dusty glass blankets.”

Silicates, like glass, require heat to transform into crystals. The gem-like particles can be found in the Milky Way in limited quantities around certain types of stars, such as our sun. On Earth, they sparkle in sandy beaches, and at night, they can be seen smashing into our atmosphere with other dust particles as shooting stars. Recently, the crystals were also observed by Spitzer inside comet Tempel 1, which was hit by NASA’s Deep Impact probe (http://www.spitzer.caltech.edu/Media/releases/ssc2005-18/release.shtml).

The crystal-coated galaxies observed by Spitzer are quite different from our Milky Way. These bright and dusty galaxies, called ultraluminous infrared galaxies, or “Ulirgs,” are swimming in silicate crystals. While a small fraction of the Ulirgs cannot be seen clearly enough to characterize, most consist of two spiral-shaped galaxies in the process of merging into one. Their jumbled cores are hectic places, often bursting with massive, newborn stars. Some Ulirgs are dominated by central supermassive black holes.

So, where are all the crystals coming from? Astronomers believe the massive stars at the galaxies’ centers are the main manufacturers. According to Spoon and his team, these stars probably shed the crystals both before and as they blow apart in fiery explosions called supernovae. But the delicate crystals won’t be around for long. The scientists say that particles from supernova blasts will bombard and convert the crystals back to a shapeless form. This whole process is thought to be relatively short-lived.

“Imagine two flour trucks crashing into each other and kicking up a temporary white cloud,” said Spoon. “With Spitzer, we’re seeing a temporary cloud of crystallized silicates created when two galaxies smashed together.”

Spitzer’s infrared spectrograph spotted the silicate crystals in 21 of 77 Ulirgs studied. The 21 galaxies range from 240 million to 5.9 billion light-years away and are scattered across the sky. Spoon said the galaxies were most likely caught at just the right time to see the crystals. The other 56 galaxies might be about to kick up the substance, or the substance could have already settled.

Others authors of this work include Drs. A.G.G.M. Tielens and J. Cami of NASA’s Ames Research Center, Moffett Field, Calif.; Drs. G.C. Sloan and Jim R. Houck of Cornell; B. Sargent of the University of Rochester, N.Y.; Dr. V. Charmandaris of the University of Crete, Greece; and Dr. B.T. Soifer of the Spitzer Science Center.

The Jet Propulsion Laboratory manages the Spitzer Space Telescope mission for NASA’s Science Mission Directorate, Washington. Science operations are conducted at the Spitzer Science Center. JPL is a division of Caltech. Spitzer’s infrared spectrograph was built by Cornell University, Ithaca, N.Y. Its development was led by Dr. Jim Houck.

Original Source: NASA News Release

Gamma-ray Afterglow reveals Pre-Historic Particle Accelerator

The gamma-ray image of the galactic centre region taken by H.E.S.S. Click to enlarge
Astrophysicists using the H.E.S.S. gamma-ray telescopes, in Namibia, have announced the detection of very-high-energy gamma rays from huge gas clouds known to pervade the centre of our Galaxy. These gamma rays are expected to result from the even more energetic cosmic-ray particles, which permeate our entire Galaxy, crashing into the clouds. However, thanks to the extreme sensitivity of the H.E.S.S instrument in this energy range, precise measurements of the intensity and energies of these gamma rays further show that in the central region of our Galaxy these cosmic-ray particles are typically more energetic than those measured falling onto the Earth’s atmosphere. Possible reasons why cosmic rays are enhanced and of higher energies at the heart of our Galaxy include the echo of a supernova which exploded some ten thousand years beforehand, or a burst of particle acceleration from the super massive black hole at the very centre of our Galaxy.

Gamma rays resemble normal light or X-rays, but are much more energetic. Visible light has an energy of about one electronvolt (1 eV), in physicist’s terms. X-rays are thousands to millions of eV. H.E.S.S. detects very-high-energy gamma-ray photons with an energy of a million million eVs, or one teraelectronvolt. These high-energy gamma rays are quite rare; even for relatively strong astrophysical sources, only about one gamma ray per month hits a square metre at the top of the Earth’s atmosphere.

High-energy particles from space continuously bombard the Earth’s atmosphere from all directions. Their energies exceed, by far, those that can be reached using man-made particle accelerators. Cosmic rays were discovered in 1912 by Victor Hess, and while they have been extensively studied for almost a century, their origin – often declared as one of the key themes of astrophysics – is still not completely understood. One important early result of the H.E.S.S. experiment was to reveal a supernova explosion shock-wave [1] as a site of intense particle acceleration

In a recent publication in Nature magazine, the international H.E.S.S. collaboration reported the discovery of gamma-ray emission from a complex of gas clouds near the centre of our own Milky Way Galaxy. These giant clouds of hydrogen gas encompass an amount of gas equivalent to 50 million times the mass of the sun. With the highly sensitive H.E.S.S. gamma-ray telescopes, it is possible for the first time to show that these clouds are glowing in very-high-energy gamma rays.

One key issue in our understanding of cosmic rays is their distribution in space. Do they permeate the entire Galaxy uniformly, or do their density and distribution in energy vary depending on one’s location in the Galaxy (for example, due to the proximity of cosmic particle accelerators)? Direct measurements of cosmic rays can only taken within our solar system, located about 25,000 light years from the centre of the Galaxy. However, a subterfuge allows astrophysicists to investigate cosmic rays elsewhere in the Galaxy; when a cosmic-ray particle collides with an interstellar gas particle, gamma rays are produced.

The central part of our Galaxy is a complex astronomical zoo, containing examples of every type of exotic object known to astronomers, such as the remnants of supernova explosions and a super-massive black hole. It also contains huge quantities of interstellar gas, which tends to clump into clouds. If gamma rays are detected from the direction of such a gas cloud, scientists can infer the density of cosmic rays at the location of the cloud. The intensity and distribution in energy of these gamma rays reflects that of the cosmic rays.

At low energies, around 100 million electronvolts (man-made accelerators reach energies up to 1,000,000 million electronvolts), this technique has been used by the EGRET satellite to map cosmic rays in our Galaxy. At really high energies – the true domain of cosmic-ray accelerators – no instrument has been so far sensitive enough to “see” interstellar gas clouds shining in very-high-energy gamma rays. H.E.S.S. has for the first time demonstrated the presence of cosmic rays in this central region of our Galaxy.

The H.E.S.S. data show that the density of cosmic rays exceeds that in the solar neighbourhood by a significant factor. Interestingly, this difference increases as we go up in energy, which implies that the cosmic rays have been recently accelerated. So, these data hint that the clouds are illuminated by a nearby cosmic-ray accelerator, which was active over the last ten thousand years. Candidates for such accelerators are a gigantic stellar explosion which apparently went off near the heart of our Galaxy in “recent” history; another possible acceleration site is the super-massive black hole at the centre of the Galaxy. Jim Hinton, one of the scientists involved in the discovery, concludes “This is only the first step. We are of course continuing to point our telescopes at the centre of the Galaxy, and will work hard to pinpoint the exact acceleration site – I’m sure that there are further exciting discoveries to come.”

The High Energy Stereoscopic System (H.E.S.S.) team consists of scientists from Germany, France, the UK, the Czech Republic, Ireland, Armenia, South Africa and Namibia.

The results were obtained using the High Energy Stereoscopic System (H.E.S.S.) telescopes in Namibia, in south-western Africa. This system of four 13 m diameter telescopes is currently the most sensitive detector of very-high-energy gamma rays. These are absorbed in the atmosphere, where they give a short-lived shower of particles. The H.E.S.S. telescopes detect the faint, short flashes of bluish light which these particles emit (named Cherenkov light, lasting a few billionths of a second), collecting the light with large mirrors which reflect onto extremely sensitive cameras. Each image gives the position in the sky of a single gamma-ray photon, and the amount of light collected gives the energy of the initial gamma ray. Building up the images photon-by-photon allows H.E.S.S. to create maps of astronomical objects as they appear in gamma rays.

The H.E.S.S. telescope array represents a multi-year construction effort by an international team of more than 100 scientists and engineers. The instrument was inaugurated in September 2004 by the Namibian Prime Minister, Theo-Ben Guirab, and its first data have already resulted in a number of important discoveries, including the first astronomical image of a supernova shock wave at the highest gamma-ray energies.

Original Source: Max Planck Society

Invisible Metal-Rich Cloud Revealed

Detecting metals in invisible galaxies. Image credit: ESO Click to enlarge
Astronomers, using the unique capabilities offered by the high-resolution spectrograph UVES on ESO’s Very Large Telescope, have found a metal-rich hydrogen cloud in the distant universe. The result may help to solve the missing metal problem and provides insight on how galaxies form.

“Our discovery shows that significant quantities of metals are to be found in very remote galaxies that are too faint to be directly seen”, said C??bf?line P??bf?roux (ESO), lead-author of the paper presenting the results.

The astronomers studied the light emitted by a quasar located 9 billion light-years away that is partially absorbed by an otherwise invisible galaxy sitting 6.3 billion light-years away along the line of sight.

The analysis of the spectrum shows that this galaxy has four times more metals than the Sun. This is the first time one finds such a large amount of ‘metals’ in a very distant object. The observations also indicate that the galaxy must be very dusty.

Almost all of the elements present in the Universe were formed in stars, which themselves are members of galaxies. By estimating how many stars formed over the history of the Universe, it is possible to estimate how much metals should have been produced. This apparently straightforward reasoning has however since several years been confronted with an apparent contradiction: adding up the amount of metals observable today in distant astronomical objects falls short of the predicted value. When the contribution of galaxies now observed at cosmological distances is added to that of the intergalactic medium, the total amounts for no more than a tenth of the metals expected.

Studying distant galaxies is however a difficult task. The further a galaxy, the fainter it is, and the small or intrinsically faint ones won’t be observed. This may introduce severe biases in the observations as only the largest and most active galaxies are picked up.

Astronomers therefore came up with other ways to study distant galaxies: they use quasars, most probably the brightest distant objects known, as beacons in the Universe.

Interstellar clouds of gas in galaxies, located between the quasars and us on the same line of sight, absorb parts of the light emitted by the quasars. The resulting spectrum consequently presents dark ‘valleys’ that can be attributed to well-known elements. Thus, astronomers can measure the amount of metals present in these galaxies – that are in effect invisible – at various epochs.

“This can best be done by high-resolution spectrographs on the largest telescopes, such as the Ultra-violet and Visible Echelle Spectrograph (UVES) on ESO’s Kueyen 8.2-m telescope at the Paranal Observatory,” declared P??bf?roux.

Her team studied in detail the spectrum of the quasar SDSS J1323-0021 that shows clear indications of absorption by a cloud of hydrogen and metals located between the quasar and us. From a careful analysis of the spectrum, the astronomers found this ‘system’ to be four times richer in zinc than the Sun. Other metals such as iron appear to have condensed into dust grains.

“If a large number of such ‘invisible’ galaxies with high metal content were to be discovered, they might well alleviate considerably the missing metals problem”, said Peroux.

Original Source: ESO News Release

How Supernova Shockwaves Change a Nebula’s Shape

Supernova remnants of Puppis A. Image credit: Chandra. Click to enlarge
The Chandra three-color image (inset) of a region of the supernova remnant Puppis A (wide-angle view from ROSAT in blue) reveals a cloud being torn apart by a shock wave produced in a supernova explosion. This is the first X-ray identification of such a process in an advanced phase. In the inset, the blue vertical bar and the blue fuzzy ball or cap to the right show how the cloud has been spread out into an oval-shaped structure that is almost empty in the center. The Chandra data also provides information on the temperature in and around the cloud, with blue representing higher temperature gas.

The oval structure strongly resembles those seen on much smaller size scales in experimental simulations of the interaction of supernova shock waves with dense interstellar clouds. In these experiments, a strong shock wave sweeps over a vaporized copper ball that has a diameter roughly equal to a human hair. The cloud is compressed, and then expands in about 40 nanoseconds to form an oval bar and cap structure much like that seen in Puppis A.

On a cosmic scale, the disruption of l0-light-year-diameter cloud in Puppis A took a few thousand years. Despite the vast difference in scale, the experimental structures and those observed by Chandra are remarkably similar. The similarity gives astrophysicists insight into the interaction of supernova shock waves with interstellar clouds.

Understanding this process is important for answering key questions such as the role supernovas play in heating interstellar gas and triggering the collapse of large interstellar clouds to form new generations of stars.

Original Source: Chandra X-ray Observatory