James Webb Space Telescope Celebrated in Stunning New Video

Behold, the mighty primary mirror of the James Webb Space Telescope, in all its gleaming glory! Image: NASA/Chris Gunn
The primary mirror of the James Webb Space Telescope, in all its gleaming glory! Image: NASA/Chris Gunn

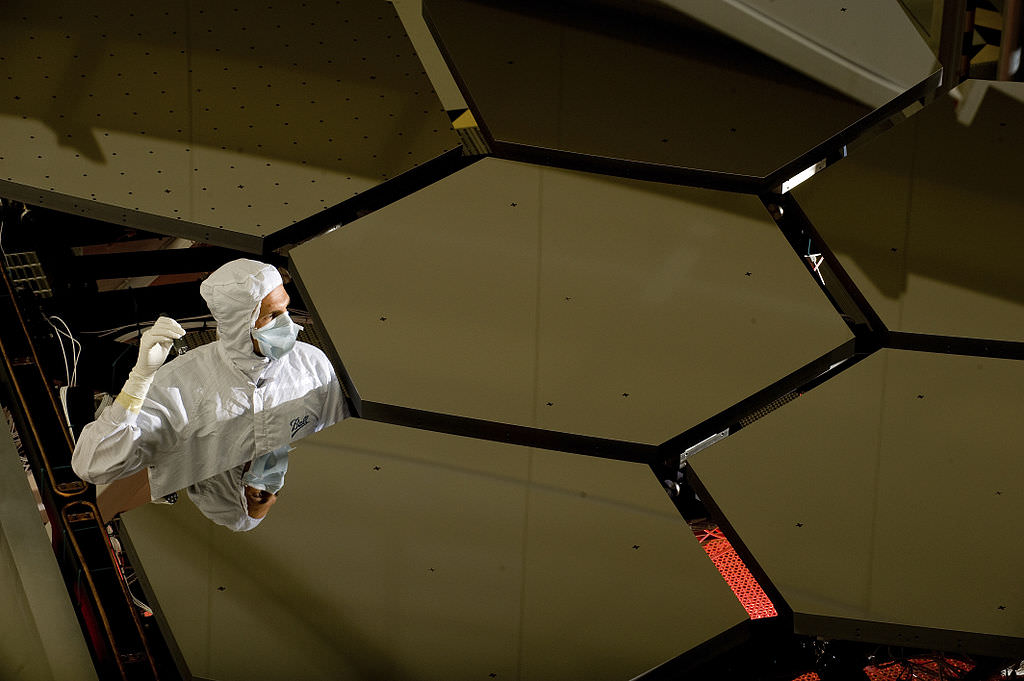
NASA has some high hopes for the James Webb Space Telescope, which finished the “cold” phase of its construction at the end of November 2016. The result of 20 years of engineering and construction, this telescope is seen as Hubble’s natural successor. Once it is deployed in October of 2018, it will use a 6.5 meter (21 ft 4 in) primary mirror to examine the Universe in the visible, near-infrared, and mid-infrared wavelengths.

All told, the JWST will be 100 times more powerful than its predecessor and will be capable of looking over 13 billion years in time. To honor the completion of the telescope, Northrop Grumman – the company contracted by NASA to build it – and Crazy Boat Pictures teamed up to produce a short film about it. Titled “Into the Unknown – the Story of NASA’s James Webb Space Telescope“, the video chronicles the project from inception to completion.

The film (which you can watch at the bottom of the page) shows the construction of the telescope’s large mirrors, its instrument package, and its framework. It also features conversations with the scientists and engineers who were involved and some stunning visuals. In addition to detailing the creation process, the film also delves into the telescope’s mission and all the cosmological questions it will address.

In addressing the nature of James Webb’s mission, the film also pays homage to the Hubble Space Telescope and its many accomplishments. Over the course of its 26 years of operation, it has revealed auroras and supernovas and discovered billions of stars, galaxies, and exoplanets, some of which were shown to orbit within their star’s respective habitable zones.

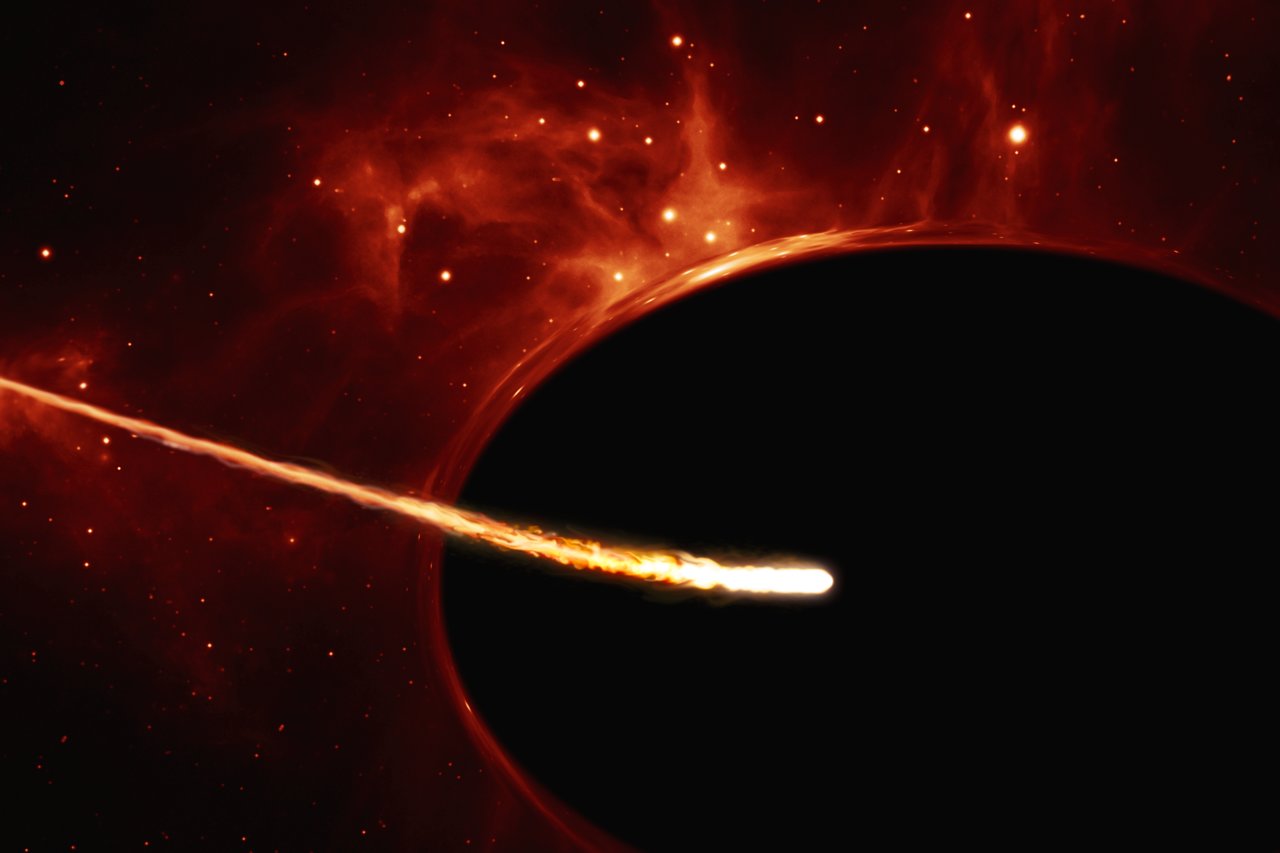
On top of that, Hubble was used to determine the age of the Universe (13.8 billion years) and confirmed the existence of the supermassive black hole (SMBH) – Sagittarius A* – at the center of our galaxy, not to mention many others. It was also responsible for measuring the rate at which the Universe is expanding – in other words, measuring the Hubble Constant.

This played a pivotal role in helping scientists to develop the theory of Dark Energy, one of the most profound discoveries since Edwin Hubble (the telescope’s namesake) proposed that the Universe is in a state of expansion back in 1929. So it goes without saying that the deployment of the Hubble Space Telescope led to some of the greatest discoveries in modern astronomy.

That being said, Hubble is still subject to limitations, which astronomers are now hoping to push past. For one, its instruments are not able to pick up the most distant (and hence, dimmest) galaxies in the Universe, which date to just a few hundred million years after the Big Bang. Even with “The Deep Fields” initiative, Hubble is still limited to seeing back to about half a billion years after the Big Bang.

Illustration of the depth by which Hubble imaged galaxies in prior Deep Field initiatives, in units of the Age of the Universe. The goal of the Frontier Fields is to peer back further than the Hubble Ultra Deep Field and get a wealth of images of galaxies as they existed in the first several hundred million years after the Big Bang. Note that the unit of time is not linear in this illustration. Illustration Credit: NASA and A. Feild (STScI)
Illustration of the depth by which Hubble imaged galaxies in prior Deep Field initiatives in units of the Age of the Universe. Credit: NASA and A. Feild (STScI)

As Dr. John Mather, the project scientist for the James Webb Telescope, told Universe Today via email:

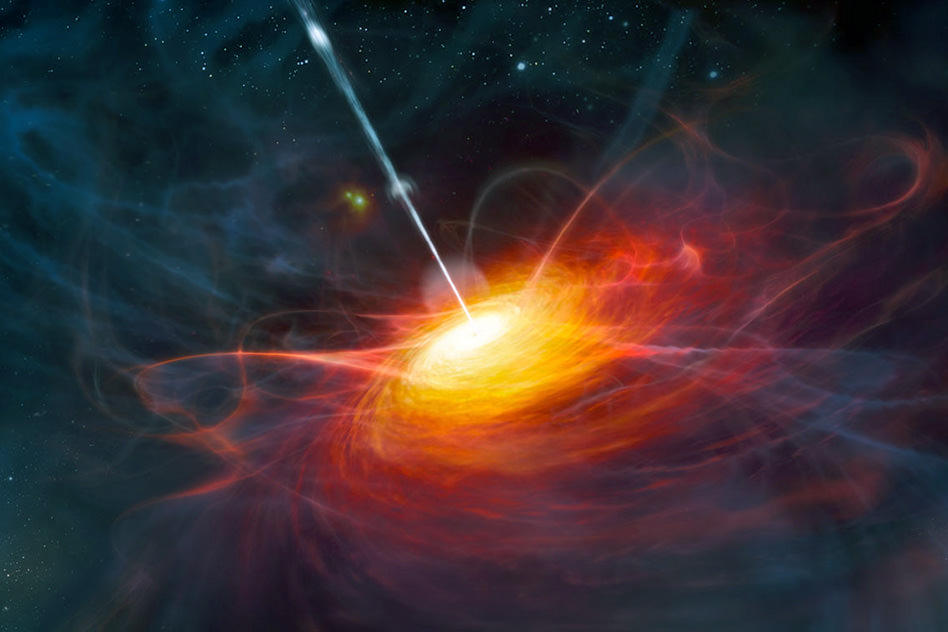
“Hubble showed us that we could not see the first galaxies being born, because they’re too far away, too faint, and too red. JWST is bigger, colder, and observes infrared light to see those first galaxies.  Hubble showed us there’s a black hole in the center of almost every galaxy. JWST will look as far back in time as possible to see when and how that happened: did the galaxy form the black hole, or did the galaxy grow around a pre-existing black hole?  Hubble showed us great clouds of glowing gas and dust where stars are being born. JWST will look through the dust clouds to see the stars themselves as they form in the cloud. Hubble showed us that we can see some planets around other stars, and that we can get chemical information about other planets that happen to pass directly in front of their stars.  JWST will extend this to longer wavelengths with a bigger telescope, with a possibility of detecting water on a super-Earth exoplanet. Hubble showed us details of planets and asteroids close to home, and JWST will give a closer look, though it’s still better to send a visiting robot if we can.”
Basically, the JWST will be able to see farther back to about 100 million years after the Big Bang, when the first stars and galaxies were born. It is also designed to operate at the L2 Lagrange Point, farther away from the Earth than Hubble – which was designed to remain in low-Earth orbit. This means the JWST will be subject to less thermal and optical interference from the Earth and the Moon, but will also make it more difficult to service.

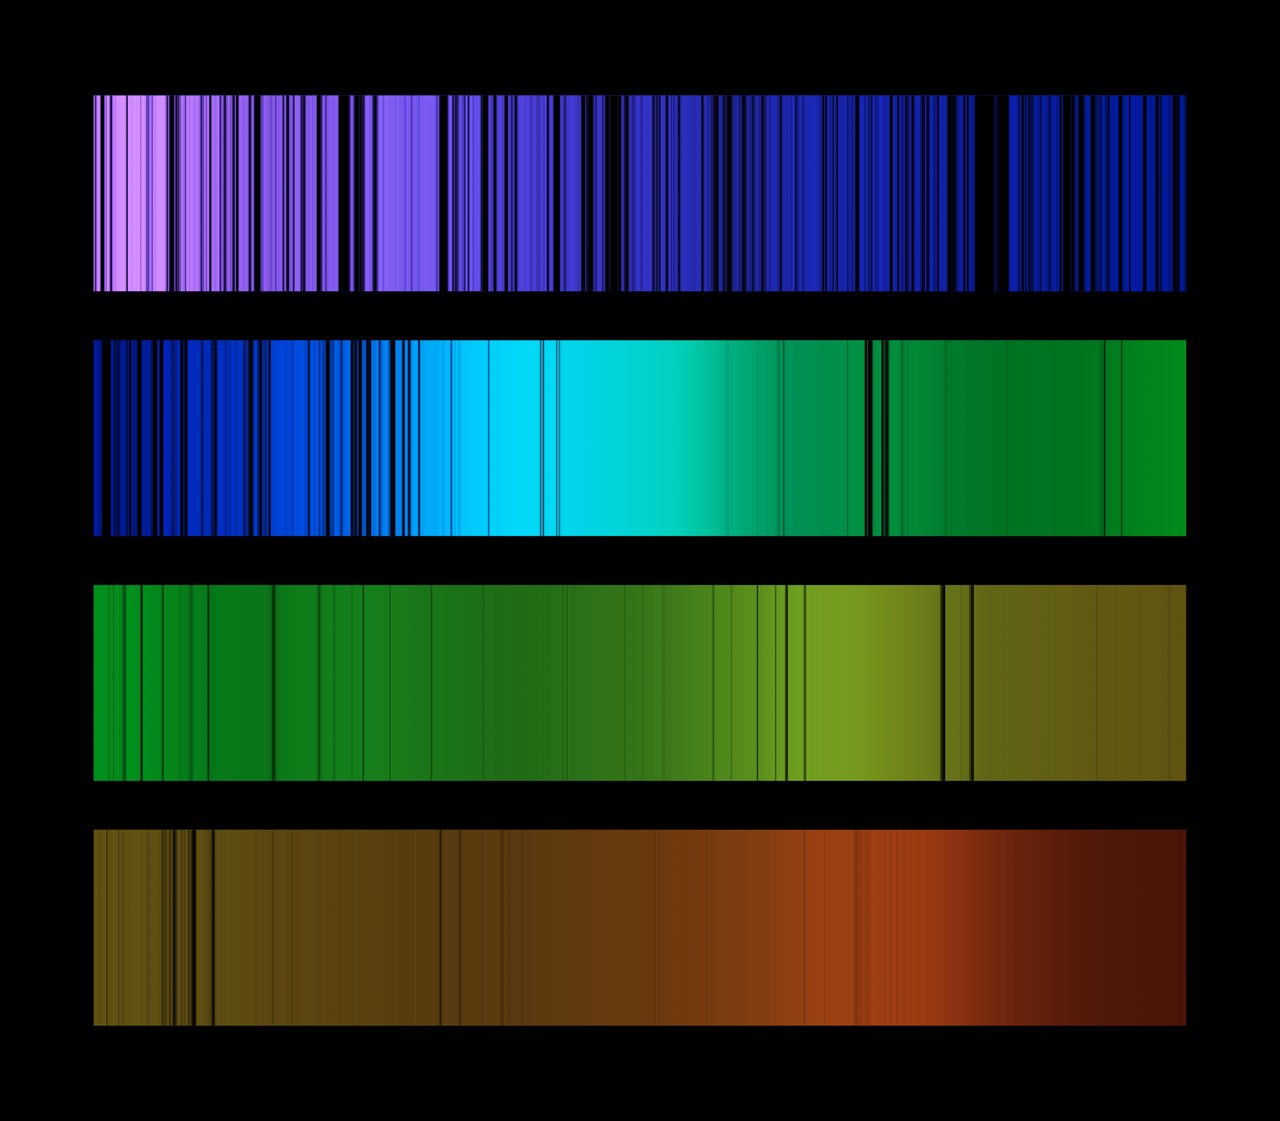
With its much larger set of segmented mirrors, it will observe the Universe as it captures light from the first galaxies and stars. Its extremely-sensitive suite of optics will also be able to gather information in the long-wavelength (orange-red) and infrared wavelengths with greater accuracy, measuring the redshift of distant galaxies and even helping in the hunt for extra-solar planets.

A primary mirror segments of the James Webb Space Telescope, made of beryllium. Credit: NASA/MSFC/David Higginbotham/Emmett Given

With the assembly of its major components now complete, the telescope will spend the next two years undergoing tests before its scheduled launch date in October 2018. These will include stress tests that will subject the telescope to the types of intense vibrations, sounds, and g forces (ten times Earth’s gravity) it will experience inside the Ariane 5 rocket that will take it into space.

Six months before its deployment, NASA also plans to send the JWST to the Johnson Space Center, where it will be subjected to the kinds of conditions it will experience in space. This will consist of scientists placing the telescope in a chamber where temperatures will be lowered to 53 K (-220 °C; -370 °F), which will simulate its operating conditions at the L2 Lagrange Point.

Once all of that is complete, and the JWST checks out, it will be launched aboard an Ariane 5 rocket from Arianespace’s ELA-3 launch pad in French Guayana. And thanks to experience gained from Hubble and updated algorithms, the telescope will be focused and gathering information shortly after it is launched. And as Dr. Mather explained, the big cosmological questions it is expected to address are numerous:

“Where did we come from? The Big Bang gave us hydrogen and helium spread out almost uniformly across the universe. But something, presumably gravity, stopped the expansion of the material and turned it into galaxies and stars and black holes. JWST will look at all these processes: how did the first luminous objects form, and what were they? How and where did the black holes form, and what did they do to the growing galaxies? How did the galaxies cluster together, and how did galaxies like the Milky Way grow and develop their beautiful spiral structure? Where is the cosmic dark matter and how does it affect ordinary matter? How much dark energy is there, and how does it change with time?”

Needless to say, NASA and the astronomical community are quite excited that the James Webb Telescope is finished construction, and can’t wait until it is deployed and begins to send back data. One can only imagine the kinds of things it will see deep in the cosmic field. But in the meantime, be sure to check out the film and see how this effort all came together:

Further Reading: NASA – JWST, Northrop Grumman

Martian Mineral Points Toward Past Habitability

Curiosity picture showing color variations on Mount Sharp, Mars. Credit: NASA/JPL

For over a year, the Curiosity rover has been making its way up the slopes of Mount Sharp, the central peak within the Gale Crater. As the rover moves higher along this formation, it has been taking drill samples so that it might look into Mars’ ancient past. Combined with existing evidence that water existed within the crater, this would have provided favorable conditions for microbial life.

And according to the most recent findings announced by the Curiosity science team, the upper levels of the mountain are rich in minerals that are not found at the lower levels. These findings reveal much about how the Martian environment has changed over the past few billion years, and are further evidence that Mars may have once been habitable.

The findings were presented at the Fall meeting of the American Geophysical Union (AGU), which began on Monday, Dec. 12th, in San Fransisco. During the meeting, John Grotzinger – the Fletcher Jones Professor of Geology at Caltech and the former Project Scientist for the Curiosity mission – and other members of Curiosity’s science team shared what the rover discovered while digging into mineral veins located in the higher, younger layers of Mount Sharp.

This pair of drawings depicts the same location at Gale Crater on at two points in time: now and billions of years ago. Water moving beneath the ground, as well as water above the surface in ancient rivers and lakes, provided favorable conditions for microbial life, if Mars has ever hosted life. Credit: NASA/JPL-Caltech
Artist’s illustration showing the Gale Crater as it appears today, with the Curiosity rover climbing Mount Sharp. Credit: NASA/JPL-Caltech

To put it simply, mineral veins are a great way to study the movements of water in an area. This is due to the fact that veins are the result of cracks in layered rock being filled with chemicals that are dissolved in water – a process which alters the chemistry and composition of rock formations. What the rover found was that at higher layers hematite, clay minerals and boron are more abundant than what has been observed at lower, older layers.

These latest findings paint a complex picture of the region, where groundwater interactions led to clay-bearing sediments and diverse minerals being deposited over time. As Grotzinger explained, this kind of situation is favorable as far as habitability is concerned:

“There is so much variability in the composition at different elevations, we’ve hit a jackpot. A sedimentary basin such as this is a chemical reactor. Elements get rearranged. New minerals form and old ones dissolve. Electrons get redistributed. On Earth, these reactions support life.”

At present, no evidence has been found that microbial life actually existed on Mars in the past. However, since it first landed back in 2012, the Curiosity mission has uncovered ample evidence that conditions favorable to life existed billions of years ago. This is possible thanks to the fact that Mount Sharp consists of layered sedimentary deposits, where each one is younger than the one beneath it.

The Gale Crater, billions of years ago, showing how the circulation of groundwater led to chemical changes and deposits. Credit: NASA/JPL-Caltech

These sedimentary layers act as a sort of geological and environmental record for Mars; and by digging into them, scientists are able to get an idea of what Mars’ early history looked like. In the past, Curiosity spent many years digging around in the lower layers, where it found evidence of liquid water and all the key chemical ingredients and energy needed for life.

Since that time, Curiosity has climbed higher along Mount Sharp and examined younger layers, the purpose of which has been to reconstruct how the Martian environment changed over time. As noted, the samples Curiosity recently obtained showed greater amounts of hematite, clay minerals and boron. All of these provide very interesting clues as to what kinds of changes took place.

For instance, compared to previous samples, hematite was the most dominant iron oxide mineral detected, compared to magnetite (which is a less-oxidized form of iron oxide). The presence of hematite, which increases with distance up the slope of Mount Sharp, suggests both warmer conditions and more interaction with the atmosphere at higher levels.

The increasing concentration of this minerals – relative to magnetite at lower levels – also indicates that environmental changes have occurred where the oxidation of iron increased over time. This process, in which more electrons are lost via chemical exchanges, can provide the energy necessary for life.

Credit: NASA/JPL
Hi-resolution pictures showing the Curiosity rover’s various drilling sites, up until Nov. 2016. Credit: NASA/JPL

In addition, Curiosity’s Chemistry and Camera (ChemCam) instrument has also noted increased (but still minute)) levels of borons within veins composed primarily of calcium sufate. On Earth, boron is associated with arid sites where water has evaporated, and its presence on Mars was certainly unexpected. No previous missions have ever detected it, and the environmental implications of it being present in such tiny amounts are unclear.

On the one hand, it is possible that evaporation within the lake bed created a boron-deposit deeper inside Mount Sharp. The movement of groundwater within could have then dissolved some of this, redepositing trace amounts at shallower levels where Curiosity was able to reach it. On the other hand, it could be that changes in the chemistry of clay-bearing deposits affected how boron was absorbed by groundwater and then redeposited.

Either way, the differences in terms of the composition of upper and lower levels in the Gale Crater creates a very interesting picture of how the local environment changed over time:

“Variations in these minerals and elements indicate a dynamic system. They interact with groundwater as well as surface water. The water influences the chemistry of the clays, but the composition of the water also changes. We are seeing chemical complexity indicating a long, interactive history with the water. The more complicated the chemistry is, the better it is for habitability. The boron, hematite and clay minerals underline the mobility of elements and electrons, and that is good for life.”

It seems that with every discovery, the long history of “Earth’s Twin” is becoming more accessible, yet more mysterious. The more we learn about it past and how it came to be the cold, desiccated place we know today, the more we want to know!

Further Reading: NASA

Hubble Watches Spinning Black Hole Swallow a Star

Close-up of star near a supermassive black hole (artist’s impression). Credit: ESA/Hubble, ESO, M. Kornmesser

In 2015, the All-Sky Automated Survey for Supernovae (aka. ASAS-SN, or Assassin) detected something rather brilliant in a distant galaxy. At the time, it was thought that the event (named ASASSN-15lh) was a superluminous supernova – an extremely bright explosion caused by a massive star reaching the end of its lifepsan. This event was thought to be brightest supernova ever witnessed, being twice as bright as the previous record-holder.

But new observations provided by an international team of astronomers have provided an alternative explanation that is even more exciting. Relying on data from several observatories – including the NASA/ESA Hubble Space Telescope – they have proposed that the source was a star being ripped apart by a rapidly spinning black hole, an event which is even more rare than a superluminous supernova.

According to the ASAS-SN’s findings – which were published in January of 2016 in Science – the superluminous light source appeared in a galaxy roughly 4 billion light-years from Earth. The luminous source was twice as bright as the brightest superluminous supernova observed to date, and its peak luminosity was 20 times brighter than the total light output of the entire Milky Way.

Credit: ESA/Hubble, ESO, M. Kornmesser
This artist’s impression depicts a rapidly spinning supermassive black hole surrounded by an accretion disc. Credit: ESA/Hubble, ESO, M. Kornmesse

What seemed odd about it was the fact that the superluminous event appeared within a massive, red (i.e. “quiescent”) galaxy, where star formation has largely ceased. This was in contrast to most super-luminous supernovae that have been observed in the past, which are typically located in blue, star-forming dwarf galaxies. In addition, the star (which is Sun-like in size) is not nearly massive enough to become an extreme supernova.

As such, the international team of astronomers – led by Giorgos Leloudas of the Weizmann Institute of Science in Israel and the Dark Cosmology Center in Denmark – conducted follow-up observations using space-based and Earth-based observatories. These included the Hubble Space Telescope, the Very Large Telescope (VLT) at the ESO’s Paranal Observatory and the New Technology Telescope (NTT) at the La Silla Observatory.

With information from these facilities, they arrived at a much different conclusion. As Dr. Leloudas explained in a Hubble press release:

“We observed the source for 10 months following the event and have concluded that the explanation is unlikely to lie with an extraordinary bright supernova. Our results indicate that the event was probably caused by a rapidly spinning supermassive black hole as it destroyed a low-mass star.”

The process is colloquially known as “spaghettification”, where an object is ripped apart by the extreme tidal forces of a black hole. In this case, the team postulated that the star drifted too close to the supermassive black hole (SMBH) at the center of the distant galaxy. The resulting heat and the shocks created by colliding debris led to a massive burst of light – which was mistakenly believed to be a very bright supernova.

Multiple lines of evidence support this theory. As they explain in their paper, this included the fact that over the ten-months that they observed it, the star went through three distinct spectroscopic phases. This included a period of substanial re-brightening, where the star emitted a burst of UV light that accorded with a sudden increase in its temperature.

Combined with the unlikely location and the mass of the star, this all pointed towards tidal disruption rather than a massive supernova event. But as Dr. Leloudas admits, they cannot be certain of this just yet. “Even with all the collected data we cannot say with 100% certainty that the ASASSN-15lh event was a tidal disruption event.” he said. “But it is by far the most likely explanation.”

As always, additional observations are necessary before anyone can say for sure what caused this record-breaking luminous event. But in the meantime, the mere fact that something so rare was witnessed should be enough to cause some serious excitement! Speaking of which, be sure to check out the simulation videos (above and below) to see what such an event would look like:

Further Reading: Hubble Space Telescope

What is an Orrery?

Mechanical orrery by Gilkerson, in Armagh Observatory. Credit: star.arm.ac.uk

For thousands of years, humans have been studying the heavens, seeking to find patterns and predictability in their movements. This tradition goes all the way back to prehistory, where hunter-gatherer societies assigned characteristics to asterisms and celestial bodies. And from the 2nd millennium onward, magi and astronomers began recording the movements of the constellations and the planets through the zodiac.

By classical antiquity, attempts began to create astrolabes and other devices that would allow astronomers to know where the stars and planets were at any given time. These would eventually culminate in the creation of the orrery, a mechanical device that attempts to recreate the Solar System and the movements of its planets and moons around our Sun.

Definition:

Traditionally, an orrery is a mechanical model of the Solar System, or at least the major planets. This device is driven by a clockwork mechanism that simulates the motion of the planets (and, in some cases, major moons) around the Sun. This last feature is key, since most known orreries were produced during the early modern period and after, when the Heliocentric model of the Solar System came to be the accepted one.

Orreries are typically driven by a clockwork mechanism with a globe representing the Sun at the center, and with a planet at the end of each of the arms. They are usually not to scale, partly because of the difficulty of mechanically modeling the distances involved, the eccentricity of various planets’ orbits, and the planets’ massive differences in terms of size.

Though many working planetaria were created during Classical Antiquity, the first orrery of the modern era was produced in 1704 by clock makers George Graham and Thomas Tompion. The name is derived from Charles Boyle, the 4th Earl of Orrery, England, who commissioned famed instrument maker John Rowley to build one in 1713 based on the design of Graham and Tompion.

Early Examples:

The Antikythera mechanism, which is dated to ca. 150 – 100 BCE, may be considered the first orrery that is still in existence. Discovered in the wreck of a ship in 1900 off the Greek island of Antikythera (hence the name), this device consisted of hand-driven mechanisms that represented the diurnal motions of the Sun, the Moon, and the then-known five known planets (Mercury, Venus, Earth, Mars, Jupiter).

The Antikythera Mechanism may be the world's oldest computer. Image: By Marsyas CC BY 2.5
The Antikythera Mechanism may be the world’s oldest computer. Credit: Wikipedia Commons/Marsyas

Reflecting the cosmological view of the Greeks, the device was geocentric in nature and was used as a mechanical calculator designed to determine astronomical positions. According to Roman philosopher Cicero (106 – 43 BCE), the Syrian-born Greek philosopher Posidonius of Rhodes (ca. 135 – 51 BCE ) built a planetary model as well. With the fall of the Roman Empire, the art would not be resurrected until the late Medieval Period.

In 1348, Italian doctor and clock maker Giovanni Dondi built the first known clock-driven mechanism which displayed the position of Moon, Sun, Mercury, Venus, Mars, Jupiter and Saturn along the ecliptic – according to the Ptolemaic (geocentric) model of the Solar system. At present, only a written account survives, but it is extremely detailed in its description of the mechanisms involved.

During the 16th century, two astronomical clocks were built for the court of William IV, Langrave of Hesse-Kassel (in modern day Bavaria, Germany). These showed the motions of the Sun, Moon, Mercury, Venus, Mars, Jupiter and Saturn based on the Ptolemaic system.  These clocks are now on display at the Museum of Physics and Astronomy and the Royal Cabinet of Mathematical and Physical Instruments (in Kassel and Dresden, respectively).

Modern Examples:

Thanks to Copernicus’s proposal of the Heliocentric model of the Universe, Isaac Newton’s Law of Universal Gravitation, and other discoveries that took place during the Scientific Revolution, orreries changed significantly by the early modern period. In essence, the Heliocentric model simplified the apparent orbits of the planets around the Sun, to the point that they could be represented as simple circles or ellipses.

A Philosopher Lecturing on the Orrery (ca. 1766) by Joseph Wright of Derby. Credit: Public Domain

As noted, the first modern orrery was created in 1704 in England by clock makers George Graham and Thomas Tompion. This design was given to instrument maker Jon Rowely, who then produced a copy for the Prince Eugene of Savoy and was commissioned by his patron – Charles Boyle – to build them for himself and his son John – who would go on to become the 5th Earl of Orrery (and the 5th Earl of Cork).

Between 1665 and 1681, while in Paris, Christiaan Huygens created a heliocentric planetary machine that represented a year and the cycles of the then-known planets. He would go on to publish papers describing its functions by 1703. The painting “A Philosopher giving a Lecture on the Orrery in which a lamp is put in place of the Sun”, which Jospeh Wright completed in 1766, features a brass orrery as its centerpiece.

Between 1774 and 1781, Eisinga’s Planetarium was built in Franeker, in the Netherlands by amateur Frisian astronomer Eise Eisinga. Central to the planetarium is an orrery which shows the orbits of the planets across the width of the room’s ceiling. The clockwork machine that powers it has been in almost continuous operation since it first opened.

In 1764, Benjamin Martin invented a new type of orrery that relied on three parts – the planetarium where the planets revolved around the Sun; the tellurion, which showed the inclined axis of the Earth and how it revolved around the Sun; and the lunarium which showed the eccentric rotations of the Moon around the Earth. This allowed for a more accurate representations of the Solar System, which included the planet’s inclinations, relative to the Sun.

Orreries Today:

Today, with immense amounts of low-cost computing power available, software has been developed to calculate the relative positions and motions of Solar System bodies. Examples of these “digital orreries” include a java applet used at the Department of Physics at the University of Texas at Austin, and Orrery, a Solar System Visualizer from The Geometry Center at the University of Minnesota (which relies on Unix).

There is also the Digital Orrery, a special-purpose computer designed to model the long term motions of the outer planets of the Solar System. Constructed in 1985, it was built to answer a long-standing question about the Solar System, which is whether or not it is stable (invariably, the answer was a big no). This device is now at the Smithsonian Institution in Washington, DC.

And in 2013, the first virtual orrery was created by the Cattle Point Foundation at the DARK SKY Urban Star Park, located in Oak Bay, British Columbia. The orrery is called “The Salish Sea Walk of the Planets“, and was built with Google Maps to avoid negatively impacting the park and the nearby Orca and wildlife sanctuaries. This orrery has now extended beyond the Star Park to become the world largest, covering a distance of over 8,500 km (5,300 mi).

Credit: attlepointstarpark.org
The Sun and Cairn, part of “The Salish Sea Walk of the Planets” in Oak Bay, BC. Credit: attlepointstarpark.org

The Sun is located in the Star Park in Oak Bay (shown above) while Pluto (the most distant “planet”) is located in Bamfield on the western side of Vancouver Island, BC. The Kuiper Belt Objects are situated north in the small towns of Ucluelet and Tofino while the farthest object within our Solar System – the Oort Cloud – is across the sea at the Canadian Embassy in Beijing, China.

Meanwhile, physical orreries still exist in many locations. For example, there’s The York Solar System Model Orrery, a special bike path constructed in 1999 and maintained by York University in the UK. Spread out along 10.3 km (6.4 miles) of the old East Coast main-line railway, this scale model of the Solar System contains all the planets of the Solar System, as well as models of the Cassini and Voyager spacecraft.

There is also the “Path of the Planets Uetliberg–Felsenegg“, which follows a hiking trail along the Albis (a chain of hills in Switzerland). The path was designed by Arnold von Rotz to be a 1:1 billion scale model of the Solar System (where 1 meter equals 1 billion km). The path runs from the towns of Uetliberg to Felsenegg (which is about 2 hours away on foot) and opened on April 26th, 1979.

Each planet is represented by a large orb that is mounted to a boulder or affixed inside one (depending on their size) and has a sign that includes the body’s place in the Solar System and their basic info (like equatorial diameter, rotational speed, etc.)

. Credit: uetliberg.ch
The bronze orb representing the Sun along the “Passauer Footpath of the Planets”, in Lower  Bavaria, Germany. Credit: uetliberg.ch

There’s also The Human Orrery, which is located at Armagh Observatory, in Northern Ireland. This orrery allows people to play the part of the planets of Mercury, Venus, Earth, Mars, Jupiter, and Saturn, as well as Ceres and two comets (1P/Halley and 2P/Encke). Due to their immense distance, and the fact the orrery is to scale, Uranus and Neptune are not included.

From our humble beginnings as hunter-gatherers who looked up at the stars and discerned patterns in their appearance, humanity has come a long way in terms of its understanding of the Universe. As we invented devices to look deeper into the night sky, and even explore space directly, our models have matured accordingly, growing in terms of accuracy and complexity.

That tradition continues, with more mission to study and explore the outer Solar System proceeding apace. Future orreries are likely to take advantage of all this, leveraging new technologies and new information to create even more detailed and interesting representations of our cosmic background!

We have written many interesting articles about the planets here at Universe Today. Here’s The Solar System Guide, What is the Geocentric Model of the Universe?, What is the Heliocentric Model of the Universe?, What is the Difference Between the Geocentric and Heliocentric model of the Solar System?, and How Many Planets are in the Solar System?

Source:

Showcasing the Benefits of NASA Technology Here on Earth

Every year, NASA showcases how the technology it develops for exploring space and studying other worlds has applications here on planet Earth. It’s what known as Spinoff, an annual publication that NASA’s Technology Transfer Program has been putting out since 1976. Since that time, they have showcased over 2000 examples where NASA technology was used for the sake of creating products that had wide-ranging benefits.

For Spinoff 2017, NASA selected 50 different companies that are using NASA technology – which included innovations developed by NASA, those made with the help of NASA funding, or those produced under contract with the agency. With examples ranging from GPS and satellite imaging, to light detection and ranging (Lidar) and biomedical devices, the list of commercial applications for this year is quite impressive!

For over 50 years, the NASA Technology Transfer Program has share NASA resources with private industries, a process which is colloquially referred to as “spin-offs”. In finding the widest possible applications for NASA technology and leveraging partnerships and licensing agreements with industry, they ensure that the large investments made in space exploration find additional uses that benefit humanity here on Earth.

Spinoff is an annual publication exploring the many applications NASA technology has. Credit: NASA

In the past, spin-offs have included memory foam, freeze-dried food, emergency thermal blankets, Dustbusters, cochlear implants, and numerous other application that have benefited the computer, medical, transportation, manufacturing and safety industries – thought not Velcro or Tang (contrary to popular conception). As Dan Lockney, the executive of NASA’s Technology Transfer program, told Universe Today via email:

“Spinoff is NASA’s annual publication featuring technologies that have left NASA’s launchpads and laboratories and moved into the public sector. We’ve published Spinoff each year since 1976, featuring about 50 of the best examples of commercialized NASA technologies each year. These range from consumer goods to public safety and medical equipment to advances in round and aire transportation.

These commercialized technologies are often a direct outcome of the work that NASA’s Technology Transfer Program conducts. Our Tech Transfer Program works to get the technolgoes developed for NASA missions out to industry so that they can have second lives as new products and services.”

This year’s spinoffs were certainly numerous, but some are particularly worthy of mention. For instance, there is the metal oxide semiconductor (CMOS) image sensor that was developed by NASA’s Jet Propulsion Laboratory. Since its creation, it has become one of NASA’s most ubiquitous technologies, leading to the development of DSLR cameras, camera phones, and digital cameras that are available on every handheld device on the market.

And then there’s the GPS technology NASA began developing back in the 1990s, which included software capable of correcting for GPS signal errors and enabling incredible accuracy. John Deere recently acquired this technology and used it to develop a popular class of self-driving farm tractors. Today, as much as 70% of North American farmland is cultivated by self-driving tractors that rely on this technology.

Aerial photograph of a forest in Connecticut (left), and bare-earth lidar image beneath the overgrown vegetation (right) showing the remnants of stone walls, building foundations, abandoned roads and what was once cleared farm land. Credits: NASA/Katharine Johnson

And then there is the spinoff involving NASA-developed laser imaging and ranging technology (Lidar). This technology allowed the Pheonix Lander to detect snow falling from the skies of Mars, and will be used to OSIRIS-REx mission to land on an asteroid in the coming decade. And recently, this same technology was used by a team of archaeologists to map prehistoric sites in North America where hunter-gatherers hunted bison en masse.

In addition, “Robotics Spinoffs” get a special mention in this year’s report, with homage being paid to missions like Curiosity and Juno (which have explored the surfaces and atmospheres of other planets) and space-based observatories like Spitzer, Chandra and Hubble – which have looked deep into the cosmic field. The technologies used by these missions has also had an impact in virtually every sector of the world’s economy.

The publication also includes a section called “Spinoffs of Tomorrow“, which highlights 20 technologies that are especially well-suited for commercial adaptation. These include thin-film piezoelectric and composite materials that could be used in wind turbines to generate more electricity and improve electrode durability, as well as in personal devices to generate power from mere movement.

There’s also the new Armstrong wing design that lower drags, which could make airplanes and wind turbines more efficient. The Glenn Research Center is also cited for their development of a suite of materials and methods that optimize the performance of nanomaterials by making them tougher, more resistant, and easier to process. This could be used to build super-resilient fabrics and consumer products.

NASA's Juno spacecraft launched on August 6, 2011 and should arrive at Jupiter on July 4, 2016. Credit: NASA / JPL
NASA’s Juno spacecraft launched on August 6, 2011 and should arrive at Jupiter on July 4, 2016. Credit: NASA / JPL

Then there’s an underwater vehicle developed by JPL that uses thermally-generated changes in buoyancy to generate electricity and recharge its batteries. This technology, which enables submarines to remain underwater for years at a time, could lead to the creation of nearly self-sufficient undersea drones – something that has applications in everything from sea exploration to pipeline monitoring.

The section also makes mention of an easy-to-use device that separates DNA, RNA, and proteins outside a traditional lab environment. Originally intended for use aboard the ISS, this device could be a boon for developing nations where medical infrastructure may be limited.  And there’s also a system that autonomously detects faulty wiring and reroutes around it.

As always, the development of cutting-edge technologies can have applications that go far beyond the purpose for which they were originally intended. Whether it is robotic landers or probes, miniaturized cameras, improved electronics, or advanced materials, commercial industries here on Earth have always benefited from the research, development and exploration efforts of the space industry.

And as our efforts to send astronauts to Mars, return to the Moon, and explore the outer Solar System andbeyond continue, who knows what commercial applications will emerge as a result? And in the meantime, be sure to enjoy this video which explains how NASA technology is licensed through the TTP:

Further Reading: NASA

ESO Survey Shows Dark Matter to be Pretty “Smooth”

The technique of gravitational lensing relies on the presence of a large cluster of matter between the observer and the object to magnify light coming from that object. Credit: NASA

Dark Matter has been something of a mystery ever since it was first proposed. In addition to trying to find some direct evidence of its existence, scientists have also spent the past few decades developing theoretical models to explain how it works. In recent years, the popular conception has been that Dark Matter is “cold”, and distributed in clumps throughout the Universe, an observation supported by the Planck mission data.

However, a new study produced by an international team of researchers paints a different picture. Using data from the Kilo Degree Survey (KiDS), these researchers studied how the light coming from millions of distant galaxies was affected by the gravitational influence of matter on the largest of scales. What they found was that Dark Matter appears to more smoothly distributed throughout space than previously thought.

Continue reading “ESO Survey Shows Dark Matter to be Pretty “Smooth””

Trump Meeting Puts NASA Funding in Question

Earth, seen from space, above the Pacific Ocean. Credit: NASA

Since the election of Donald Trump, NASA has had its share of concerns about the future. Given the President-elect’s position and past statements on climate science, there has been speculation that his presidency will curtail funding to some of their research efforts, particularly those that are maintained by the Earth Science Directorate.

Things took another turn on Monday (Dec. 5th) as Trump met with former Vice President and environmental activist Al Gore to discuss his administration’s policy. This meeting was the latest in a series of gestures that suggest that the President-elect might be softening his stances on the environment. However, there is little reason to suspect that this meeting could mean any changes in policy.

The meeting was apparently arranged by the President-elect’s daughter, Ivanka Trump, to coincide with the former VP’s attendance of a conference in New York on Monday. Said conference was the 24 hour live broadcast titled “24 Hours of Reality”, an event being put on by the Climate Reality Project – a non-profit organization founded by Gore to educate the public on climate change and policy.

Much of NASA's research into Climate Change takes place through the Earth Sciences Directorate. Credit: NASA
Much of NASA’s research into Climate Change takes place through the Earth Sciences Directorate. Credit: NASA

The meeting lasted 90 minutes, after which Gore spoke to reporters about the discussion he and the President-elect had. As he was quoted as saying by The Washington Post:

“I had a lengthy and very productive session with the president-elect. It was a sincere search for areas of common ground. I had a meeting beforehand with Ivanka Trump. The bulk of the time was with the president-elect, Donald Trump. I found it an extremely interesting conversation, and to be continued, and I’m just going to leave it at that.”

While this meeting has led to speculation that Trump’s administration might be softening its stance on environmental issues, many are unconvinced. Based on past statements – which include how Climate Change is a “hoax invented by the Chinese” – to his more recent picks for his cabinet, there are those who continue to express concern for the future of NASA programs that are centered on Earth sciences and the environment.

For instance, after weeks of remaining mute on the subject of NASA’s future, the Trump campaign announced that it had appointed Bob Walker – a former Pennsylvania Congressman and the chair of the House Science Committee from 1995 to 1997. A fierce conservative, Walker was recently quoted as saying that NASA should cease its climate research and focus solely on space exploration.

Carbon dioxide in Earth's atmosphere if half of global-warming emissions are not absorbed. Credit: NASA/JPL/GSFC
Artist’s impression of the carbon dioxide that will be present in Earth’s atmosphere if half of global-warming emissions are not absorbed. Credit: NASA/JPL/GSFC

“My guess is that it would be difficult to stop all ongoing Nasa programs but future programs should definitely be placed with other agencies,” he said in an interview with the Guardian in late November. “I believe that climate research is necessary but it has been heavily politicized, which has undermined a lot of the work that researchers have been doing. Mr Trump’s decisions will be based upon solid science, not politicized science.”

From statements such as these, plus things said during the campaign that emphasized NASA’s important role in space exploration, the general consensus has been that a Trump administration will likely slash funding to NASA’s Earth Science Directorate while leaving long-term exploration programs unaffected. According to David Titley, who recently wrote an op-ed piece for The Conversation, this would be a terrible mistake.

Titley is a Professor of Meteorology at Pennsylvania State University and the founding director of their Center for Solutions to Weather and Climate Risk. In addition to being a Rear Admiral in the US Navy (retired), he was also the Chief Operating Officer of the National Oceanic and Atmospheric Administration from 2012–2013 and has been a Fellow of the American Meteorological Society since 2009.

As he noted in his piece, NASA’s Earth science and Earth observation efforts are vital, and the shared missions they have with organizations like the NOAA have numerous benefits. As he explained:

“There’s a reason why space is called ‘the ultimate high ground’ and our country spends billions of dollars each year on space-based assets to support our national intelligence community. In addition to national security, NASA missions contribute vital information to many other users, including emergency managers and the Federal Emergency Management Agency (FEMA), farmers, fishermen and the aviation industry.”

An artist's conception of an asteroid passing near the Earth. NASA is getting better at spotting them and giving us advance warning of their approach. Image credit: ESA.
An artist’s conception of an asteroid passing near the Earth. NASA is getting better at spotting them and giving us advance warning of their approach. Image credit: ESA.

In the past, NASA’s Earth Science Directorate has contributed vital information on how rising temperatures could affect water tables and farmlands (such as the ongoing drought in California), and how changes in oceanic systems would affect fisheries. On top of that, FEMA has been working with NASA in recent years in order to develop a disaster-readiness program to address the fallout from a possible asteroid impact.

This has included three tabletop exercises where the two agencies worked through asteroid impact scenarios and simulated how information would be exchanged between NASA scientists an FEMA emergency managers. As Melissa Weihenstroer – a Presidential Management Fellow in FEMA’s Office of External Affairs and who works with NASA’s Planetary Defense Coordination Office – recently wrote about this inter-agency cooperation:

“Since FEMA doesn’t have direct experience with asteroids or their impacts, we’ve turned to some people who do: our partners at the National Aeronautics and Space Administration (NASA). While FEMA will be the agency in charge of the U.S. government efforts in preparing for and responding to any anticipated asteroid-related event here on Earth, NASA is responsible for finding, tracking, and characterizing potentially hazardous asteroids and comets while they are still in space.

Whenever a transition occurs between one presidential administration and the next, there is always some level of concern about the impact it will have on federal organization. However, when an administration is unclear about its policies, and has made statements to the effect that federal agencies should cease conducting certain types of research, NASA can be forgiven for getting a little nervous.

In the coming years, it will be interesting to see how the budget environment changes for Earth science research. One can only hope that a Trump administration will not see fit to make sweeping cuts without first considering the potential consequences.

Further Reading: The Conversation, The Washington Post

How Strong is the Force of Gravity on Earth?

The Geoid 2011 model, based on data from LAGEOS, GRACE, GOCE and surface data. Credit: GFZ

Gravity is a pretty awesome fundamental force. If it wasn’t for the Earth’s comfortable 1 g, which causes objects to fall towards the Earth at a speed of 9.8 m/s², we’d all float off into space. And without it, all us terrestrial species would slowly wither and die as our muscles degenerated, our bones became brittle and weak, and our organs ceased to function properly.

So one can say without exaggerations that gravity is not only a fact of life here on Earth, but a prerequisite for it. However, since human beings seem intent on getting off this rock – escaping the “surly bonds of Earth”, as it were – understanding Earth’s gravity and what it takes to escape it is necessary. So just how strong is Earth’s gravity?

Definition:

To break it down, gravity is a natural phenomena in which all things that possess mass are brought towards one another – i.e. asteroids, planets, stars, galaxies, super clusters, etc. The more mass an object has, the more gravity it will exert on objects around it. The gravitational force of an object is also dependent on distance – i.e. the amount it exerts on an object decreases with increased distance.

Artist's impression of the effect Earth's gravity has on spacetime. Credit: NASA
Artist’s impression of the effect Earth’s gravity has on spacetime. Credit: NASA

Gravity is also one of the four fundamental forces which govern all interactions in nature (along with weak nuclear force, strong nuclear force, and electromagnetism). Of these forces, gravity is the weakest, being approximately 1038 times weaker than the strong nuclear force, 1036 times weaker than the electromagnetic force and 1029 times weaker than the weak nuclear force.

As a consequence, gravity has a negligible influence on matter at the smallest of scales (i.e. subatomic particles). However, at the macroscopic level – that of planets, stars, galaxies, etc. – gravity is the dominant force affecting the interactions of matter. It causes the formation, shape and trajectory of astronomical bodies, and governs astronomical behavior. It also played a major role in the evolution of the early Universe.

It was responsible for matter clumping together to form clouds of gas that underwent gravitational collapse, forming the first stars – which were then drawn together to form the first galaxies. And within individual star systems, it caused dust and gas to coalesce to form the planets. It also governs the orbits of the planets around stars,  of moons around planets, the rotation of stars around their galaxy’s center, and the merging of galaxies.

Universal Gravitation and Relativity:

Since energy and mass are equivalent, all forms of energy, including light, also cause gravitation and are under the influence of it. This is consistent with Einstein’s General Theory of Relativity, which remains the best means of describing gravity’s behavior. According to this theory, gravity is not a force, but a consequence of the curvature of spacetime caused by the uneven distribution of mass/energy.

Artist's impression of the frame-dragging effect in which space and time are dragged around a massive body. Credit: einstein.stanford.edu
Artist’s impression of the frame-dragging effect in which space and time are dragged around a massive body. Credit: einstein.stanford.edu

The most extreme example of this curvature of spacetime is a black hole, from which nothing can escape. Black holes are usually the product of a supermassive star that has gone supernova, leaving behind a white dwarf remnant that has so much mass, it’s escape velocity is greater than the speed of light. An increase in gravity also results in gravitational time dilation, where the passage of time occurs more slowly.

For most applications though, gravity is best explained by Newton’s Law of Universal Gravitation, which states that gravity exists as an attraction between two bodies. The strength of this attraction can calculated mathematically, where the attractive force is directly proportional to the product of their masses and inversely proportional to the square of the distance between them.

Earth’s Gravity:

On Earth, gravity gives weight to physical objects and causes the ocean tides. The force of Earth’s gravity is the result of the planets mass and density – 5.97237 × 1024 kg (1.31668×1025 lbs) and 5.514 g/cm3, respectively. This results in Earth having a gravitational strength of 9.8 m/s² close to the surface (also known as 1 g), which naturally decreases the farther away one is from the surface.

In addition, the force of gravity on Earth actually changes depending on where you’re standing on it. The first reason is because the Earth is rotating. This means that the gravity of Earth at the equator is 9.789 m/s2, while the force of gravity at the poles is 9.832 m/s2. In other words, you weigh more at the poles than you do at the equator because of this centripetal force, but only slightly more.

The International Space Station (ISS), seen here with Earth as a backdrop. Credit: NASA
The International Space Station (ISS), seen here from an undocked crew mission with Earth as a backdrop. Credit: NASA

Finally, the force of gravity can change depending on what’s under the Earth beneath you. Higher concentrations of mass, like high-density rocks or minerals can change the force of gravity that you feel. But of course, this amount is too slight to be noticeable. NASA missions have mapped the Earth’s gravity field with incredible accuracy, showing variations in its strength, depending on location.

Gravity also decreases with altitude, since you’re further away from the Earth’s center. The decrease in force from climbing to the top of a mountain is pretty minimal (0.28% less gravity at the top of Mount Everest), but if you’re high enough to reach the International Space Station (ISS), you would experience 90% of the force of gravity you’d feel on the surface.

However, since the station is in a state of free fall (and also in the vacuum of space) objects and astronauts aboard the ISS are capable of floating around. Basically, since everything aboard the station is falling at the same rate towards the Earth, those aboard the ISS have the feeling of being weightless – even though they still weight about 90% of what they would on Earth’s surface.

Earth’s gravity is also responsible for our planet having an “escape velocity” of 11.186 km/s (or 6.951 mi/s). Essentially, this means that a rocket needs to achieve this speed before it can hope to break free of Earth’s gravity and reach space. And with most rocket launches, the majority of their thrust is dedicated to this task alone.

Because of the difference between Earth’s gravity and the gravitational force on other bodies – like the Moon (1.62 m/s²; 0.1654 g) and Mars (3.711 m/s²; 0.376 g) – scientists are uncertain what the effects would be to astronauts who went on long-term missions to these bodies.

While studies have shown that long-duration missions in microgravity (i.e. on the ISS) have a detrimental effect on astronaut health (including loss of bone density, muscle degeneration, damage to organs and to eyesight) no studies have been conducted regarding the effects of lower-gravity environments. But given the multiple proposals made to return to the Moon, and NASA’s proposed “Journey to Mars“, that information should be forthcoming!

As terrestrial beings, we humans are both blessed and cursed by the force of Earth’s gravity. On the one hand, it makes getting into space rather difficult and expensive. On the other, it ensures our health, since our species is the product of billions of years of species evolution that took place in a 1 g environment.

If we ever hope to become a truly space-faring and interplanetary species, we better figure out how we’re going to deal with microgravity and lower-gravity. Otherwise, none of us are likely to get off-world for very long!

We have written many articles about the Earth for Universe Today. Here’s Where Does Gravity Come From?, Who Discovered Gravity?, Why is the Earth Round?, Why Doesn’t the Sun Steal the Moon?, Could We Make Artificial Gravity?, and The “Potsdam Gravity Potato” Shows Variations in Earth’s Gravity.

Want more resources on the Earth? Here’s a link to NASA’s Human Spaceflight page, and here’s NASA’s Visible Earth.

We have also recorded an episode of Astronomy Cast about Earth, as part of our tour through the Solar System – Episode 51: Earth, and Episode 318: Escape Velocity.

Sources:

Quasar Light Confirms Consistency Of Electromagnetism Over 8 Billion Years

Using data provided by the Very Large Telescope in Chile, the ESO has been able to discern the "fingerprints" of the early Universe. Credit: ESO

Back in November, a team of researchers from the Swinburne University of Technology and the University of Cambridge published some very interesting findings about a galaxy located about 8 billion light years away. Using the La Silla Observatory’s Very Large Telescope (VLT), they examined the light coming from the supermassive black hole (SMBH) at its center.

In so doing, they were able to determine that the electromagnetic energy coming from this distant galaxy was the same as what we observe here in the Milky Way. This showed that a fundamental force of the Universe (electromagnetism) is constant over time. And on Monday, Dec. 4th, the ESO followed-up on this historic find by releasing the color spectrum readings of this distant galaxy – known as HE 0940-1050.

To recap, most large galaxies in the Universe have SMBHs at their center. These huge black holes are known for consuming the matter that orbits all around them, expelling tremendous amounts of radio, microwave, infrared, optical, ultra-violet (UV), X-ray and gamma ray energy in the process. Because of this, they are some of the brightest objects in the known Universe, and are visible even from billions of light years away.

 Artist’s interpretation of ULAS J1120+0641, a very distant quasar. Credit: ESO/M. Kornmesser

Artist’s interpretation of ULAS J1120+0641, a very distant quasar.
Credit: ESO/M. Kornmesser

But because of their distance, the energy which they emit has to pass through the intergalactic medium, where it comes into contact with incredible amount of matter. While most of this consists of hydrogen and helium, there are trace amounts of other elements as well. These absorb much of the light that travels between distant galaxies and us, and the absorption lines this creates can tell us of lot about the kinds of elements that are out there.

At the same time, studying the absorption lines produced by light passing through space can tell us how much light was removed from the original quasar spectrum. Using the Ultraviolet and Visual Echelle Spectrograph (UVES) instrument aboard the VLT, the Swinburne and Cambridge team were able to do just that, thus sneaking a peak at the “fingerprints of the early Universe“.

What they found was that the energy coming from HE 0940-1050 was very similar to that observed in the Milky Way galaxy. Basically, they obtained proof that electromagnetic energy is consistent over time, something which was previously a mystery to scientists. As they state in their study, which was published in the Monthly Notices of the Royal Astronomical Society:

“The Standard Model of particle physics is incomplete because it cannot explain the values of fundamental constants, or predict their dependence on parameters such as time and space. Therefore, without a theory that is able to properly explain these numbers, their constancy can only be probed by measuring them in different places, times and conditions. Furthermore, many theories which attempt to unify gravity with the other three forces of nature invoke fundamental constants that are varying.
A laser beam launched from VLT´s 8.2-metre Yepun telescope crosses the majestic southern sky and creates an artificial star at 90 km altitude in the high Earth´s mesosphere. The Laser Guide Star (LGS) is part of the VLT´s Adaptive Optics system and it is used as reference to correct images from the blurring effect of the atmosphere. The picture field is crossed by an impressive Milky Way, our own galaxy seen perfectly edge-on. The most prominent objects on the Milky Way are: Sirius, the brightest star in the sky, visible at the top and the Carina nebula, seen as a bright patch besides the telescope. From the right edge of the picture to the left, the following objects are aligned: the Small Magellanic Cloud (with the globular cluster 47 Tucanae on its right), the Large Magellanic Cloud and Canopus, the second brightest star in the sky.
A laser beam launched from the Very Large Telescope (VLT) at the ESO’s La Silla Observatory in Chile. Credit: ESO

Since it is 8 billion light years away, and its strong intervening metal-absorption-line system, probing the electromagnetic spectrum being put out by HE 0940-1050 central quasar – not to mention the ability to correct for all the light that was absorbed by the intervening intergalactic medium – provided a unique opportunity to precisely measure how this fundamental force can vary over a very long period of time.

On top of that, the spectral information they obtained happened to be of the highest quality ever observed from a quasar. As they further indicated in their study:

“The largest systematic error in all (but one) previous similar measurements, including the large samples, was long-range distortions in the wavelength calibration. These would add a ?2 ppm systematic error to our measurement and up to ?10 ppm to other measurements using Mg and Fe transitions.”

However, the team corrected for this by comparing the UVES spectra to well-calibrated spectra obtained  from the High Accuracy Radial velocity Planet Searcher (HARPS) –  which is also located at the at the La Silla Observatory. By combining these readings, they were left with a residual systematic uncertainty of just 0.59 ppm, the lowest margin of error from any spectrographic survey to date.

High Accuracy Radial velocity Planet Searcher at the ESO La Silla 3.6m telescope. Credit: ESO

This is exciting news, and for more reasons that one. On the one hand, precise measurements of distant galaxies allow us to test some of the most tricky aspects of our current cosmological models. On the other, determining that electromagnetism behaves in a consistent way over time is a major find, largely because it is responsible for such much of what goes on in our daily lives.

But perhaps most importantly of all, understanding how a fundamental force like electromagnetism behaves across time and space is intrinsic to finding out how it – as well as weak and strong nuclear force – unifies with gravity. This too has been a preoccupation of scientists, who are still at a loss when it comes to explaining how the laws governing particles interactions (i.e. quantum theory) unify with explanations of how gravity works (i.e general relativity).

By finding measurements of how these forces operate that are not varying could help in creating a working Grand Unifying Theory (GUT). One step closer to truly understanding how the Universe works!

Further Reading: ESO

What is the Weather like on Venus?

Artist's impression of the surface of Venus, showing its lightning storms and a volcano in the distance. Credit and ©: European Space Agency/J. Whatmore

Welcome back to our planetary weather series! Today, we look at Earth’s overheated “sister planet”, Venus!

Venus is often called Earth’s “Sister Planet” because of all the things they have in common. They are comparable in size, have similar compositions, and both orbit within the Sun’s habitable zone. But beyond that, there are some notable differences that makes Venus a molten hellhole, and about the last place anyone would want to visit!

Much of this has to do with Venus’ atmosphere, which is incredibly dense and entirely hostile to life as we know it. And because of its natural density and composition, the average surface temperature of Venus is hot enough to melt lead. All of this adds up to some pretty interesting weather patterns, which are also incredibly hostile!

Venus Atmosphere:

Although carbon dioxide is invisible, the clouds on Venus are made up of opaque clouds of sulfuric acid, so we can’t see down to the surface using conventional methods. Everything we know about the surface of Venus has been gathered by spacecraft equipped with radar imaging instruments, which can peer through the dense clouds and reveal the surface below.

From the many flybys and atmospheric probes sent into its thick clouds, scientists have learned that Venus’ atmosphere is incredibly dense. In fact, the mass of Venus atmosphere is 93 times that of Earth’s, and the air pressure at the surface is estimated to be as high as 92 bar – i.e. 92 times that of Earth’s at sea level. If it were possible for a human being to stand on the surface of Venus, they would be crushed by the atmosphere.

The composition of the atmosphere is extremely toxic, consisting primarily of carbon dioxide (96.5%) with small amounts of nitrogen (3.5%) and traces of other gases – most notably sulfur dioxide. Combined with its density, the composition generates the strongest greenhouse effect of any planet in the Solar System.

It is also the hottest planet in the Solar System, experiencing mean surface temperatures of 735 K (462 °C; 863.6 °F). Above the dense CO² layer, thick clouds consisting mainly of sulfur dioxide and sulfuric acid droplets scatter about 90% of the sunlight back into space.

The planet is also isothermal, which means that there is little variation in Venus’ surface temperature between day and night, or the equator and the poles. The planet’s minute axial tilt – less than 3° compared to Earth’s 23.5° – and its very slow rotational period (the planet takes around 243 days to complete a single rotation) also minimizes seasonal temperature variation.

Artist's impression of the surface of Venus. Credit: ESA/AOES
Artist’s impression of the surface of Venus. Credit: ESA/AOES

The only appreciable variation in temperature occurs with altitude. The highest point on Venus, Maxwell Montes, is therefore the coolest point on the planet, with a temperature of about 655 K (380 °C; 716 °F) and an atmospheric pressure of about 4.5 MPa (45 bar).

Meteorological Phenomena:

The weather on Venus is one of the aspects of the planet under constant study from Earth-based telescopes and space missions to Venus. And from what we’ve seen, the weather on Venus is very extreme. The entire atmosphere of the planet circulates around quickly, with winds reaching speeds of up to 85 m/s (300 km/h; 186.4 mph) at the cloud tops, which circle the planet every four to five Earth days.

At this speed, these winds move up to 60 times the speed of the planet’s rotation, whereas Earth’s fastest winds are only 10-20% of the planet’s rotational speed. Spacecraft equipped with ultraviolet imaging instruments are able to observe the cloud motion around Venus, and see how it moves at different layers of the atmosphere. The winds blow in a retrograde direction, and are the fastest near the poles.

Closer to the equator, the wind speeds die down to almost nothing. Because of the thick atmosphere, the winds move much slower as you get close to the surface of Venus, reaching speeds of about 5 km/h. Because it’s so thick, though, the atmosphere is more like water currents than blowing wind at the surface, so it is still capable of blowing dust around and moving small rocks across the surface of Venus.

Over the past six years wind speeds in Venus' atmosphere have been steadily rising (ESA)
Over the past six years wind speeds in Venus’ atmosphere have been steadily rising (ESA

Several flybys past the planet have also indicated that its dense clouds are capable of producing lightning, much like the clouds on Earth. Their intermittent appearance indicates a pattern associated with weather activity, and the lightning rate is at least half of that on Earth. Since Venus does not experience rainfall (except in the form of sulfuric acid), it has been theorized that the lightning is being caused by a volcanic eruption.

What is the weather like on Venus? Terrible, would be the short answer. The long answer is that it is extremely hot, the air pressure is extremely high, there are very strong winds, sulfuric acid rain (at higher altitudes) and lightning storms driven by volcanic eruptions. It is little wonder then why the only practical option for colonizing Venus involves creating  floating cities above the cloud layer.

We have written many articles about Venus for Universe Today. Here’s The Planet Venus, Interesting Facts About Venus, What is the Average Temperature of Venus?, New Map Hints at Venus’ Wet, Volcanic Past, Venus Possibly had Continents, Oceans, How Do We Terraform Venus? and Colonizing Venus With Floating Cities.

Want more information on Venus? Here’s a link to Hubblesite’s News Releases about Venus, and here’s a link to NASA’s Solar System Exploration Guide on Venus.

We have recorded a whole episode of Astronomy Cast that’s only about planet Venus. Listen to it here, Episode 50: Venus.

Sources: