We’re Not Saying It’s Aliens Because It’s Not Aliens. But Check Out These UFO Data Visualizations

The number of UFO sightings per year, Credit: Sam Monfort

When it comes to conspiracy theories and modern preoccupations, few things are more popular than unidentified flying objects (UFOs) and alien abductions. For over half a century, there have been rumors, reports, and urban legends about aliens coming to Earth, dabbling with our genetics, and conducting weird (and often invasive) experiments on our citizens.

And while opinions on what drives this popular phenomenon tend to differ (some say hysteria, others that it is media-driven), a few things are clear. For one, sightings appear to take place far more in the United States than anywhere else in the world. And in recent years, these sightings have been on the rise!

Such are the conclusions of a series of visualizations based on the National UFO Reporting Center (NUFORC). Established in 1974 (and located in Davenport, Washington), the National UFO Reporting Center is “dedicated to the collection and dissemination of objective UFO data”. Since that time, they have been monitoring UFO sightings worldwide and have maintained careful logs about the 104,947 sightings that have taken place since 1905.

The geographic distribution of UFO sightings. Credit: sammonfort3

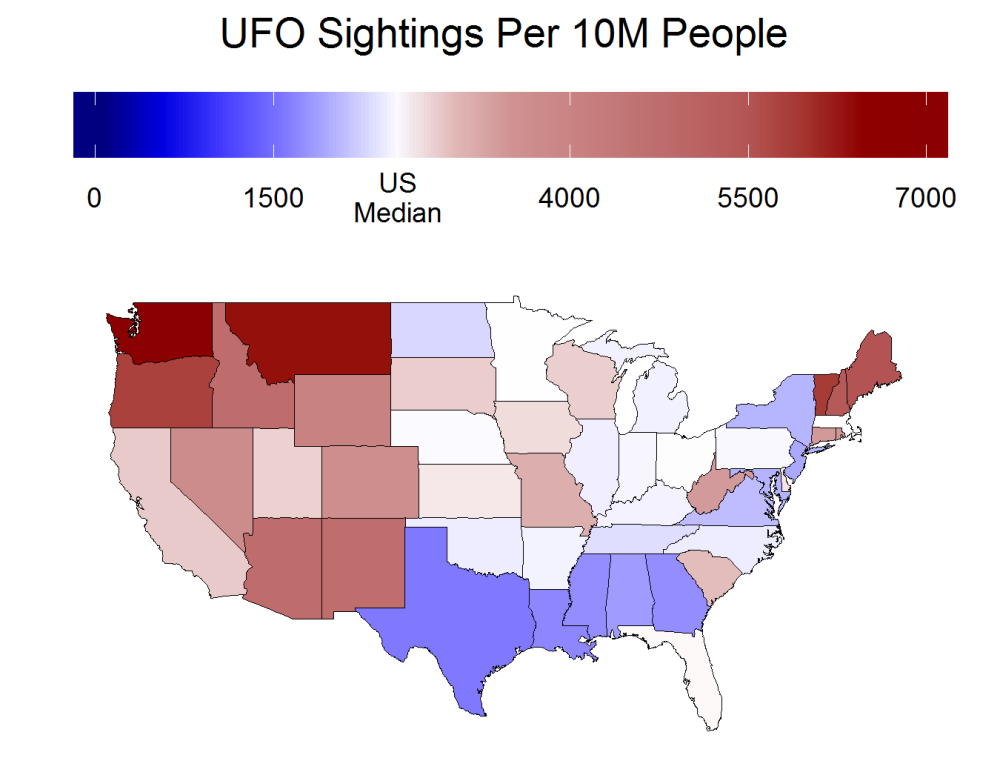
Using this data, Sam Monfort – a Doctoral Candidate from the department of Human Factors & Applied Cognition at George Mason University – produced a series of visuals that illustrate the history of UFO sightings. And based on the visualized trends, some rather interesting conclusions can be drawn. The most obvious is that the geographical distribution of sightings is hardly even. For starters, reports in the USA were equal to about 2500 sightings per 10 million people.

This is almost 300 times higher than the global average. Based on individual states, the concentration of sightings was also quite interesting. Apparently, more sightings happen (per 10 million people) in the West and Northwest, with the highest numbers coming from Washington and Montana. Oregon, Idaho, Arizona and New Mexico also made strong showings, while the Great Lakes and Midwestern states were all consistent with the national median.

On the opposite coast, Maine, Vermont, and New Hampshire all had a good number of sightings per capita, though the state of New York even as New York was beneath the national median. Texas actually ranked the lowest, and was followed by the Southern states of Louisiana, Mississippi, Alabama and Georgia. But as Monfort told Universe Today via email, this may be slightly skewed because of who is collecting the information:

“[I]t’s worth mentioning that the NUFORC is an American agency (“N” stands for “National”). They make an effort to record international sightings (phone banks staffed 24/7), but I’d guess that sightings in the USA are still over-represented. Honestly, I’d bet that the NUFORC being based in Seattle is the main reason we see so many more sightings in the States. A more thorough analysis might cross-reference sightings from other agencies, like MUFON.”

The geographic breakdown of annual UFO sightings (per 10 million people) in the US. Credit: sammonfort3

Canadians did not do much better, coming at second place after the United States with 1000 sightings per 10 million people. And according to a recent article by Allan Maki of The Globe and Mail, its becoming more common – with a record 1982 sightings reported in 2012. He also suggests that this could be due to a combination of growing interest in the subject and reduced stigma.

Iceland, the UK, Australia, the Virgin Islands and Cyprus all ranked a distant third, with between 250 and 500 sightings per 100 million people per year. New Zealand, Mexico, Israel and the Gulf States also produced considerable returns, as did the United Kingdom, Ireland, Portugal, Belgium, Danemark, Finland, Sweden and Norway.

From this distribution, one might make the generalization that more developed nations are more likely to report UFOs (i.e. better record-keeping and all that). And this is a possibility which Monfort explored. In another visualization, he cross-referenced the number of sightings in a respective country with amount of internet access it has (per 100 people), and a limited correlation was shown.

Nations like Israel and the Gulf States have a higher number of sightings than neighboring countries like Syria, Saudi Arabia and Iraq, while South Africa has more reported sightings than several North African and Sub-Saharan African nations surveyed. However, fast-developing nations like Russia, China and India showed a lower than average level of sightings, while Guyana and Suriname showed a higher than average level.

The number of UFO sightings per year, subdivided based on the type of object reported. Credit: sammonfort3

France, Italy and the Czech Republic also lagged behind many of their European counterparts, and Germany and Spain were only slightly higher than the average. So much like distribution by state within the US, internet access does not seem to be a consistent determining factor. Another interesting visualization was the one which broke down the sightings per decade based on the nature of the sighting.

As you can see from the table above, when UFO sightings first began in the early 20th century, they reportedly took the form of either a sphere or a cigar-shaped object. This differs from the 1920s, when “flying saucers” began to appear, and remained the dominant trend throughout World War II and the Cold War era. And ever since the 1990s – what Monfort refers to as “post-internet” era – the most common UFO sightings took the form of bright lights.

“If I had to guess, I’d say it was a combination of factors,” said Monfort. “Like I mentioned in the blog, it seems a lot more plausible that someone would see strange lights in the sky than a flying object with a concrete shape (like a saucer). Seeing a shape implies that the object is pretty close to you, “and if it’s that close why didn’t you take a video of it?”

As for other factors, Monfort considers the possibility of fireworks and (as one comment on his blog suggested) Chinese lanterns. “Those are the little paper balloons you light a candle in and let fly. Some of the bright light sightings could be those, especially since I’d bet most Chinese lanterns are released in groups, with several people going out in groups to release them together. (Often people report formations of lights.)”

Naturally, the data does not support any ironclad conclusions, and plenty can be said about its reliability and methodology. After all, while UFO sightings are documented, they are famous for being routinely debunked. Nevertheless, visuals like these are interesting in illustrated the patterns of sightings, and can allow for some insightful speculation as to why they take place.

Further Reading: Visualize This

Finally, the Missing Link in Planetary Formation!

This artist's illustration shows planetisimals around a young star. New research shows that planetesimals are blasted by headwind, losing debris into space. Image Credit: NASA/JPL

The theory of how planets form has been something of an enduring mystery for scientists. While astronomers have a pretty good understanding of where planetary systems comes from – i.e. protoplanetary disks of dust and gas around new stars (aka. “Nebular Theory“) – a complete understanding of how these discs eventually become objects large enough to collapse under their own gravity has remained elusive.

But thanks to a new study by a team of researchers from France, Australia and the UK, it seems that the missing piece of the puzzle may finally have been found. Using a series of simulations, these researchers have shown how “dust traps” – i.e. regions where pebble-sized fragments could collect and stick together – are common enough to allow for the formation of planetesimals.

Their study, titled “Self-Induced Dust Traps: Overcoming Planet Formation Barriers“, appeared recently in the Monthly Notices of the Royal Astronomical Society. Led by Dr. Jean-Francois Gonzalez – of the Lyon Astrophysics Research Center (CRAL) in France – the team examined the troublesome middle-stage of planetary formation that has plagued scientists.

An image of a protoplanetary disk, made using results from the new model, after the formation of a spontaneous dust trap, visible as a bright dust ring. Gas is depicted in blue and dust in red. Credit: Jean-Francois Gonzalez.

Until recently, the process by which protoplanetary disks of dust and gas aggregate to form peddle-sized objects, and the process by which planetesimals (objects that are one hundred meters or more in diameter) form planetary cores, have been well understood. But the process that bridges these two – where pebbles come together to form planetesimals – has remained unknown.

Part of the problem has been the fact that the Solar System, which has been our only frame of reference for centuries, formed billions of years ago. But thanks to recent discoveries (3453 confirmed exoplanets and counting), astronomers have had lots of opportunities to study other systems that are in various stages of formation. As Dr. Gonzalez explained in a Royal Astronomical Society press release:

“Until now we have struggled to explain how pebbles can come together to form planets, and yet we’ve now discovered huge numbers of planets in orbit around other stars. That set us thinking about how to solve this mystery.”

In the past, astronomers believed that “dust traps” – which are integral to planet formation – could only exist within certain environments. In these high-pressure regions, large grains of dust are slowed down to the point where they are able to come together. These regions are extremely important since they counteract the two main obstacles to planetary formation, which are drag and high-speed collisions.

Artist’s impression of the planets in our solar system, along with the Sun (at bottom). Credit: NASA

Drag is caused by the effect gas has on dust grains, which causes them to slow down and eventually drift into the central star (where they are consumed). As for high-speed collisions, this is what causes large pebbles to smash into each other and break apart, thus reversing the aggregation process. Dust traps are therefore needed to ensure that dust grains are slowed down just enough so that they won’t annihilate each other when they collide.

To see just how common these dust traps were, Dr. Gonzalez and his colleagues conducted a series of computer simulations that took into account how dust in a protoplanetary disk could exert drag on the gas component – a process known as “aerodynamic drag back-reaction”. Whereas gas typically has an arresting influence on dust particles, in particularly dusty rings, the opposite can be true.

This effect has been largely ignored by astronomers up until recently, since its generally quite negligible. But as the team noted, it is an important factor in protoplanetary disks, which are known for being incredibly dusty environments. In this scenario, the effect of back-reaction is to slow inward-moving dust grains and push gas outwards where it forms high-pressure regions – i.e. “dust traps”.

Once they accounted for these effects, their simulations showed how planets form in three basic stages. In the first stage, dust grains grow in size and move inwards towards the central star. In the second, the now pebble-sized larger grains accumulate and slow down. In the third and final stage, the gas is pushed outwards by the back-reaction, creating the dust trap regions where it accumulates.

Illustration showing the stages of the formation mechanism for dust traps. Credit: © Volker Schurbert.

These traps then allow the pebbles to aggregate to form planetesimals, and eventually planet-sized worlds. With this model, astronomers now have a solid idea of how planetary formation goes from dusty disks to planetesimals coming together. In addition to resolving a key question as to how the Solar System came to be, this sort of research could prove vital in the study of exoplanets.

Ground-based and space-based observatories have already noted the presence of dark and bright rings that are forming in protoplanetary disks around distant stars – which are believed to be dust traps. These systems could provide astronomers with a chance to test this new model, as they watch planets slowly come together. As Dr. Gonzalez indicated:

“We were thrilled to discover that, with the right ingredients in place, dust traps can form spontaneously, in a wide range of environments. This is a simple and robust solution to a long standing problem in planet formation.”

Further Reading: Royal Astronomical Society, MNRAS

This is Actual Science. Crystals at the Earth’s Core Power its Magnetic Field

The Earth's layers, showing the Inner and Outer Core, the Mantle, and Crust. Credit: discovermagazine.com

Whether or not a planet has a magnetic field goes a long way towards determining whether or not it is habitable. Whereas Earth has a strong magnetosphere that protects life from harmful radiation and keeps solar wind from stripping away its atmosphere, planet’s like Mars no longer do. Hence why it went from being a world with a thicker atmosphere and liquid water on its surface to the cold, desiccated place it is today.

For this reason, scientists have long sought to understand what powers Earth’s magnetic field. Until now, the consensus has been that it was the dynamo effect created by Earth’s liquid outer core spinning in the opposite direction of Earth’s rotation. However, new research from the Tokyo Institute of Technology suggests that it may actually be due to the presence of crystallization in the Earth’s core.

The research was conducted by scientists from the Earth-Life Science Institute (ELSI) at Tokyo Tech. According to their study – titled “Crystallization of Silicon Dioxide and Compositional Evolution of the Earth’s Core“, which appeared recently in Nature – the energy that drives the Earth’s magnetic field may have more to do with the chemical composition of the Earth’s core.

Using a diamond anvil and a laser, researchers at Tokyo Tech subjected silicon and oxygen samples to conditions similar to the Earth’s core. Credit: Sang-Heon Shim/Arizona State University

Of particular concern for the research team was the rate of which Earth’s core cools over geological time – which has been the subject of debate for some time. And for Dr. Kei Hirose – the director of the Earth-Life Science Institute and lead author on the paper – it has been something of a lifelong pursuit. In a 2013 study, he shared research findings that indicated how the Earth’s core may have cooled more significantly than previously thought.

He and his team concluded that since the Earth’s formation (4.5 billion years ago), the core may have cooled by as much as 1,000 °C (1,832 °F). These findings were rather surprising to the Earth sciences community – leading to what one scientists referred to as the “New Core Heat Paradox“. In short, this rate of core cooling would mean that some other source of energy would be required to sustain the Earth’s geomagnetic field.

On top of this, and related to the issue of core-cooling, were some unresolved questions about the chemical composition of the core. As Dr. Kei Hirose said in a Tokyo Tech press release:

“The core is mostly iron and some nickel, but also contains about 10% of light alloys such as silicon, oxygen, sulfur, carbon, hydrogen, and other compounds. We think that many alloys are simultaneously present, but we don’t know the proportion of each candidate element.”

The magnetic field and electric currents in and around Earth generate complex forces that have immeasurable impact on every day life. Credit: ESA/ATG medialab

In order to resolve this, Hirose and his colleagues at ELSI conducted a series of experiments where various alloys were subjected to heat and pressure conditions similar to that in the Earth’s interior. This consisted of using a diamond anvil to squeeze dust-sized alloy samples to simulate high pressure conditions, and then heating them with a laser beam until they reached extreme temperatures.

In the past, research into iron alloys in the core have focused predominantly on either iron-silicon alloys or iron-oxide at high pressures. But for the sake of their experiments, Hirose and his colleagues decided to focus on the combination of silicon and oxygen – which are believed to exist in the outer core – and examining the results with an electron microscope.

What the researchers found was that under conditions of extreme pressure and heat, samples of silicon and oxygen combined to form silicon dioxide crystals – which were similar in composition to mineral quartz found in the Earth’s crust. Ergo, the study showed that the crystallization of silicon dioxide in the outer core would have released enough buoyancy to power core convection and a dynamo effect from as early on as the Hadean eon onward.

As John Hernlund, also a member of ELSI and a co-author of the study, explained:

“This result proved important for understanding the energetics and evolution of the core. We were excited because our calculations showed that crystallization of silicon dioxide crystals from the core could provide an immense new energy source for powering the Earth’s magnetic field.”

Cross-section of Mars revealing its inner core. Mars must have one day had such a field, but the energy source that powered it has since shut down. Credit: NASA/JPL/GSFC

This study not only provides evidence to help resolve the so-called “New Core Heat Paradox”, it also may help advance our understanding of what conditions were like during the formation of Earth and the early Solar System. Basically, if silicon and oxygen form crystal of silicon dioxide in the outer core over time, then sooner or later, the process will stop once the core runs out of these elements.

When that happens, we can expect Earth’s magnetic field will suffer, which will have drastic implications for life on Earth. It also helps to put constraints on the concentrations of silicon and oxygen that were present in the core when the Earth first formed, which could go a long way towards informing our theories about Solar System formation.

What’s more, this research may help geophysicists to determine how and when other planets (like Mars, Venus and Mercury) still had magnetic fields (and possibly lead to ideas of how they could be powered up again). It could even help exoplanet-hunting science teams determine which exoplanets have magnetospheres, which would allow us to find out which extra-solar worlds could be habitable.

Further Reading: Tokyo Tech News, Nature.

SETI Has Already Tried Listening to TRAPPIST-1 for Aliens

This artist's concept shows what each of the TRAPPIST-1 planets may look like, based on available data about their sizes, masses and orbital distances. Credits: NASA/JPL-Caltech

The Trappist-1 system has been featured in the news quite a bit lately. In May of 2016, it appeared in the headlines after researchers announced the discovery of three exoplanets orbiting around the red dwarf star. And then there was the news earlier this week of how follow-up examinations from ground-based telescopes and the Spitzer Space Telescope revealed that there were actually seven planets in this system.

And now it seems that there is more news to be had from this star system. As it turns out, the Search for Extraterrestrial Intelligence (SETI) Institute was already monitoring this system with their Allen Telescope Array (ATA), looking for signs of life even before the multi-planet system was announced. And while the survey did not detect any telltale signs of radio traffic, further surveys are expected.

Given its proximity to our own Solar System, and the fact that this system contains seven planets that are similar in size and mass to Earth, it is both tempting and plausible to think that life could be flourishing in the TRAPPIST-1 system. As Seth Shostak, a Senior Astronomer at SETI, explained:

“[T]he opportunities for life in the Trappist 1 system make our own solar system look fourth-rate.  And if even a single planet eventually produced technically competent beings, that species could quickly disperse its kind to all the rest… Typical travel time between worlds in the Trappist 1 system, even assuming rockets no speedier than those built by NASA, would be pleasantly short.  Our best spacecraft could take you to Mars in 6 months.  To shuttle between neighboring Trappist planets would be a weekend junket.”

Illustration showing the possible surface of TRAPPIST-1f, one of the newly discovered planets in the TRAPPIST-1 system. Credits: NASA/JPL-Caltech

Little wonder then why SETI has been using their Allen Telescope Array to monitor the system ever since exoplanets were first announced there. Located at the Hat Creek Radio Observatory in northern California (northeast of San Francisco), the ATA is what is known as a “Large Number of Small Dishes” (LNSD) array – which is a new trend in radio astronomy.

Like other LNSD arrays – such as the proposed Square Kilometer Array currently being built in Australia and South Africa – the concept calls for the deployment of many smaller dishes over a large surface area, rather than a single large dish. Plans for the array began back in 1997, when the SETI Institute convened a workshop to discuss the future of the Institute and its search strategies.

The final report of the workshop, titled “SETI 2020“, laid out a plan for the creation of a new telescope array. This array was referred to as the One Hectare Telescope at the time, since the plan called for a LNSD encompassing an area measuring 10,000 m² (one hectare). The SETI Institute began developing the project in conjunction with the Radio Astronomy Laboratory (RAL) at the UC Berkeley.

In 2001, they secured a $11.5 million donation from the Paul G. Allen Family Foundation, which was established by Microsoft co-founder Paul Allen. In 2007, the first phase of construction was completed and the ATA finally became operational on October 11th, 2007, with 42 antennas (ATA-42). Since that time, Allen has committed to an additional $13.5 million in funding for a second phase of expansion (hence why it bears his name).

A portion of the Allen Telescope Array. (Credit: Seth Shostak/The SETI Institute. Used with permission)

Compared to large, single dish-arrays, smaller dish-arrays are more cost-effective because they can be upgraded simply by adding more dishes. The ATA is also less expensive since it relies on commercial technology originally developed for the television market, as well as receiver and cryogenic technologies developed for radio communication and cell phones.

It also uses programmable chips and software for signal processing, which allows for rapid integration whenever new technology becomes available. As such, the array is well suited to running simultaneous surveys at centimeter wavelengths. As of 2016, the SETI Institute has performed observations with the ATA for 12 hour periods (from 6 pm and 6 am), seven days a week.

And last year, the array was aimed towards TRAPPIST-1, where it conducted a survey scanning ten billion radio channels in search of signals. Naturally, the idea that a radio signal would be emanating from this system, and one which the ATA could pick up, might seem like a bit of a longshot. But in fact, both the infrastructure and energy requirements would not be beyond a species who’s technical advancement is commensurate with our own.

“Assuming that the putative inhabitants of this solar system can use a transmitting antenna as large as the 500 meter FAST radio telescope in China to beam their messages our way, then the Allen Array could have found a signal if the aliens use a transmitter with 100 kilowatts of power or more,” said Shostak. “This is only about ten times as energetic as the radar down at your local airport.”

A plot of diameter versus the amount of sunlight hitting the planets in the TRAPPIST-1 system, scaled by the size of the Earth and the amount of sunlight hitting the Earth. Credit: F. Marchis/H. Marchis

So far, nothing has been picked up from this crowded system. But the SETI Institute is not finished and future surveys are already in the works. If there is a thriving, technologically-advanced civilization in this system (and they know their way around a radio antenna), surely there will be signs soon enough.

And regardless, the discovery of seven planets in the TRAPPIST-1 system is very exciting because it demonstrates just how plentiful systems that could support life are in our Universe. Not only does this system have three planets orbiting within its habitable zone (all of which are similar in size and mass to Earth), but the fact that they orbit a red dwarf star is very encouraging.

These stars are the most common in our Universe, making up 70% of stars in our galaxy, and up to 90% in elliptical galaxies. They are also very stable, remaining in their Main Sequence phase for up to 10 trillion years. Last, but not least, astronomers believe that 20 out of 30 nearest stars to our Solar System are red dwarfs. Lots of opportunities to find life within a few dozen light years!

“[W]hether or not Trappist 1 has inhabitants, its discovery has underlined the growing conviction that the Universe is replete with real estate on which biology could both arise and flourish,’ says Shostak. “If you still think the rest of the universe is sterile, you are surely singular, and probably wrong.”

Further Reading: SETI

It Might Be Possible to Refreeze the Icecaps to Slow Global Warming

NASA icecap data
NASA icecap data

One of the most worrisome aspects of Climate Change is the role played by positive feedback mechanisms. In addition to global temperatures rising because of increased carbon dioxide and greenhouse gas emissions, there is the added push created by deforestation, ocean acidification, and (most notably) the disappearance of the Arctic Polar Ice Cap.

However, according to a new study by a team of researchers from the School of Earth and Space Exploration at Arizona State University, it might be possible to refreeze parts of the Arctic ice sheet. Through a geoengineering technique that would rely on wind-powered pumps, they believe one of the largest positive feedback mechanisms on the planet can be neutralized.

Their study, titled “Arctic Ice Management“, appeared recently in Earth’s Future, an online journal published by the American Geophysical Union. As they indicate, the current rate at which Arctic ice is disappearing it quite disconcerting. Moreover, humanity is not likely to be able to combat rising global temperatures in the coming decades without the presence of the polar ice cap.

A drastic decrease in arctic sea ice since satellite imaging of the polar ice cap began. Credit: NASA

Of particular concern is the rate at which polar ice has been disappearing, which has been quite pronounced in recent decades. The rate of loss has been estimated at being between 3.5% and 4.1% per decade, with in an overall decrease of at least 15% since 1979 (when satellite measurements began). To make things worse, the rate at which ice is being lost is accelerating.

From a baseline of about 3% per decade between 1978-1999, the rate of loss since the 2000s has climbed considerably – to the point that the extent of sea-ice in 2016 was the second lowest ever recorded. As they state in their Introduction (and with the support of numerous sources), the problem is only likely to get worse between now and the mid-21st century:

“Global average temperatures have been observed to rise linearly with cumulative CO2 emissions and are predicted to continue to do so, resulting in temperature increases of perhaps 3°C or more by the end of the century. The Arctic region will continue to warm more rapidly than the global mean. Year-round reductions in Arctic sea ice are projected in virtually all scenarios, and a nearly ice-free (<106 km2 sea-ice extent for five consecutive years) Arctic Ocean is considered “likely” by 2050 in a business-as-usual scenario.”

One of the reasons the Arctic is warming faster than the rest of the planet has to do with strong ice-albedo feedback. Basically, fresh snow ice reflects up to 90% of sunlight while sea ice reflects sunlight with albedo up to 0.7, whereas open water (which has an albedo of close to 0.06) absorbs most sunlight. Ergo, as more ice melts, the more sunlight is absorbed, driving temperatures in the Arctic up further.

Arctic sea-ice extent (area covered at least 15% by sea ice) in September 2007 (white area). The red curve denotes the 1981–2010 average. Credit: National Snow and Ice Data CenterTo address this concern, the research team – led by Steven J. Desch, a professor from the School of Earth and Space Exploration – considered how the melting is connected to seasonal fluctuations. Essentially, the Arctic sea ice is getting thinner over time because new ice (aka. “first-year ice”), which is created with every passing winter, is typically just 1 meter (3.28 ft) thick.

Ice that survives the summer in the Arctic is capable of growing and becoming “multiyear ice”, with a typical thickness of 2 to 4 meters (6.56 to 13.12 ft). But thanks to the current trend, where summers are getting progressively warmer, “first-year ice” has been succumbing to summer melts and fracturing before it can grow. Whereas multiyear ice comprised 50 to 60% of all ice in the Arctic Ocean in the 1980s, by 2010, it made up just 15%.

With this in mind, Desch and his colleagues considered a possible solution that would ensure that “first-year ice” would have a better chance of surviving the summer. By placing machines that would use wind power to generate pumps, they estimate that water could be brought to the surface over the course of an Arctic winter, when it would have the best chance of freezing.

Based on calculations of wind speed in the Arctic, they calculate that a wind turbine with 6-meter diameter blades would generate sufficient electricity so that a single pump could raise water to a height of 7 meters, and at a rate of 27 metric tons (29.76 US tons) per hour. The net effect of this would be thicker sheets of ice in the entire affected area, which would have a better chance of surviving the summer.

Melt pools on melting sea-ice. Every summer, newly-formed ice is threatened because of rising global temperatures. Credit NASA

Over time, the negative feedback created by more ice would cause less sunlight to be absorbed by the Arctic ocean, thus leading to more cooling and more ice accumulation. This, they claim, could be done on a relatively modest budget of $500 billion per year for the entire Arctic, or $50 billion per year for 10% of the Arctic.

While this may sounds like a huge figure, they are quick to point out that the cast covering the entire Arctic with ice-creating pumps  – which could save trillions in GDP and countless lives- is equivalent to just 0.64% of current world gross domestic product (GDP) of $78 trillion. For a country like the United States, it represents just 13% of the current federal budget ($3.8 trillion).

And while there are several aspects of this proposal that still need to be worked out (which Desch and his team fully acknowledge), the concept does appear to be theoretically sound. Not only does it take into account the way seasonal change and Climate Change are linked in the Arctic, it acknowledges how humanity is not likely to be be able to address Climate Change without resorting to geoengineering techniques.

And since Arctic ice is one of the most important things when it comes to regulating global temperatures, it makes perfect sense to start here.

Further Reading: Earth’s Future

Here’s an Aerial View of a Massive Iceberg Shearing away from Antarctica

The rift in the Larsen C Ice Shelf. Credit: NASA/John Sonntag

Located along the east coast of the Antarctic Peninsula is the Larsen Ice Shelf. Named after the Norwegian Captain who explored the ice front back in 1893, this ice shelf has been monitored for decades due to its close connection with rising global temperatures. Essentially, since the 1990s, the shelf has been breaking apart, causing collapses of considerable intensity.

According to the British Antarctic Survey (BAS), the section of the ice sheet known as the Larsen C Ice Shelf could be experiencing a collapse of its own soon enough. Based on video footage and satellite evidence of the sizeable rift (which is 457 m or 15oo ft across) in the shelf, it is believed that an ice berg that is roughly 5,000 km² (1930.5 mi²) in size could be breaking off and calving into the ocean in the near future.

An ice shelf is essentially a floating extension of a land-based glacier. In this case, the Larsen Ice Shelf is seaborne section of the larger Larsen Glacier, which flows southeast past Mount Larsen and enters the Ross Sea just south of Victoria Land. These shelves often act as buttresses, holding back glaciers that flow down to the coast, thus preventing them from entering the ocean and contributing to rising sea levels.

In the past twenty-two years, the Larsen A and B ice shelves (which were situated further north along the Antarctic Peninsula) both collapsed into the sea. This resulted in the dramatic acceleration of glaciers behind them, as larger volumes of ice were able to flow down the coast and drop into the ocean. While Larsen C appeared to still be stable, in November of 2016, NASA noted the presence of a large crack in its surface.

This crack was about 110 kilometers (68 mi) long and was more than 91 m (299 ft) wide, reaching a depth of about 500 m (1,600 ft). By December, the rift had extended another 21 km (13 mi), which raised concerns about calving. In February of 2017, satellite observations of the shelf noted that the crack appeared to have grown further, which confirmed what researches from the MIDAS project had previously reported.

This UK-based Antarctic research project – which is based at Swansea University and Aberystwyth University in Wales and supported by the BAS and various international partners – is dedicated to monitoring the Larsen C ice shelf in Antarctica. Through a combination of field work, satellite observations, and computer simulations, they have catalogued how recent warming trends has caused seasonal melts of the ice shelf and affected its structure.

And in recent years, they have been monitoring the large crack, which has been fast-moving, and noted the appearance of several elongations. It was during the current Antarctic field season that members of the project filmed what the crack looked like from the air. In previous surveys, the glaciology research team has conducted research on the ice shelf using seismic techniques to survey the seafloor beneath it.

However, this past season, they did not set up on the ice shelf itself for fear of a calving event. Instead, they made a series of trips to and from the UK’s Rothera Research Station aboard twin otter aircraft. During an outing to retrieve some of their science equipment, the crew noted how the crack looked from above and started filming. As you can see from the footage, the rift is very wide and extremely long.

What’s more, the team estimates that if an iceberg from this shelf breaks off and falls into the ocean, it will likely be over three times the size of cities like London or New York City. And while this sort of thing is common with glaciers, the collapse of a large section of Larsen C could speed the flow of the Larsen Glacier towards the Antarctic Ocean.

As Dr Paul Holland, an ice and ocean modeller at the British Antarctic Survey, said in a recent press release:

“Iceberg calving is a normal part of the glacier life cycle, and there is every chance that Larsen C will remain stable and this ice will regrow.  However, it is also possible that this iceberg calving will leave Larsen C in an unstable configuration.  If that happens, further iceberg calving could cause a retreat of Larsen C. We won’t be able to tell whether Larsen C is unstable until the iceberg has calved and we are able to understand the behavior of the remaining ice. The stability of ice shelves is important because they resist the flow of the grounded ice inland.  After the collapse of Larsen B, its tributary glaciers accelerated, contributing to sea-level rise.”

One of the greatest concerns about climate change is the feedback mechanisms it creates. In addition to increased warming trends caused by rising levels of CO² in the atmosphere, the melting of glaciers and the breakup of ice shelves can have a pronounced effect on sea levels. In the end, the depletion of glaciers in Antarctica could have dramatic consequences for the rest of the planet.

Further Reading: British Antarctic Survey

Huge News, Seven Earth-Sized Worlds Orbiting a Red Dwarf, Three in the Habitable Zone

Illustration showing the possible surface of TRAPPIST-1f, one of the newly discovered planets in the TRAPPIST-1 system. Credits: NASA/JPL-Caltech
Illustration showing the possible surface of TRAPPIST-1f, one of the newly discovered planets in the TRAPPIST-1 system. It's a very active flare star. Credits: NASA/JPL-Caltech

In what is surely the biggest news since the hunt for exoplanets began, NASA announced today the discovery of a system of seven exoplanets orbiting the nearby star of TRAPPIST-1. Discovered by a team of astronomers using data from the TRAPPIST telescope in Chile and the Spitzer Space Telescope, this find is especially exciting since all of these planets are believed to be Earth-sized and terrestrial (i.e. rocky).

But most exciting of all is the fact that three of these rocky exoplanets orbit within the star’s habitable zone (aka. “Goldilocks Zone”). This means, in effect, that these planets are capable of having liquid water on their surfaces and could therefore support life. As far as extra-solar planet discoveries go, this is without precedent, and the discovery heralds a new age in the search for life beyond our Solar System.

Continue reading “Huge News, Seven Earth-Sized Worlds Orbiting a Red Dwarf, Three in the Habitable Zone”

The Orbit of Venus. How Long is a Year on Venus?

Venus captured by Magellan.

Venus and Earth have many similarities. Both are terrestrial planets, meaning that they are composed predominately of metal and silicate rock, which is differentiated between a metal core and a silicate mantle and crust. Both also orbit the Sun within its habitable zone (aka. “Goldilocks Zone“). Hence why Venus and Earth are often called “sister planets”.

However, Venus is also starkly different from Earth in a number of ways. It’s atmosphere, which is composed primarily of carbon dioxide and small amounts of nitrogen, is 92 times as dense as Earth’s. It is also the hottest planet in the Solar System, with temperatures hot enough to melt lead! And on top of all that, a year on Venus is much different than a year on Earth.

Orbital Period:

Venus orbits the Sun at an average distance of about 0.72 AU (108,000,000 km/67,000,000 mi) with almost no eccentricity. In fact, with its farthest orbit (aphelion) of 0.728 AU (108,939,000 km) and closest orbit (perihelion) of 0.718 AU (107,477,000 km), it has the most circular orbit of any planet in the Solar System.

Earth and Venus’ orbit compared. Credit: Sky and Telescope

The planet’s orbital period is 224.65 days, which means that a year on Venus is 61.5% as long as a year on Earth. Unlike most other planets in the Solar System, which rotate on their axes in an counter-clockwise direction, Venus rotates clockwise (called “retrograde” rotation). It also rotates very slowly, taking 243 Earth days to complete a single rotation.

Sidereal vs. Solar Day:

While a year on Venus lasts the equivalent of 224.65 Earth days, it only lasts the equivalent 1.92 days on Venus. This is due to the fact that Venus rotates quick slowly and in the opposite direction of its orbit. Because of this, a Solar Day – the time it takes for the Sun to rise, set, and return to the same place in the sky – takes 116.75 Earth days.

This means, in effect, that a single day on Venus lasts over half a year. In other words, in the space of just over a single Venusian year, the Sun will appear to have circled the heavens twice. In addition, to someone standing on the planet’s surface, the Sun would appear to rise in the west and set in the east.

Variations:

Because of its dense atmosphere and its highly circular rotation, Venus experiences very little in the way of temperature variations during the course of a year. Similarly, its axial tilt of 2.64° (compared to Earth’s 23.44°) is the second-lowest in the Solar System, behind Mercury’s extremely low tilt of 0.03.

This means that there is virtually no variation in Venus’ surface temperature between day and night, or the equator and the poles. All year long, the mean surface temperature of Venus is a scorching 735 K (462 °C/863.6 °F), with the only variations occurring as a result of elevation.

Yes, Venus is a truly hellish place. And unfortunately, that’s a year-round phenomena! The days are extremely hot, the nights extremely hot, and a day lasts over half as long as a year. So if you’re planning on vacationing somewhere, might we recommend somewhere a little less sunny and balmy?

We’ve written several articles about years on other planets here at Universe Today. Here’s How Long is a Year on the Other Planets?, Which Planet has the Longest Day?, How Long is a Year on Mercury?, How Long is a Year on Earth?, How Long is a Year on Mars?, How Long is a Year on Jupiter?, How Long is a Year on Saturn?, How Long is a Year on Uranus?, How Long is a Year on Neptune?, How Long is a Year on Pluto?

If you’d like more info on Venus, check out Hubblesite’s News Releases about Venus, and here’s a link to NASA’s Solar System Exploration Guide on Venus.

We’ve also recorded an episode of Astronomy Cast all about Venus. Listen here, Episode 50: Venus.

Sources:

United Arab Emirates Has a Plan to Colonize Mars with 600,000 People in 100 Years

Artist's concept for a possible colony on Mars, which the United Arab Emirates indicated it is committed to building by 2117. Credit: Ville Ericsson

Elon Musk has been rather outspoken in recent years about his plan to create a human settlement on Mars. Stressing the need for a “backup location” for humanity, he has dedicated his company (SpaceX) to the creation of a reusable spacecraft (aka. the Interplanetary Transport System) that in the coming decades will be able to transport one-hundred people at a time to Mars.

In addition to Musk, Dutch entrepreneur Bas Lansdorp has also expressed an interest in creating a permanent settlement on Mars. In 2012, he founded MarsOne with the intent of developing the necessary expertise to mount one-way trips to the Red Planet by 2032. And according to an announcement from the government of Dubai, it seems they aren’t the only ones looking to colonize the Red Planet.

The announcement came on February 14th, 2017, during the 5th World Government Summit – which was held this year in Dubai. In the midst of presentations by notaries like Ban-Ki-Moon, Elon Musk, and Barack Obama, Sheikh Mohammed bin Rashid Al Maktoum and Sheikh Mohamed bin Zayed Al Nahyan shared their country’s vision of putting 600,000 humans on the Red Planet by the next century – known as the “Mars 2117 Project”.

In the course of his speech, Sheikh Mohammed emphasized the UAEs commitment to space sciences and its desire to accomplish one of the longest-held dreams of humanity:

“Human ambitions have no limits, and whoever looks into the scientific breakthroughs in the current century believes that human abilities can realize the most important human dream. The new project is a seed that we plant today, and we expect future generations to reap the benefits, driven by its passion to learn to unveil a new knowledge. The landing of people on other planets has been a longtime dream for humans. Our aim is that the UAE will spearhead international efforts to make this dream a reality.”

As growing investors in the field of space research, Sheikh Mohammed indicated that this project will accelerate the UAE’s commitment in this regard. Recent accomplishments by the Emirati space program include the successful deployment of the UAE’s first nanosatellite – Nayif-1 – which was launched a day after the Mars 2117 announcement (Feb. 15th, 2017).

This nanosatellite was the result of collaborative work between the Mohammed bin Rashid Space Centre (MBRSC) and the American University of Sharjah (AUS). Its intended purpose is to provide opportunities and hands-on experience for Emirati engineering students, as well as developing expertise in the designing, building, testing and operating of nanosatellites.

And then there’s the Hope Spacecraft, a project which was commissioned in 2015 by the Emirates Mars Mission. This project calls for the creation of a compact, hexagonal spacecraft that will reach the Red planet by 2021 and spend the next two years studying its atmosphere and weather. Not only is this mission designed to provide the first truly global picture of the Martian atmosphere, it will also be the first orbiter deployed by an Arab country.

Meanwhile, Sheikh Mohamed bin Zayed – the Crown Prince of Abu Dhabi and the Deputy Supreme Commander of the UAE Armed Forces – said that the objective of the project is to develop the skills and capacities of the UAE’s space program. He also indicates that the project will benefit research institutions and advance the fields of transportation, energy and food production here on Earth.

“The Mars 2117 Project is a long term project, where our first objective is to develop our educational system so our sons will be able to lead scientific research across the various sectors,” he said. “The UAE became part of a global scientific drive to explore space, and we hope to serve humanity through this project.”

Elements of the project were showcased at the Summit by a team of Emirati engineers, scientists and researchers – which included a concept for a human city that would be built by robots. It also showcased aspects of the inhabitants’ lifestyle, like the transportation they would use, how they would generate power, how they would grow food, the infrastructure they would build, and the materials that would be used to construct the colony.

An artist's illustration of a Mars settlement. Image: Bryan Versteeg/MarsOne
An artist’s illustration of an early Mars settlement. Credit: Bryan Versteeg/MarsOne

Given the long-term nature of this project, it will be broken down into multiple phases that will take place over the next few decades. Phase One will focus on preparing the scientists who will attempt to address all the challenges and concerns of sending human beings on a one-way trip to Mars. At the same time, the project calls for the creation of an Emiratis science team that will work with the international scientific community to speed up the research efforts.

Particular areas of concern will include creating spacecraft that are fast enough to ferry people to and from Earth in a respectable time frame. Then there’s the task of creating a working model of what the settlement will look like, and how the needs of its inhabitants will be met. Naturally, this will include methods for growing food and seeing to the health, safety, transportation, and energy needs of the colonists.

In the future, the UAE also anticipates that uncrewed missions will be mounted to explore the surface of Mars and locate a possible site for the future colony. In short, they are not only joining the “Mars or Bust” club, but also the international community of space explorers.

Further Reading: Government of Dubai

Sad About Pluto? How about 110 Planets in the Solar System Instead?

Montage of every round object in the solar system under 10,000 kilometers in diameter, to scale. Credit: Emily Lakdawalla/data from NASA /JPL/JHUAPL/SwRI/SSI/UCLA/MPS/DLR/IDA/Gordan Ugarkovic/Ted Stryk, Bjorn Jonsson/Roman Tkachenko. Source

In 2006, during their 26th General Assembly, the International Astronomical Union (IAU) adopted a formal definition of the term “planet”. This was done in the hopes of dispelling ambiguity over which bodies should be designated as “planets”, an issue that had plagued astronomers ever since they discovered objects beyond the orbit of Neptune that were comparable in size to Pluto.

Needless to say, the definition they adopted resulted in fair degree of controversy from the astronomical community. For this reason, a team of planetary scientists – which includes famed “Pluto defender” Alan Stern – have come together to propose a new meaning for the term “planet”. Based on their geophysical definition, the term would apply to over 100 bodies in the Solar System, including the Moon itself.

The current IAU definition (known as Resolution 5A) states that a planet is defined based on the following criteria:

“(1) A “planet” is a celestial body that (a) is in orbit around the Sun, (b) has sufficient mass for its self-gravity to overcome rigid body forces so that it assumes a hydrostatic equilibrium (nearly round) shape, and (c) has cleared the neighbourhood around its orbit.

(2) A “dwarf planet” is a celestial body that (a) is in orbit around the Sun, (b) has sufficient mass for its self-gravity to overcome rigid body forces so that it assumes a hydrostatic equilibrium (nearly round) shape , (c) has not cleared the neighbourhood around its orbit, and (d) is not a satellite.

(3) All other objects , except satellites, orbiting the Sun shall be referred to collectively as “Small Solar-System Bodies”

Results of a study combining Kepler observations with Herschel data show that 2007 OR10 is the largest unnamed dwarf planet in our Solar System, and the third largest overall. Illustration: Konkoly Observatory/András Pál, Hungarian Astronomical Association/Iván Éder, NASA/JHUAPL/SwRI
The dwarf planets of the Solar System, arranged according to size. Credit: Konkoly Observatory/András Pál, Hungarian Astronomical Association/Iván Éder, NASA/JHUAPL/SwRI

Because of these qualifiers, Pluto was no longer considered a planet, and became known alternately as a “dwarf planet”, Plutiod, Plutino, Trans-Neptunian Object (TNO), or Kuiper Belt Object (KBO). In addition, bodies like Ceres, and newly discovered TNOs like Eris, Haumea, Makemake and the like, were also designated as “dwarf planets”. Naturally, this definition did not sit right with some, not the least of which are planetary geologists.

Led by Kirby Runyon – a final year PhD student from the Department of Earth and Planetary Sciences at Johns Hopkins University – this team includes scientists from the Southwest Research Institute (SwRI) in Boulder, Colorado; the National Optical Astronomy Observatory in Tuscon, Arizona; the Lowell Observatory in Flagstaff, Arizona; and the Department of Physics and Astronomy at George Mason University.

Their study – titled “A Geophysical Planet Definition“, which was recently made available on the Universities Space Research Association (USRA) website – addresses what the team sees as a need for a new definition that takes into account a planet’s geophysical properties. In other words, they believe a planet should be so-designated based on its intrinsic properties, rather than its orbital or extrinsic properties.

From this more basic set of parameters, Runyon and his colleagues have suggested the following definition:

“A planet is a sub-stellar mass body that has never undergone nuclear fusion and that has sufficient self-gravitation to assume a spheroidal shape adequately described by a triaxial ellipsoid regardless of its orbital parameters.”

The most iconic image from the New Horizon’s July 2015 flyby, showing Pluto’s ‘heart.’ Credit: NASA/JHUAPL/SwRI.

As Runyon told Universe Today in a phone interview, this definition is an attempt to establish something that is useful for all those involved in the study of planetary science, which has always included geologists:

“The IAU definition is useful to planetary astronomers concerned with the orbital properties of bodies in the Solar System, and may capture the essence of what a ‘planet’ is to them. The definition is not useful to planetary geologists. I study landscapes and how landscapes evolve. It also kind of irked me that the IAU took upon itself to define something that geologists use too.

“The way our brain has evolved, we make sense of the universe by classifying things. Nature exists in a continuum, not in discrete boxes. Nevertheless, we as humans need to classify things in order to bring order out of chaos. Having a definition of the word planet that expresses what we think a planet ought to be, is concordant with this desire to bring order out of chaos and understand the universe.”

The new definition also attempts to tackle many of the more sticky aspects of the definition adopted by the IAU. For example, it addresses the issue of whether or not a body orbits the Sun – which does apply to those found orbiting other stars (i.e. exoplanets). In addition, in accordance with this definition, rogue planets that have been ejected from their solar systems are technically not planets as well.

And then there’s the troublesome issue of “neighborhood clearance”. As has been emphasized by many who reject the IAU’s definition, planets like Earth do not satisfy this qualification since new small bodies are constantly injected into planet-crossing orbits – i..e Near-Earth Objects (NEOs). On top of that, this proposed definition seeks to resolve what is arguably one of the most regrettable aspects of the IAU’s 2006 resolution.

Artist’s impression of the planet Proxima b orbiting the red dwarf star Proxima Centauri, the closest star to the Solar System. Credit: ESO/M. Kornmesser

“The largest motivation for me personally is: every time I talk about this to the general public, the very next thing people talk about is ‘Pluto is not a planet anymore’,” said Runyon. “People’s interest in a body seems tied to whether or not it has the name ‘planet’ labelled on it. I want to set straight in the mind of the public what a planet is. The IAU definition doesn’t jive with my intuition and I find it doesn’t jive with other people‘s intuition.”

The study was prepared for the upcoming 48th Lunar and Planetary Science Conference. This annual conference – which will be taking place this year from March 20th-24th at the Universities Space Research Association in Houston, Texas – will involve specialists from all over the worlds coming together to share the latest research findings in planetary science.

Here, Runyon and his colleagues hope to present it as part of the Education and Public Engagement Event. It is his hope that through an oversized poster, which is a common education tool at Lunar and Planetary Science Conference, they can show how this new definition will facilitate the study of the Solar System’s many bodies in a way that is more intuitive and inclusive.

“We have chosen to post this in a section of the conference dedicated to education,” he said. “Specifically, I want to influence elementary school teachers, grades K-6, on the definitions that they can teach their students. This is not the first time someone has proposed a definition other than the one proposed by the IAU. But few people have talked about education. They talk among their peers and little progress is made. I wanted to post this in a section to reach teachers.”

In accordance with the definition proposed by Runyon, bodies like Ceres and even the moon would be considered “planets”. Credit: NASA/ JPL/Planetary Society/Justin Cowart

Naturally, there are those who would raise concerns about how this definition could lead to too many planets. If intrinsic property of hydrostatic equilibrium is the only real qualifier, then large bodies like Ganymede, Europa, and the Moon would also be considered planets. Given that this definition would result in a Solar System with 110 “planets”, one has to wonder if perhaps it is too inclusive. However, Runyon is not concerned by these numbers.

“Fifty states is a lot to memorize, 88 constellations is a lot to memorize,” he said. “How many stars are in the sky? Why do we need a memorable number? How does that play into the definition? If you understand the periodic table to be organized based on the number of protons, you don’t need to memorize all the atomic elements. There’s no logic to the IAU definition when they throw around the argument that there are too many planets in the Solar System.”

Since its publication, Runyon has also been asked many times if he intends to submit this proposal to the IAU for official sanction. To this, Runyon has replied simply:

“No. Because the assumption there is that the IAU has a corner on the market on what a definition is. We in the planetary science field don’t need the IAU definition. The definition of words is based partly on how they are used. If [the geophysical definition] is the definition that people use and what teachers teach, it will become the de facto definition, regardless of how the IAU votes in Prague.”

Regardless of where people fall on the IAU’s definition of planet (or the one proposed by Runyon and his colleagues) it is clear that the debate is far from over. Prior to 2006, there was no working definition of the term planet; and new astronomical bodies are being discovered all the time that put our notions of what constitutes a planet to the test.  In the end, it is the process of discovery which drives classification schemes, and not the other way around.

Further Reading: USRA

Image Source: Planetary Society