NASA Proposes a Magnetic Shield to Protect Mars’ Atmosphere

Artist's conception of a terraformed Mars. Credit: Ittiz/Wikimedia Commons

This week, NASA’s Planetary Science Division (PSD) hosted a community workshop at their headquarters in Washington, DC. Known as the “Planetary Science Vision 2050 Workshop“, this event ran from February 27th to March 1st, and saw scientists and researchers from all over the world descend on the capitol to attend panel discussions, presentations, and talks about the future of space exploration.

One of the more intriguing presentations took place on Wednesday, March 1st, where the exploration of Mars by human astronauts was discussed. In the course of the talk, which was titled “A Future Mars Environment for Science and Exploration“, Director Jim Green discussed how deploying a magnetic shield could enhance Mars’ atmosphere and facilitate crewed missions there in the future.

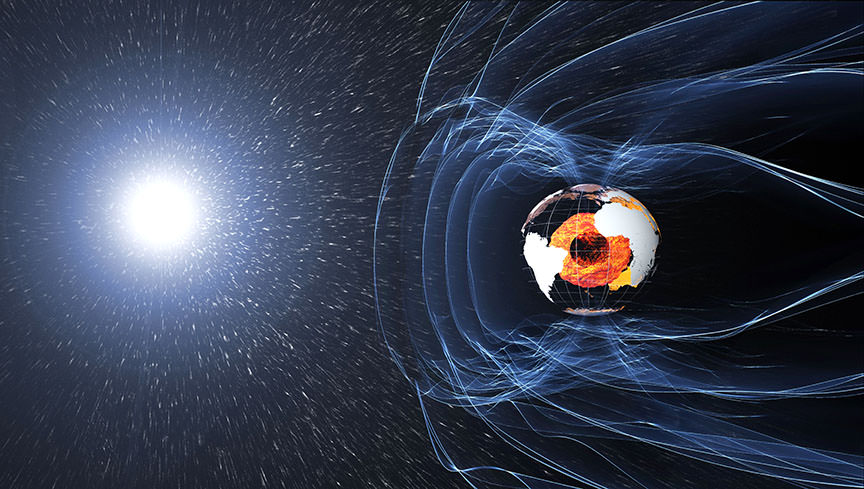
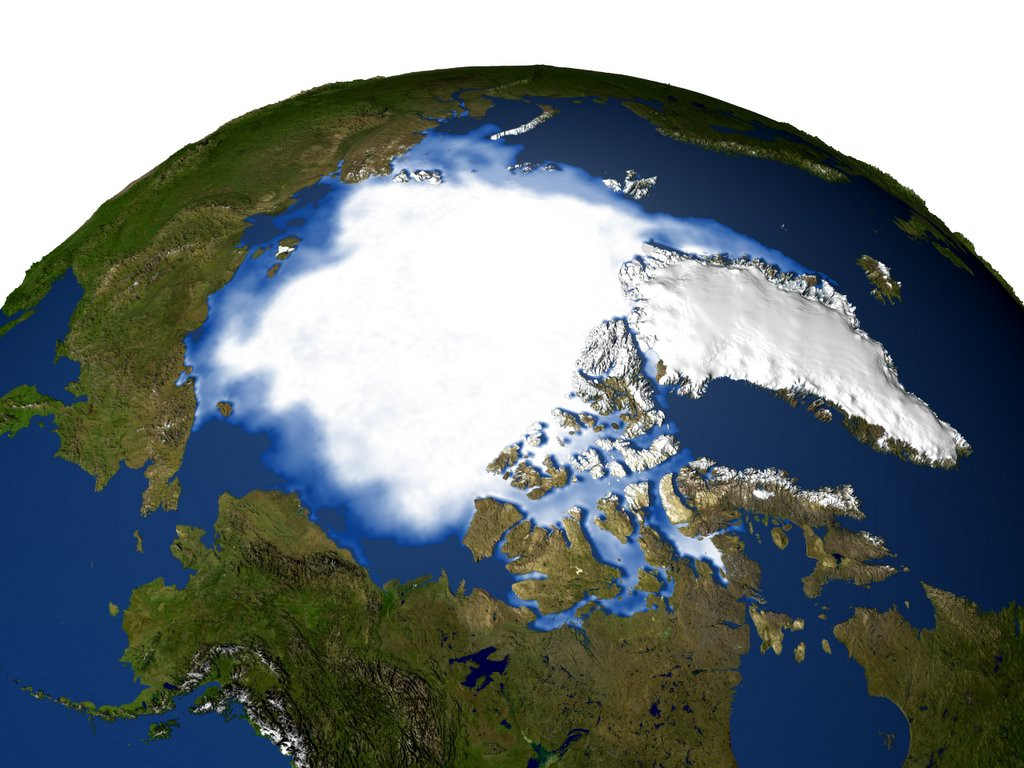
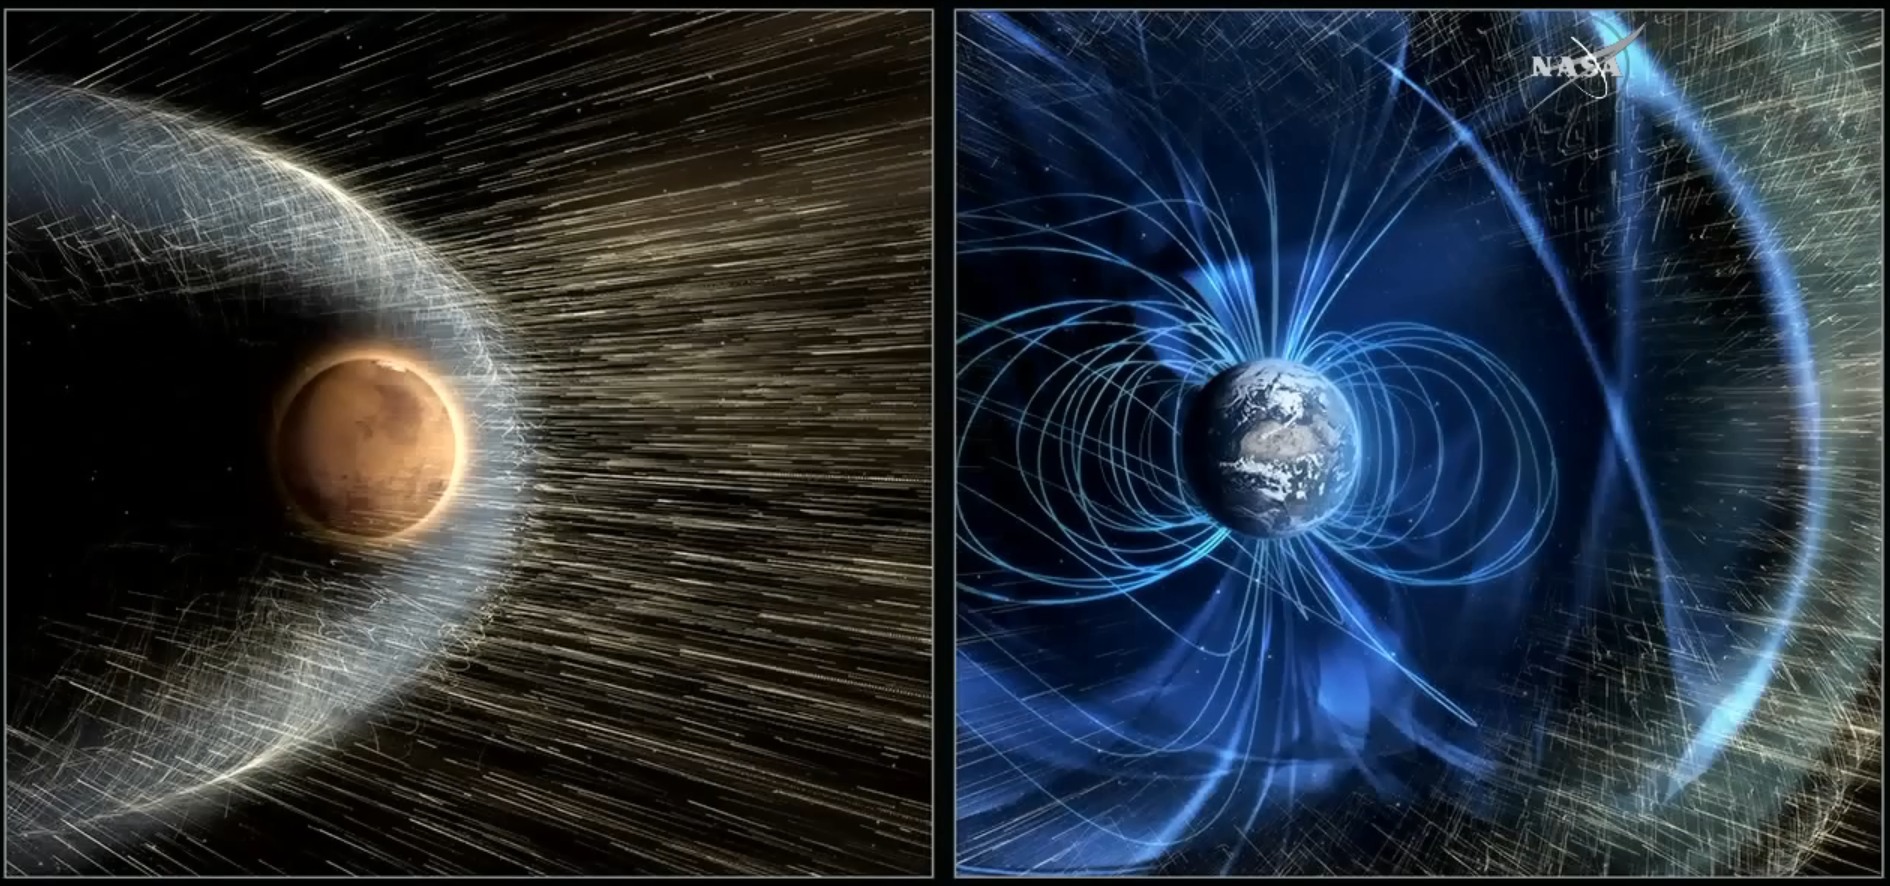
The current scientific consensus is that, like Earth, Mars once had a magnetic field that protected its atmosphere. Roughly 4.2 billion years ago, this planet’s magnetic field suddenly disappeared, which caused Mars’ atmosphere to slowly be lost to space. Over the course of the next 500 million years, Mars went from being a warmer, wetter environment to the cold, uninhabitable place we know today.

Artist’s rendering of a solar storm hitting Mars and stripping ions from the planet’s upper atmosphere. Credits: NASA/GSFC

This theory has been confirmed in recent years by orbiters like the ESA’s Mars Express and NASA’s Mars Atmosphere and Volatile EvolutioN Mission (MAVEN), which have been studying the Martian atmosphere since 2004 and 2014, respectively. In addition to determining that solar wind was responsible for depleting Mars’ atmosphere, these probes have also been measuring the rate at which it is still being lost today.

Without this atmosphere, Mars will continue to be a cold, dry place where life cannot flourish. In addition to that, future crewed mission – which NASA hopes to mount by the 2030s – will also have to deal with some severe hazards. Foremost among these will be exposure to radiation and the danger of asphyxiation, which will pose an even greater danger to colonists (should any attempts at colonization be made).

In answer to this challenge, Dr. Jim Green – the Director of NASA’s Planetary Science Division – and a panel of researchers presented an ambitious idea. In essence, they suggested that by positioning a magnetic dipole shield at the Mars L1 Lagrange Point, an artificial magnetosphere could be formed that would encompass the entire planet, thus shielding it from solar wind and radiation.

Naturally, Green and his colleagues acknowledged that the idea might sounds a bit “fanciful”. However, they were quick to emphasize how new research into miniature magnetospheres (for the sake of protecting crews and spacecraft) supports this concept:

“This new research is coming about due to the application of full plasma physics codes and laboratory experiments. In the future it is quite possible that an inflatable structure(s) can generate a magnetic dipole field at a level of perhaps 1 or 2 Tesla (or 10,000 to 20,000 Gauss) as an active shield against the solar wind.”

The proposed method for creating an artificial magnetic dipole at Mars’ L1 Lagrange Point. Credit: NASA/J.Green

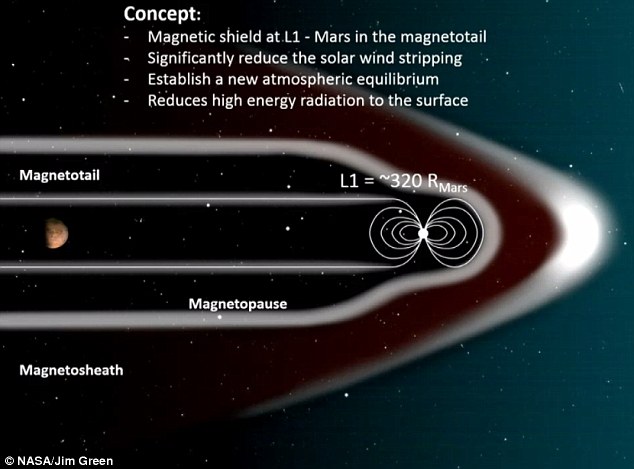
In addition, the positioning of this magnetic shield would ensure that the two regions where most of Mars’ atmosphere is lost would be shielded. In the course of the presentation, Green and the panel indicated that these the major escape channels are located, “over the northern polar cap involving higher energy ionospheric material, and 2) in the equatorial zone involving a seasonal low energy component with as much as 0.1 kg/s escape of oxygen ions.”

To test this idea, the research team – which included scientists from Ames Research Center, the Goddard Space Flight Center, the University of Colorado, Princeton University, and the Rutherford Appleton Laboratory – conducted a series of simulations using their proposed artificial magnetosphere. These were run at the Coordinated Community Modeling Center (CCMC), which specializes in space weather research, to see what the net effect would be.

What they found was that a dipole field positioned at Mars L1 Lagrange Point would be able to counteract solar wind, such that Mars’ atmosphere would achieve a new balance. At present, atmospheric loss on Mars is balanced to some degree by volcanic outpassing from Mars interior and crust. This contributes to a surface atmosphere that is about 6 mbar in air pressure (less than 1% that at sea level on Earth).

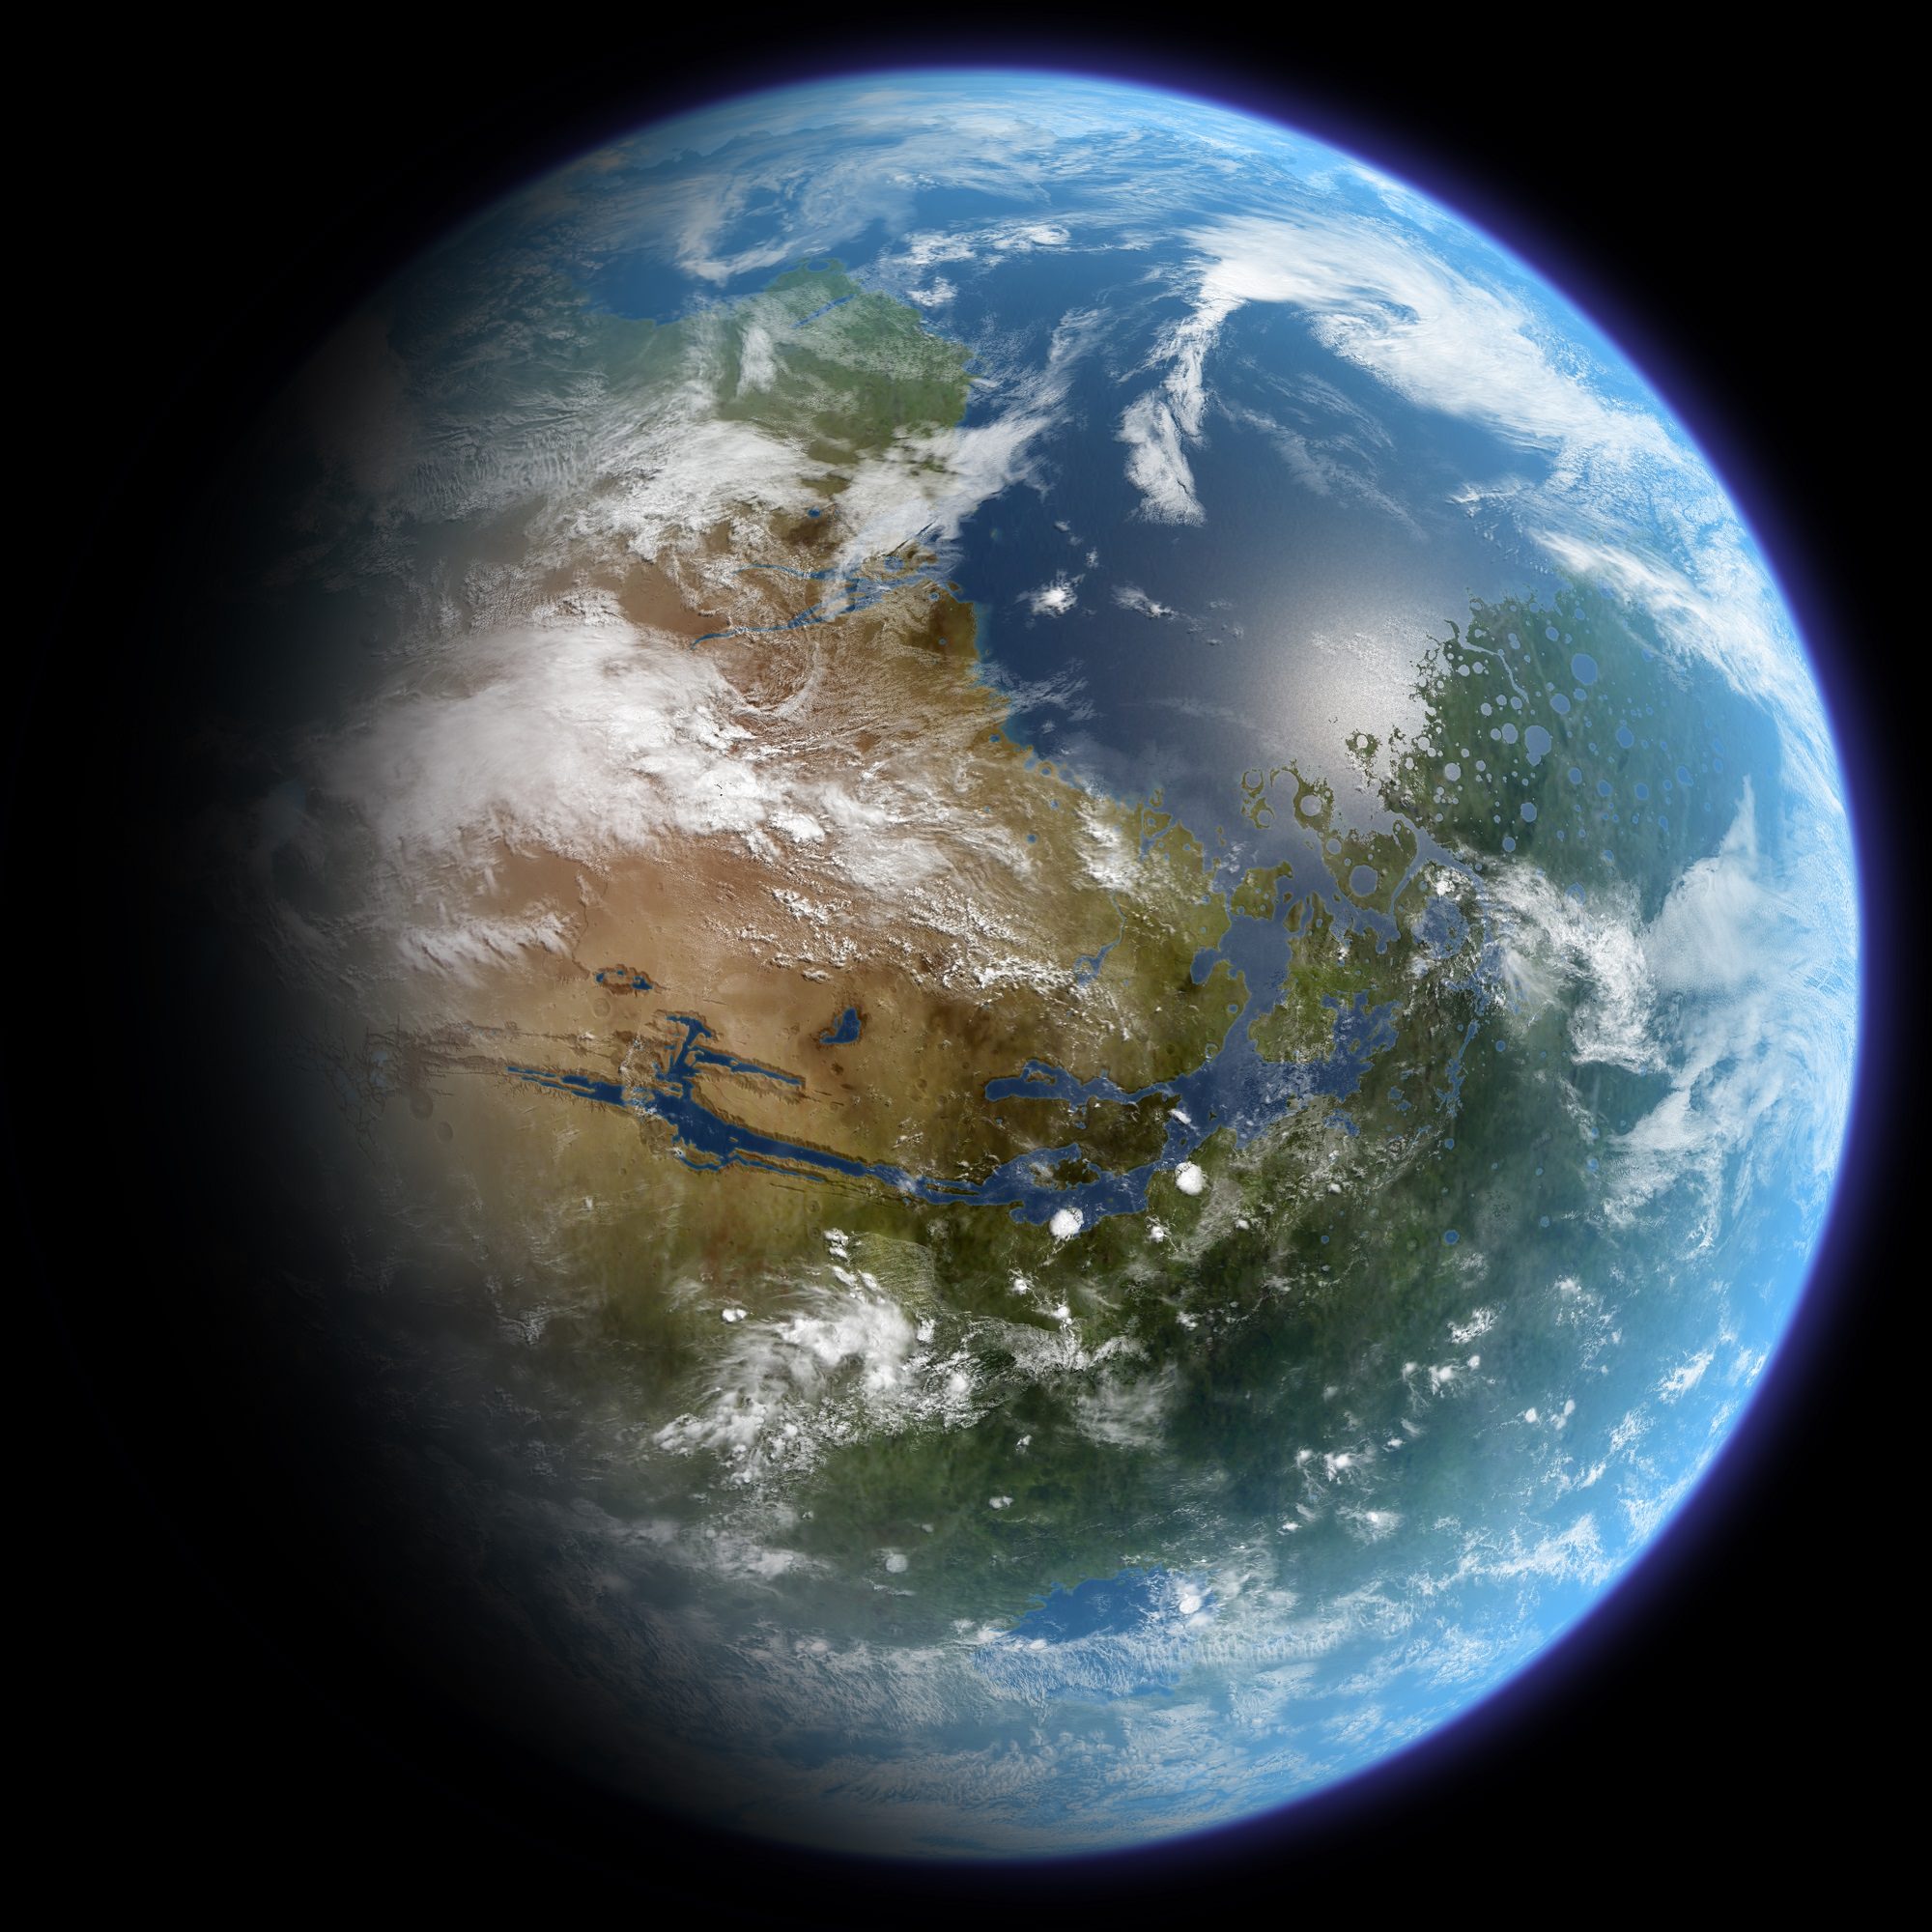
As a result, Mars atmosphere would naturally thicken over time, which lead to many new possibilities for human exploration and colonization. According to Green and his colleagues, these would include an average increase of about 4 °C (~7 °F), which would be enough to melt the carbon dioxide ice in the northern polar ice cap. This would trigger a greenhouse effect, warming the atmosphere further and causing the water ice in the polar caps to melt.

At one time, Mars had a magnetic field similar to Earth, which prevented its atmosphere from being stripped away. Credit: NASA

By their calculations, Green and his colleagues estimated that this could lead to 1/7th of Mars’ oceans – the ones that covered it billions of years ago – to be restored. If this is beginning to sound a bit like a lecture on how to terraform Mars, it is probably because these same ideas have been raised by people who advocating that very thing. But in the meantime, these changes would facilitate human exploration between now and mid-century.

“A greatly enhanced Martian atmosphere, in both pressure and temperature, that would be enough to allow significant surface liquid water would also have a number of benefits for science and human exploration in the 2040s and beyond,” said Green. “Much like Earth, an enhanced atmosphere would: allow larger landed mass of equipment to the surface, shield against most cosmic and solar particle radiation, extend the ability for oxygen extraction, and provide “open air” greenhouses to exist for plant production, just to name a few.”

These conditions, said Green and his colleagues, would also allow for human explorers to study the planet in much greater detail. It would also help them to determine the habitability of the planet, since many of the signs that pointed towards it being habitable in the past (i.e. liquid water) would slowly seep back into the landscape. And if this could be achieved within the space of few decades, it would certainly help pave the way for colonization.

In the meantime, Green and his colleagues plan to review the results of these simulations so they can produce a more accurate assessment of how long these projected changes would take. It also might not hurt to conduct some cost-assessments of this magnetic shield. While it might seem like something out of science fiction, it doesn’t hurt to crunch the numbers!

Stay tuned for more stories from the Planetary Science Vision 2050 Workshop!

Further Reading: USRA

When Galaxies Collide, Stars Suffer the Consequences

An artist's depiction of the tidal disruption event in F01004-2237. The release of gravitational energy as the debris of the star is accreted by the black hole leads to a flare in the optical light of the galaxy. Credit and copyright: Mark Garlick.

When galaxies collide, the result is nothing short of spectacular. While this type of event only takes place once every few billion years (and takes millions of years to complete), it is actually pretty common from a cosmological perspective. And interestingly enough, one of the most impressive consequences – stars being ripped apart by supermassive black holes (SMBHs) – is quite common as well.

This process is known in the scientific community as stellar cannibalism, or Tidal Disruption Events (TDEs). Until recently, astronomers believed that these sorts of events were very rare. But according to a pioneering study conducted by leading scientists from the University of Sheffield, it is actually 100 times more likely than astronomers previously suspected.

TDEs were first proposed in 1975 as an inevitable consequence of black holes being present at the center of galaxies. When a star passes close enough to be subject to the tidal forces of a SMBH it undergoes what is known as “spaghetification”, where material is slowly pulled away and forms string-like shapes around the black hole. The process causes dramatic flare ups that can be billions of times brighter than all the stars in the galaxy combined.

Since the gravitational force of black holes is so strong that even light cannot escape their surfaces (thus making them invisible to conventional instruments), TDEs can be used to locate SMBHs at the center of galaxies and study how they accrete matter. Previously, astronomers have relied on large-area surveys to determine the rate at which TDEs happen, and concluded that they occur at a rate of once every 10,000 to 100,000 years per galaxy.

However, using the William Herschel Telescope at the Roque de los Muchachos Observatory on the island of La Palma, the team of scientists – who hail from Sheffield’s Department of Physics and Astronomy – conducted a survey of 15 ultra-luminous infrared galaxies that were undergoing galactic collisions. When comparing information on one galaxy that had been observed twice over a ten year period, they noticed that a TDE was taking place.

Their findings were detailed in a study titled “A tidal disruption event in the nearby ultra-luminous infrared galaxy F01004-2237“, which appeared recently in the journal Nature: Astronomy. As Dr James Mullaney, a Lecturer in Astronomy at Sheffield and a co-author of the study, said in a University press release:

“Each of these 15 galaxies is undergoing a ‘cosmic collision’ with a neighboring galaxy. Our surprising findings show that the rate of TDEs dramatically increases when galaxies collide. This is likely due to the fact that the collisions lead to large numbers of stars being formed close to the central supermassive black holes in the two galaxies as they merge together.”

The William Herschel Telescope, part of the Isaac Newton group of telescopes, located in the Canary Islands. Credit: ing.iac.es

The Sheffield team first observed these 15 colliding galaxies in 2005 during a previous survey. However, when they observed them again in 2015, they noticed that one of the galaxies in the sample – F01004-2237 – appeared to have undergone some changes. The team them consulted data from the Hubble Space Telescope and the Catalina Sky Survey – which monitors the brightness of astronomical objects (particularly NEOs) over time.

What they found was that the brightness of F01004-2237 – which is about 1.7 billion light years from Earth – had changed dramatically. Ordinarily, such flare ups would be attributed to a supernova or matter being accreted onto an SMBH at the center (aka. an active galactic nucleus). However, the nature of this flare up (which showed unusually strong and broad helium emission lines in its post-flare spectrum) was more consistent with a TDE.

The appearance of such an event had been detected during a repeat spectroscopic observations of a sample of 15 galaxies over a period of just 10 years suggested that the rate at which TDEs happen was far higher than previously thought – and by a factor of 100 no less. As Clive Tadhunter, a Professor of Astrophysics at the University of Sheffield and lead author of the study, said:

“Based on our results for F01004-2237, we expect that TDE events will become common in our own Milky Way galaxy when it eventually merges with the neighboring Andromeda galaxy in about 5 billion years. Looking towards the center of the Milky Way at the time of the merger we’d see a flare approximately every 10 to 100 years. The flares would be visible to the naked eye and appear much brighter than any other star or planet in the night sky.”

Credit: ESA/Hubble, ESO, M. Kornmesser
Artist’s impression depicts a rapidly spinning supermassive black hole surrounded by an accretion disc. Credit: ESA/Hubble, ESO, M. Kornmesse

In the meantime, we can expect that TDEs are likely to be noticed in other galaxies within our own lifetimes. The last time such an event was witnessed directly was back in 2015, when the All-Sky Automated Survey for Supernovae (aka. ASAS-SN, or Assassin) detected a superlimunous event four billion light years away – which follow-up investigations revealed was a star being swallowed by a spinning SMBH.

Naturally, news of this was met with a fair degree of excitement from the astronomical community, since it was such a rare event. But if the results of this study are any indication, astronomers should be noticing plenty more stars being slowly ripped apart in the not-too-distant future.

With improvements in instrumentation, and next-generation instruments like the James Webb Telescope being deployed in the coming years, these rare and extremely picturesque events may prove to be a more common experience.

Further Reading: Nature: Astronomy, University of Sheffield

Some Active Process is Cracking Open These Faults on Mars. But What is it?

A 2008 image showing a portion of the North Polar layered deposits with lines of very small pits. Credit: NASA/JPL/University of Arizona

Mars has many characteristics that put one in mind of Earth. Consider its polar ice caps, which are quite similar to the ones in the Arctic and Antarctic circle. But upon closer examination, Mars’ icy polar regions have numerous features that hint at some unusual processes. Consider the northern polar ice cap, which consists predominantly of frozen water ice, but also a seasonal veneer of frozen carbon dioxide (“dry ice”).

Here, ice is arranged in multicolored layers that are due to seasonal change and weather patterns. And as images taken by the Mars Global Surveyor and the Mars Reconnaissance Orbiter (MRO) have shown, the region is also covered in lines of small pits that measure about 1 meter (3.28 feet) in diameter. While these features have been known to scientists for some time, the process behind them remains something of a mystery.

Layered features around found both in the northern and southern polar regions of Mars, and are the result of seasonal melting and the deposition of ice and dust (from Martian dust storms). Both polar caps also show grooves which appear to be influenced by the amount of dust deposited. The more dust there is, the darker the surface of the grooved feature, which affects the level of seasonal melting that takes place.

HiRISE image showing the layered appearance of Mars’ northern polar region. Credit: NASA/JPL/University of Arizona

These layered deposits measure around 3-kilometer thick and about 1000 kilometers across. And in many locations, erosion and melting has created scarps and troughs that expose the layering (shown above). However, as NASA’s Mars Global Surveyor revealed through a series of high-resolution images, the northern polar cap also has plenty of pits, cracks, small bumps and knobs that give it a strange, textured look.

These featured have also been imaged in detail by the High Resolution Imaging Science Experiment (HiRISE) instrument aboard the MRO. In 2008, it snapped the image shown at top, which illustrates how the layered features in the northern polar region also have lines of small pits cutting across them. Such small pits should be quickly filled in by seasonal ice and dust, so their existence has been something of a mystery.

What this process could be has been the preoccupation of researchers like Doctor Chris Okubo and Professor Alfred McEwen. In addition to being a planetary geologist from the Lunar and Planetary Laboratory (LPL) at Arizona State University, Prof. McEwen is the Principal Investigator of the High Resolution Imaging Science Experiment (HiRISE).

Dr. Chris Okubo, meanwhile, is a planetary engineer with the LPL who has spent some time examining Mars’ northern polar region, seeking to determine what geological process could account for them. Over time, he also noted that the pits appeared to be enlarging. As he explained to Universe Today via email:

“I monitored some of these pits during northern summer of Mars year 31 (2011-2012). The pits appeared to enlarge over time, starting from depressions roughly centered on the pits observed in in  2008. My interpretation is that these pits are depressions within the residual cap that formed through collapse above a fault or fracture. The pits are buried by seasonal ice in the winter, which then sublimates in the spring/summer leading to an apparent widening and exposure of the pits until they are reburied by seasonal ice in the subsequent winter.”

HiRISE being prepared before it is shipped for attachment to the spacecraft. Credit: NASA/JPL

Since the MRO reached Mars in 2006, the LPL has been responsible for processing and interpreting images sent back by its HiRISE instrument. As for these pits, the theory that they are the result of faults pulling apart the icy layers is the most currently-favored one. Naturally, it will have to be tested as more data comes, in showing how seasonal changes play out in Mars’ northern polar region.

“I  plan to re-monitor the same pits I looked at in MY31 during this upcoming northern summer to see if this pattern has changed substantially,” said Okubo. “Re-imaging these after several Mars years may also reveal changes to the size/distribution of the pits within the residual cap – if such changes are observed, then that would suggest that the underlying fractures are active.”

One thing is clear though; the layered appearance of Mars polar ice caps and its strange surface features are just another indication of the dynamic processes taking place on Mars. In addition to seasonal change, these interesting features are thought to be related to changes in Mars’ obliquity and axial tilt. Just one more way in which Mars and Earth are similar!

Further Reading: HIRISE

Volcanic Hydrogen Gives Planets a Boost for Life

Image of the Sarychev volcano (in Russia's Kuril Islands) caught during an early stage of eruption on June 12, 2009. Taken by astronauts aboard the International Space Station. Credit: NASA

Whenever the existence of an extra-solar planet is confirmed, there is reason to celebrate. With every new discovery, humanity increases the odds of finding life somewhere else in the Universe. And even if that life is not advanced enough (or particularly inclined) to build a radio antenna so we might be able to hear from them, even the possibility of life beyond our Solar System is exciting.

Unfortunately, determining whether or not a planet is habitable is difficult and subject to a lot of guesswork. While astronomers use various techniques to put constraints on the size, mass, and composition of extra-solar planets, there is no surefire way to know if these worlds are habitable. But according to a new study from a team of astronomers from Cornell University, looking for signs of volcanic activity could help.

Their study – titled “A Volcanic Hydrogen Habitable Zone” – was recently published in The Astrophysical Journal Letters. According to their findings, the key to zeroing in on life on other planets is to look for the telltale signs of volcanic eruptions – namely, hydrogen gas (H²). The reason being is that this, and the traditional greenhouse gases, could extend the habitable zones of stars considerably.

The habitable zones of three stars detected by the Kepler mission. Credit: NASA/Ames/JPL-Caltech

As Ramses Ramirez, a research associate at Cornell’s Carl Sagan Institute and the lead author of the study, said in a University press release:

“On frozen planets, any potential life would be buried under layers of ice, which would make it really hard to spot with telescopes. But if the surface is warm enough – thanks to volcanic hydrogen and atmospheric warming – you could have life on the surface, generating a slew of detectable signatures.”

Planetary scientists theorize that billions of years ago, Earth’s early atmosphere had an abundant supply of hydrogen gas (H²) due to volcanic outgassing. Interaction between hydrogen and nitrogen molecules in this atmosphere are believed to have kept the Earth warm long enough for life to develop. However, over the next few million years, this hydrogen gas escaped into space.

This is believed to be the fate of all terrestrial planets, which can only hold onto their planet-warming hydrogen for so long. But according to the new study, volcanic activity could change this. As long as they are active, and their activity is intense enough, even planets that are far from their stars could experience a greenhouse effect that would be sufficient to keep their surfaces warm.

Distant exoplanets that are not in the traditional “Goldilocks Zone” might be habitable, assuming they have enough volcanic activity. Credit: ESO.

Consider the Solar System. When accounting for the traditional greenhouse effect caused by nitrogen gas (N²), carbon dioxide and water, the outer edge of our Sun’s habitable zone extends to a distance of about 1.7 AU – just outside the orbit of Mars. Beyond this, the condensation and scattering of CO² molecules make a greenhouse effect negligible.

However, if one factors in the outgassing of sufficient levels of H², that habitable zone can extend that outer edge to about 2.4 AUs. At this distance, planets that are the same distance from the Sun as the Asteroid Belt would theoretically be able to sustain life – provided enough volcanic activity was present. This is certainly exciting news, especially in light of the recent announcement of seven exoplanets orbiting the nearby TRAPPIST-1 star.

Of these planets, three are believed to orbit within the star’s habitable zone. But as Lisa Kaltenegger – also a member of the Carl Sagan Institute and the co-author on the paper – indicated, their research could add another planet to this
“potentially-habitable” lineup:

“Finding multiple planets in the habitable zone of their host star is a great discovery because it means that there can be even more potentially habitable planets per star than we thought. Finding more rocky planets in the habitable zone – per star – increases our odds of finding life… Although uncertainties with the orbit of the outermost Trappist-1 planet ‘h’ means that we’ll have to wait and see on that one.”

Artist’s concept of the TRAPPIST-1 star system, an ultra-cool dwarf that has seven Earth-size planets orbiting it. Credits: NASA/JPL-Caltech

Another upside of this study is that the presence of volcanically-produced hydrogen gas would be easy to detect by both ground-based and space-based telescopes (which routinely conduct spectroscopic surveys on distant exoplanets). So not only would volcanic activity increase the likelihood of there being life on a planet, it would also be relatively easy to confirm.

“We just increased the width of the habitable zone by about half, adding a lot more planets to our ‘search here’ target list,” said Ramirez. “Adding hydrogen to the air of an exoplanet is a good thing if you’re an astronomer trying to observe potential life from a telescope or a space mission. It increases your signal, making it easier to spot the makeup of the atmosphere as compared to planets without hydrogen.”

Already, missions like Spitzer and the Hubble Space Telescope are used to study exoplanets for signs of hydrogen and helium – mainly to determine if they are gas giants or rocky planets. But by looking for hydrogen gas along with other biosignatures (i.e. methane and ozone), next-generation instruments like the James Webb Space Telescope or the European Extremely Large Telescope, could narrow the search for life.

It is, of course, far too soon to say if this study will help in our search for extra-solar life. But in the coming years, we may find ourselves one step closer to resolving that troublesome Fermi Paradox!

Further Reading: Astrophysical Journal Letters

How Far is Mercury from the Sun?

Transiting
NASA's Hinode X-ray telescope captured Mercury in transit against the Sun's corona in Nov. 2006. Similar views are possible in H-alpha light. Credit: NASA

Mercury is famously known for being a scorching hot world. On the side that is facing towards the Sun, conditions can get pretty molten, reaching temperatures of up to 700 K (427 °C; 800°F) in the equatorial region. The surface is also airless, in part because any atmosphere it could generate would be blown away by solar wind. Hardly surprising, considering it is the closest planet to our Sun.

But just how close is it? On average, it’s slightly more than one-third the distance between Earth and the Sun. However, its orbital eccentricity is also the greatest of any planet in the Solar System. In addition, its orbit is subject to perturbations, ones which were not fully understood until the 20th century. Because of this, Mercury goes through some serious changes during its orbital period.

Perihelion and Aphelion:

Mercury orbits the Sun at an average distance (semi-major axis) of 0.387 AU (57,909,050 km; 35,983,015 mi). However, due to its eccentricity of 0.205 – the highest in the Solar System, with the exception of Pluto (0.248) – its distance from the Sun ranges considerably. When it is at its closest (perihelion), it is 46,001,200 km (28,583,820 mi) from the Sun; and when it is farthest away (aphelion), it is 57,909,050 km (35,983,015 mi) from the Sun.

A timelapse of Mercury transiting across the face of the Sun. Credit: NASA

Orbital Resonance:

At one time, scientists believed that Mercury was tidally-locked, meaning that it kept one side facing towards the Sun at all times. However, it has since been discovered that the planet actually has a slow rotational period of 58.646 days. Compared to its orbital period of 88 days, this means that Mercury has a spin-orbit resonance of 3:2. This means that the planet makes three completes rotations on its axis for every two orbits around the Sun.

Another consequences of its spin-orbit resonance is that there is a significance difference between the time it takes the planet to rotate once on its axis (a sidereal day) and the time it takes for the Sun to reappear in the same place in the sky (a solar day). On Mercury, it takes a 176 days for the Sun to rise, set, and return to the same place in the sky. This means, effectively, that a single day on Mercury lasts as long as two years!

It’s slow rotation also means that temperature variations are extreme. On the Sun-facing side, temperatures can reach as high as 700 K (427 °C; 800°F) in the equatorial region and 380 K (107 °C; 224 °F) near the northern polar region. On the side facing away from the Sun, temperatures reach a low of 100 K (-173 °C; -280 °F) in the equatorial region and 80 K (-193 °C; -316 °F) near the northern polar region.

Diagram of Mercury’s eccentric orbit. Credit: solarviews.com

Perihelion Precession:

In addition to its eccentricity, Mercury’s perihelion is also subject to precession. What this means is, during the course of a century, Mercury’s orbit around the Sun shifts by 42.98 arcseconds (0.0119 degrees). This means that after twelve million orbits, Mercury will have performed a full excess turn around the Sun and returned to where it started.

This is much larger than the perihelion precession of other Solar planets – which range from 8.62 arcseconds (0.0024°) per century for Venus, 3.84 (0.001°) for Earth, and 1.35 (0.00037°) for Mars. Until the early 20th century, this behavior remained a mystery to astronomers, as Newtonian mechanics could not account for it. However, Einstein’s General Theory of Relativity provided an explanation, while the precession provided a test for his theory.

You might say Mercury and the Sun are pretty cozy. They dance pretty close, and the dance is powerful and full of some pretty wide swings!

We have written many interesting articles about the distance of the planets from the Sun here at Universe Today. Here’s How Far Are the Planets from the Sun?, How Far is Venus from the Sun?, How Far is Mars from the Sun?, How Far is the Earth from the Sun?, How Far is the Moon from the Sun?, How Far is Jupiter from the Sun?, How Far is Saturn from the Sun?, How Far is Uranus  from the Sun?, How Far is Neptune from the Sun? and How Far is Pluto from the Sun?

If you’d like more info on Mercury, check out NASA’s Solar System Exploration Guide, and here’s a link to NASA’s MESSENGER Misson Page.

We’ve also recorded an entire episode of Astronomy Cast all about Mercury. Listen here, Episode 49: Mercury.

Sources:

We’re Not Saying It’s Aliens Because It’s Not Aliens. But Check Out These UFO Data Visualizations

The number of UFO sightings per year, Credit: Sam Monfort

When it comes to conspiracy theories and modern preoccupations, few things are more popular than unidentified flying objects (UFOs) and alien abductions. For over half a century, there have been rumors, reports, and urban legends about aliens coming to Earth, dabbling with our genetics, and conducting weird (and often invasive) experiments on our citizens.

And while opinions on what drives this popular phenomenon tend to differ (some say hysteria, others that it is media-driven), a few things are clear. For one, sightings appear to take place far more in the United States than anywhere else in the world. And in recent years, these sightings have been on the rise!

Such are the conclusions of a series of visualizations based on the National UFO Reporting Center (NUFORC). Established in 1974 (and located in Davenport, Washington), the National UFO Reporting Center is “dedicated to the collection and dissemination of objective UFO data”. Since that time, they have been monitoring UFO sightings worldwide and have maintained careful logs about the 104,947 sightings that have taken place since 1905.

The geographic distribution of UFO sightings. Credit: sammonfort3

Using this data, Sam Monfort – a Doctoral Candidate from the department of Human Factors & Applied Cognition at George Mason University – produced a series of visuals that illustrate the history of UFO sightings. And based on the visualized trends, some rather interesting conclusions can be drawn. The most obvious is that the geographical distribution of sightings is hardly even. For starters, reports in the USA were equal to about 2500 sightings per 10 million people.

This is almost 300 times higher than the global average. Based on individual states, the concentration of sightings was also quite interesting. Apparently, more sightings happen (per 10 million people) in the West and Northwest, with the highest numbers coming from Washington and Montana. Oregon, Idaho, Arizona and New Mexico also made strong showings, while the Great Lakes and Midwestern states were all consistent with the national median.

On the opposite coast, Maine, Vermont, and New Hampshire all had a good number of sightings per capita, though the state of New York even as New York was beneath the national median. Texas actually ranked the lowest, and was followed by the Southern states of Louisiana, Mississippi, Alabama and Georgia. But as Monfort told Universe Today via email, this may be slightly skewed because of who is collecting the information:

“[I]t’s worth mentioning that the NUFORC is an American agency (“N” stands for “National”). They make an effort to record international sightings (phone banks staffed 24/7), but I’d guess that sightings in the USA are still over-represented. Honestly, I’d bet that the NUFORC being based in Seattle is the main reason we see so many more sightings in the States. A more thorough analysis might cross-reference sightings from other agencies, like MUFON.”

The geographic breakdown of annual UFO sightings (per 10 million people) in the US. Credit: sammonfort3

Canadians did not do much better, coming at second place after the United States with 1000 sightings per 10 million people. And according to a recent article by Allan Maki of The Globe and Mail, its becoming more common – with a record 1982 sightings reported in 2012. He also suggests that this could be due to a combination of growing interest in the subject and reduced stigma.

Iceland, the UK, Australia, the Virgin Islands and Cyprus all ranked a distant third, with between 250 and 500 sightings per 100 million people per year. New Zealand, Mexico, Israel and the Gulf States also produced considerable returns, as did the United Kingdom, Ireland, Portugal, Belgium, Danemark, Finland, Sweden and Norway.

From this distribution, one might make the generalization that more developed nations are more likely to report UFOs (i.e. better record-keeping and all that). And this is a possibility which Monfort explored. In another visualization, he cross-referenced the number of sightings in a respective country with amount of internet access it has (per 100 people), and a limited correlation was shown.

Nations like Israel and the Gulf States have a higher number of sightings than neighboring countries like Syria, Saudi Arabia and Iraq, while South Africa has more reported sightings than several North African and Sub-Saharan African nations surveyed. However, fast-developing nations like Russia, China and India showed a lower than average level of sightings, while Guyana and Suriname showed a higher than average level.

The number of UFO sightings per year, subdivided based on the type of object reported. Credit: sammonfort3

France, Italy and the Czech Republic also lagged behind many of their European counterparts, and Germany and Spain were only slightly higher than the average. So much like distribution by state within the US, internet access does not seem to be a consistent determining factor. Another interesting visualization was the one which broke down the sightings per decade based on the nature of the sighting.

As you can see from the table above, when UFO sightings first began in the early 20th century, they reportedly took the form of either a sphere or a cigar-shaped object. This differs from the 1920s, when “flying saucers” began to appear, and remained the dominant trend throughout World War II and the Cold War era. And ever since the 1990s – what Monfort refers to as “post-internet” era – the most common UFO sightings took the form of bright lights.

“If I had to guess, I’d say it was a combination of factors,” said Monfort. “Like I mentioned in the blog, it seems a lot more plausible that someone would see strange lights in the sky than a flying object with a concrete shape (like a saucer). Seeing a shape implies that the object is pretty close to you, “and if it’s that close why didn’t you take a video of it?”

As for other factors, Monfort considers the possibility of fireworks and (as one comment on his blog suggested) Chinese lanterns. “Those are the little paper balloons you light a candle in and let fly. Some of the bright light sightings could be those, especially since I’d bet most Chinese lanterns are released in groups, with several people going out in groups to release them together. (Often people report formations of lights.)”

Naturally, the data does not support any ironclad conclusions, and plenty can be said about its reliability and methodology. After all, while UFO sightings are documented, they are famous for being routinely debunked. Nevertheless, visuals like these are interesting in illustrated the patterns of sightings, and can allow for some insightful speculation as to why they take place.

Further Reading: Visualize This

Finally, the Missing Link in Planetary Formation!

This artist's illustration shows planetisimals around a young star. New research shows that planetesimals are blasted by headwind, losing debris into space. Image Credit: NASA/JPL

The theory of how planets form has been something of an enduring mystery for scientists. While astronomers have a pretty good understanding of where planetary systems comes from – i.e. protoplanetary disks of dust and gas around new stars (aka. “Nebular Theory“) – a complete understanding of how these discs eventually become objects large enough to collapse under their own gravity has remained elusive.

But thanks to a new study by a team of researchers from France, Australia and the UK, it seems that the missing piece of the puzzle may finally have been found. Using a series of simulations, these researchers have shown how “dust traps” – i.e. regions where pebble-sized fragments could collect and stick together – are common enough to allow for the formation of planetesimals.

Their study, titled “Self-Induced Dust Traps: Overcoming Planet Formation Barriers“, appeared recently in the Monthly Notices of the Royal Astronomical Society. Led by Dr. Jean-Francois Gonzalez – of the Lyon Astrophysics Research Center (CRAL) in France – the team examined the troublesome middle-stage of planetary formation that has plagued scientists.

An image of a protoplanetary disk, made using results from the new model, after the formation of a spontaneous dust trap, visible as a bright dust ring. Gas is depicted in blue and dust in red. Credit: Jean-Francois Gonzalez.

Until recently, the process by which protoplanetary disks of dust and gas aggregate to form peddle-sized objects, and the process by which planetesimals (objects that are one hundred meters or more in diameter) form planetary cores, have been well understood. But the process that bridges these two – where pebbles come together to form planetesimals – has remained unknown.

Part of the problem has been the fact that the Solar System, which has been our only frame of reference for centuries, formed billions of years ago. But thanks to recent discoveries (3453 confirmed exoplanets and counting), astronomers have had lots of opportunities to study other systems that are in various stages of formation. As Dr. Gonzalez explained in a Royal Astronomical Society press release:

“Until now we have struggled to explain how pebbles can come together to form planets, and yet we’ve now discovered huge numbers of planets in orbit around other stars. That set us thinking about how to solve this mystery.”

In the past, astronomers believed that “dust traps” – which are integral to planet formation – could only exist within certain environments. In these high-pressure regions, large grains of dust are slowed down to the point where they are able to come together. These regions are extremely important since they counteract the two main obstacles to planetary formation, which are drag and high-speed collisions.

Artist’s impression of the planets in our solar system, along with the Sun (at bottom). Credit: NASA

Drag is caused by the effect gas has on dust grains, which causes them to slow down and eventually drift into the central star (where they are consumed). As for high-speed collisions, this is what causes large pebbles to smash into each other and break apart, thus reversing the aggregation process. Dust traps are therefore needed to ensure that dust grains are slowed down just enough so that they won’t annihilate each other when they collide.

To see just how common these dust traps were, Dr. Gonzalez and his colleagues conducted a series of computer simulations that took into account how dust in a protoplanetary disk could exert drag on the gas component – a process known as “aerodynamic drag back-reaction”. Whereas gas typically has an arresting influence on dust particles, in particularly dusty rings, the opposite can be true.

This effect has been largely ignored by astronomers up until recently, since its generally quite negligible. But as the team noted, it is an important factor in protoplanetary disks, which are known for being incredibly dusty environments. In this scenario, the effect of back-reaction is to slow inward-moving dust grains and push gas outwards where it forms high-pressure regions – i.e. “dust traps”.

Once they accounted for these effects, their simulations showed how planets form in three basic stages. In the first stage, dust grains grow in size and move inwards towards the central star. In the second, the now pebble-sized larger grains accumulate and slow down. In the third and final stage, the gas is pushed outwards by the back-reaction, creating the dust trap regions where it accumulates.

Illustration showing the stages of the formation mechanism for dust traps. Credit: © Volker Schurbert.

These traps then allow the pebbles to aggregate to form planetesimals, and eventually planet-sized worlds. With this model, astronomers now have a solid idea of how planetary formation goes from dusty disks to planetesimals coming together. In addition to resolving a key question as to how the Solar System came to be, this sort of research could prove vital in the study of exoplanets.

Ground-based and space-based observatories have already noted the presence of dark and bright rings that are forming in protoplanetary disks around distant stars – which are believed to be dust traps. These systems could provide astronomers with a chance to test this new model, as they watch planets slowly come together. As Dr. Gonzalez indicated:

“We were thrilled to discover that, with the right ingredients in place, dust traps can form spontaneously, in a wide range of environments. This is a simple and robust solution to a long standing problem in planet formation.”

Further Reading: Royal Astronomical Society, MNRAS

This is Actual Science. Crystals at the Earth’s Core Power its Magnetic Field

The Earth's layers, showing the Inner and Outer Core, the Mantle, and Crust. Credit: discovermagazine.com

Whether or not a planet has a magnetic field goes a long way towards determining whether or not it is habitable. Whereas Earth has a strong magnetosphere that protects life from harmful radiation and keeps solar wind from stripping away its atmosphere, planet’s like Mars no longer do. Hence why it went from being a world with a thicker atmosphere and liquid water on its surface to the cold, desiccated place it is today.

For this reason, scientists have long sought to understand what powers Earth’s magnetic field. Until now, the consensus has been that it was the dynamo effect created by Earth’s liquid outer core spinning in the opposite direction of Earth’s rotation. However, new research from the Tokyo Institute of Technology suggests that it may actually be due to the presence of crystallization in the Earth’s core.

The research was conducted by scientists from the Earth-Life Science Institute (ELSI) at Tokyo Tech. According to their study – titled “Crystallization of Silicon Dioxide and Compositional Evolution of the Earth’s Core“, which appeared recently in Nature – the energy that drives the Earth’s magnetic field may have more to do with the chemical composition of the Earth’s core.

Using a diamond anvil and a laser, researchers at Tokyo Tech subjected silicon and oxygen samples to conditions similar to the Earth’s core. Credit: Sang-Heon Shim/Arizona State University

Of particular concern for the research team was the rate of which Earth’s core cools over geological time – which has been the subject of debate for some time. And for Dr. Kei Hirose – the director of the Earth-Life Science Institute and lead author on the paper – it has been something of a lifelong pursuit. In a 2013 study, he shared research findings that indicated how the Earth’s core may have cooled more significantly than previously thought.

He and his team concluded that since the Earth’s formation (4.5 billion years ago), the core may have cooled by as much as 1,000 °C (1,832 °F). These findings were rather surprising to the Earth sciences community – leading to what one scientists referred to as the “New Core Heat Paradox“. In short, this rate of core cooling would mean that some other source of energy would be required to sustain the Earth’s geomagnetic field.

On top of this, and related to the issue of core-cooling, were some unresolved questions about the chemical composition of the core. As Dr. Kei Hirose said in a Tokyo Tech press release:

“The core is mostly iron and some nickel, but also contains about 10% of light alloys such as silicon, oxygen, sulfur, carbon, hydrogen, and other compounds. We think that many alloys are simultaneously present, but we don’t know the proportion of each candidate element.”

The magnetic field and electric currents in and around Earth generate complex forces that have immeasurable impact on every day life. Credit: ESA/ATG medialab

In order to resolve this, Hirose and his colleagues at ELSI conducted a series of experiments where various alloys were subjected to heat and pressure conditions similar to that in the Earth’s interior. This consisted of using a diamond anvil to squeeze dust-sized alloy samples to simulate high pressure conditions, and then heating them with a laser beam until they reached extreme temperatures.

In the past, research into iron alloys in the core have focused predominantly on either iron-silicon alloys or iron-oxide at high pressures. But for the sake of their experiments, Hirose and his colleagues decided to focus on the combination of silicon and oxygen – which are believed to exist in the outer core – and examining the results with an electron microscope.

What the researchers found was that under conditions of extreme pressure and heat, samples of silicon and oxygen combined to form silicon dioxide crystals – which were similar in composition to mineral quartz found in the Earth’s crust. Ergo, the study showed that the crystallization of silicon dioxide in the outer core would have released enough buoyancy to power core convection and a dynamo effect from as early on as the Hadean eon onward.

As John Hernlund, also a member of ELSI and a co-author of the study, explained:

“This result proved important for understanding the energetics and evolution of the core. We were excited because our calculations showed that crystallization of silicon dioxide crystals from the core could provide an immense new energy source for powering the Earth’s magnetic field.”

Cross-section of Mars revealing its inner core. Mars must have one day had such a field, but the energy source that powered it has since shut down. Credit: NASA/JPL/GSFC

This study not only provides evidence to help resolve the so-called “New Core Heat Paradox”, it also may help advance our understanding of what conditions were like during the formation of Earth and the early Solar System. Basically, if silicon and oxygen form crystal of silicon dioxide in the outer core over time, then sooner or later, the process will stop once the core runs out of these elements.

When that happens, we can expect Earth’s magnetic field will suffer, which will have drastic implications for life on Earth. It also helps to put constraints on the concentrations of silicon and oxygen that were present in the core when the Earth first formed, which could go a long way towards informing our theories about Solar System formation.

What’s more, this research may help geophysicists to determine how and when other planets (like Mars, Venus and Mercury) still had magnetic fields (and possibly lead to ideas of how they could be powered up again). It could even help exoplanet-hunting science teams determine which exoplanets have magnetospheres, which would allow us to find out which extra-solar worlds could be habitable.

Further Reading: Tokyo Tech News, Nature.

SETI Has Already Tried Listening to TRAPPIST-1 for Aliens

This artist's concept shows what each of the TRAPPIST-1 planets may look like, based on available data about their sizes, masses and orbital distances. Credits: NASA/JPL-Caltech

The Trappist-1 system has been featured in the news quite a bit lately. In May of 2016, it appeared in the headlines after researchers announced the discovery of three exoplanets orbiting around the red dwarf star. And then there was the news earlier this week of how follow-up examinations from ground-based telescopes and the Spitzer Space Telescope revealed that there were actually seven planets in this system.

And now it seems that there is more news to be had from this star system. As it turns out, the Search for Extraterrestrial Intelligence (SETI) Institute was already monitoring this system with their Allen Telescope Array (ATA), looking for signs of life even before the multi-planet system was announced. And while the survey did not detect any telltale signs of radio traffic, further surveys are expected.

Given its proximity to our own Solar System, and the fact that this system contains seven planets that are similar in size and mass to Earth, it is both tempting and plausible to think that life could be flourishing in the TRAPPIST-1 system. As Seth Shostak, a Senior Astronomer at SETI, explained:

“[T]he opportunities for life in the Trappist 1 system make our own solar system look fourth-rate.  And if even a single planet eventually produced technically competent beings, that species could quickly disperse its kind to all the rest… Typical travel time between worlds in the Trappist 1 system, even assuming rockets no speedier than those built by NASA, would be pleasantly short.  Our best spacecraft could take you to Mars in 6 months.  To shuttle between neighboring Trappist planets would be a weekend junket.”

Illustration showing the possible surface of TRAPPIST-1f, one of the newly discovered planets in the TRAPPIST-1 system. Credits: NASA/JPL-Caltech

Little wonder then why SETI has been using their Allen Telescope Array to monitor the system ever since exoplanets were first announced there. Located at the Hat Creek Radio Observatory in northern California (northeast of San Francisco), the ATA is what is known as a “Large Number of Small Dishes” (LNSD) array – which is a new trend in radio astronomy.

Like other LNSD arrays – such as the proposed Square Kilometer Array currently being built in Australia and South Africa – the concept calls for the deployment of many smaller dishes over a large surface area, rather than a single large dish. Plans for the array began back in 1997, when the SETI Institute convened a workshop to discuss the future of the Institute and its search strategies.

The final report of the workshop, titled “SETI 2020“, laid out a plan for the creation of a new telescope array. This array was referred to as the One Hectare Telescope at the time, since the plan called for a LNSD encompassing an area measuring 10,000 m² (one hectare). The SETI Institute began developing the project in conjunction with the Radio Astronomy Laboratory (RAL) at the UC Berkeley.

In 2001, they secured a $11.5 million donation from the Paul G. Allen Family Foundation, which was established by Microsoft co-founder Paul Allen. In 2007, the first phase of construction was completed and the ATA finally became operational on October 11th, 2007, with 42 antennas (ATA-42). Since that time, Allen has committed to an additional $13.5 million in funding for a second phase of expansion (hence why it bears his name).

A portion of the Allen Telescope Array. (Credit: Seth Shostak/The SETI Institute. Used with permission)

Compared to large, single dish-arrays, smaller dish-arrays are more cost-effective because they can be upgraded simply by adding more dishes. The ATA is also less expensive since it relies on commercial technology originally developed for the television market, as well as receiver and cryogenic technologies developed for radio communication and cell phones.

It also uses programmable chips and software for signal processing, which allows for rapid integration whenever new technology becomes available. As such, the array is well suited to running simultaneous surveys at centimeter wavelengths. As of 2016, the SETI Institute has performed observations with the ATA for 12 hour periods (from 6 pm and 6 am), seven days a week.

And last year, the array was aimed towards TRAPPIST-1, where it conducted a survey scanning ten billion radio channels in search of signals. Naturally, the idea that a radio signal would be emanating from this system, and one which the ATA could pick up, might seem like a bit of a longshot. But in fact, both the infrastructure and energy requirements would not be beyond a species who’s technical advancement is commensurate with our own.

“Assuming that the putative inhabitants of this solar system can use a transmitting antenna as large as the 500 meter FAST radio telescope in China to beam their messages our way, then the Allen Array could have found a signal if the aliens use a transmitter with 100 kilowatts of power or more,” said Shostak. “This is only about ten times as energetic as the radar down at your local airport.”

A plot of diameter versus the amount of sunlight hitting the planets in the TRAPPIST-1 system, scaled by the size of the Earth and the amount of sunlight hitting the Earth. Credit: F. Marchis/H. Marchis

So far, nothing has been picked up from this crowded system. But the SETI Institute is not finished and future surveys are already in the works. If there is a thriving, technologically-advanced civilization in this system (and they know their way around a radio antenna), surely there will be signs soon enough.

And regardless, the discovery of seven planets in the TRAPPIST-1 system is very exciting because it demonstrates just how plentiful systems that could support life are in our Universe. Not only does this system have three planets orbiting within its habitable zone (all of which are similar in size and mass to Earth), but the fact that they orbit a red dwarf star is very encouraging.

These stars are the most common in our Universe, making up 70% of stars in our galaxy, and up to 90% in elliptical galaxies. They are also very stable, remaining in their Main Sequence phase for up to 10 trillion years. Last, but not least, astronomers believe that 20 out of 30 nearest stars to our Solar System are red dwarfs. Lots of opportunities to find life within a few dozen light years!

“[W]hether or not Trappist 1 has inhabitants, its discovery has underlined the growing conviction that the Universe is replete with real estate on which biology could both arise and flourish,’ says Shostak. “If you still think the rest of the universe is sterile, you are surely singular, and probably wrong.”

Further Reading: SETI

It Might Be Possible to Refreeze the Icecaps to Slow Global Warming

NASA icecap data
NASA icecap data

One of the most worrisome aspects of Climate Change is the role played by positive feedback mechanisms. In addition to global temperatures rising because of increased carbon dioxide and greenhouse gas emissions, there is the added push created by deforestation, ocean acidification, and (most notably) the disappearance of the Arctic Polar Ice Cap.

However, according to a new study by a team of researchers from the School of Earth and Space Exploration at Arizona State University, it might be possible to refreeze parts of the Arctic ice sheet. Through a geoengineering technique that would rely on wind-powered pumps, they believe one of the largest positive feedback mechanisms on the planet can be neutralized.

Their study, titled “Arctic Ice Management“, appeared recently in Earth’s Future, an online journal published by the American Geophysical Union. As they indicate, the current rate at which Arctic ice is disappearing it quite disconcerting. Moreover, humanity is not likely to be able to combat rising global temperatures in the coming decades without the presence of the polar ice cap.

A drastic decrease in arctic sea ice since satellite imaging of the polar ice cap began. Credit: NASA

Of particular concern is the rate at which polar ice has been disappearing, which has been quite pronounced in recent decades. The rate of loss has been estimated at being between 3.5% and 4.1% per decade, with in an overall decrease of at least 15% since 1979 (when satellite measurements began). To make things worse, the rate at which ice is being lost is accelerating.

From a baseline of about 3% per decade between 1978-1999, the rate of loss since the 2000s has climbed considerably – to the point that the extent of sea-ice in 2016 was the second lowest ever recorded. As they state in their Introduction (and with the support of numerous sources), the problem is only likely to get worse between now and the mid-21st century:

“Global average temperatures have been observed to rise linearly with cumulative CO2 emissions and are predicted to continue to do so, resulting in temperature increases of perhaps 3°C or more by the end of the century. The Arctic region will continue to warm more rapidly than the global mean. Year-round reductions in Arctic sea ice are projected in virtually all scenarios, and a nearly ice-free (<106 km2 sea-ice extent for five consecutive years) Arctic Ocean is considered “likely” by 2050 in a business-as-usual scenario.”

One of the reasons the Arctic is warming faster than the rest of the planet has to do with strong ice-albedo feedback. Basically, fresh snow ice reflects up to 90% of sunlight while sea ice reflects sunlight with albedo up to 0.7, whereas open water (which has an albedo of close to 0.06) absorbs most sunlight. Ergo, as more ice melts, the more sunlight is absorbed, driving temperatures in the Arctic up further.

Arctic sea-ice extent (area covered at least 15% by sea ice) in September 2007 (white area). The red curve denotes the 1981–2010 average. Credit: National Snow and Ice Data CenterTo address this concern, the research team – led by Steven J. Desch, a professor from the School of Earth and Space Exploration – considered how the melting is connected to seasonal fluctuations. Essentially, the Arctic sea ice is getting thinner over time because new ice (aka. “first-year ice”), which is created with every passing winter, is typically just 1 meter (3.28 ft) thick.

Ice that survives the summer in the Arctic is capable of growing and becoming “multiyear ice”, with a typical thickness of 2 to 4 meters (6.56 to 13.12 ft). But thanks to the current trend, where summers are getting progressively warmer, “first-year ice” has been succumbing to summer melts and fracturing before it can grow. Whereas multiyear ice comprised 50 to 60% of all ice in the Arctic Ocean in the 1980s, by 2010, it made up just 15%.

With this in mind, Desch and his colleagues considered a possible solution that would ensure that “first-year ice” would have a better chance of surviving the summer. By placing machines that would use wind power to generate pumps, they estimate that water could be brought to the surface over the course of an Arctic winter, when it would have the best chance of freezing.

Based on calculations of wind speed in the Arctic, they calculate that a wind turbine with 6-meter diameter blades would generate sufficient electricity so that a single pump could raise water to a height of 7 meters, and at a rate of 27 metric tons (29.76 US tons) per hour. The net effect of this would be thicker sheets of ice in the entire affected area, which would have a better chance of surviving the summer.

Melt pools on melting sea-ice. Every summer, newly-formed ice is threatened because of rising global temperatures. Credit NASA

Over time, the negative feedback created by more ice would cause less sunlight to be absorbed by the Arctic ocean, thus leading to more cooling and more ice accumulation. This, they claim, could be done on a relatively modest budget of $500 billion per year for the entire Arctic, or $50 billion per year for 10% of the Arctic.

While this may sounds like a huge figure, they are quick to point out that the cast covering the entire Arctic with ice-creating pumps  – which could save trillions in GDP and countless lives- is equivalent to just 0.64% of current world gross domestic product (GDP) of $78 trillion. For a country like the United States, it represents just 13% of the current federal budget ($3.8 trillion).

And while there are several aspects of this proposal that still need to be worked out (which Desch and his team fully acknowledge), the concept does appear to be theoretically sound. Not only does it take into account the way seasonal change and Climate Change are linked in the Arctic, it acknowledges how humanity is not likely to be be able to address Climate Change without resorting to geoengineering techniques.

And since Arctic ice is one of the most important things when it comes to regulating global temperatures, it makes perfect sense to start here.

Further Reading: Earth’s Future