Proxima Centauri Just Released a Deadly Flare, so it’s Probably not a Great Place for Habitable Planets

Artist impression of a red dwarf star like Proxima Centauri, the nearest star to our sun. New analysis of ALMA observations reveal that Proxima Centauri emitted a powerful flare that would have created inhospitable conditions for planets in that system. Credit: NRAO/AUI/NSF; D. Berry

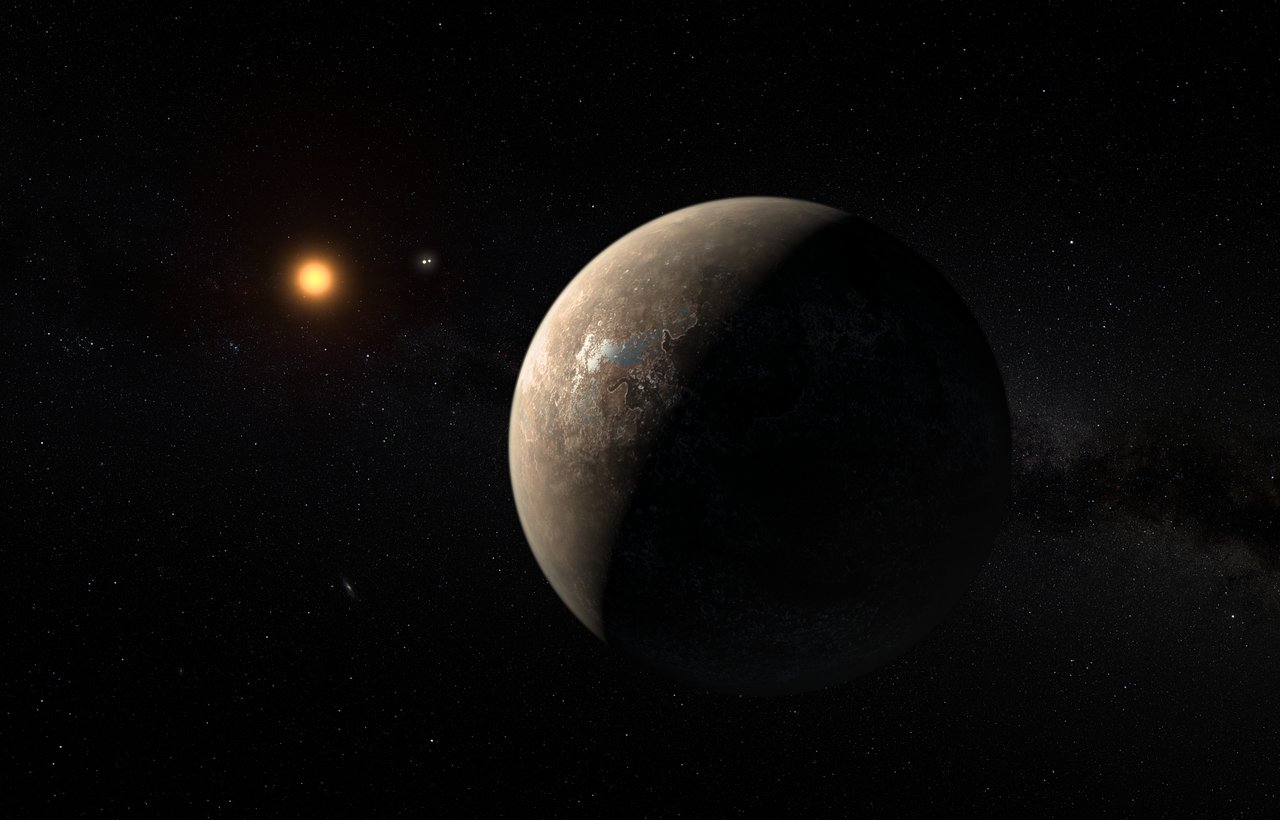
Since it’s discovery was announced in August of 2016, Proxima b has been an endless source of wonder and the target of many scientific studies. As the closest extra-solar planet to our Solar System – and a terrestrial planet that orbits within Proxima Centauri’s circumstellar habitable zone (aka. “Goldilocks Zone”) – scientists have naturally wondered whether or not this planet could be habitable.

Unfortunately, many of these studies have emphasized the challenges that life on Proxima b would likely face, not the least of which is harmful radiation from its star. According to a recent study, a team of astronomers used the ALMA Observatory to detect a large flare emanating from Proxima Centauri. This latest findings, more than anything, raises questions about how habitable its exoplanet could be.

The study, titled “Detection of a Millimeter Flare from Proxima Centauri“, recently appeared in The Astrophysical Journal Letters. Led by Meredith A. MacGregor, an NSF Astronomy and Astrophysics Postdoctoral Fellow at the Carnegie Institution for Science, the team also included members from the Harvard-Smithsonian Center for Astrophysics (CfA) and the University of Colorado Boulder.

Artist’s impression of Proxima b, which was discovered using the Radial Velocity method. Credit: ESO/M. Kornmesser

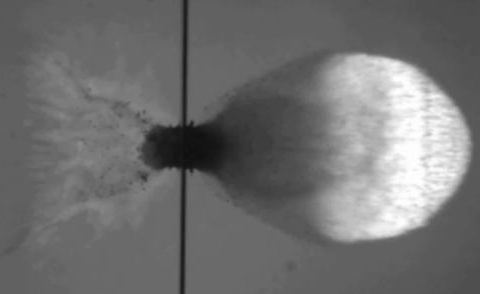
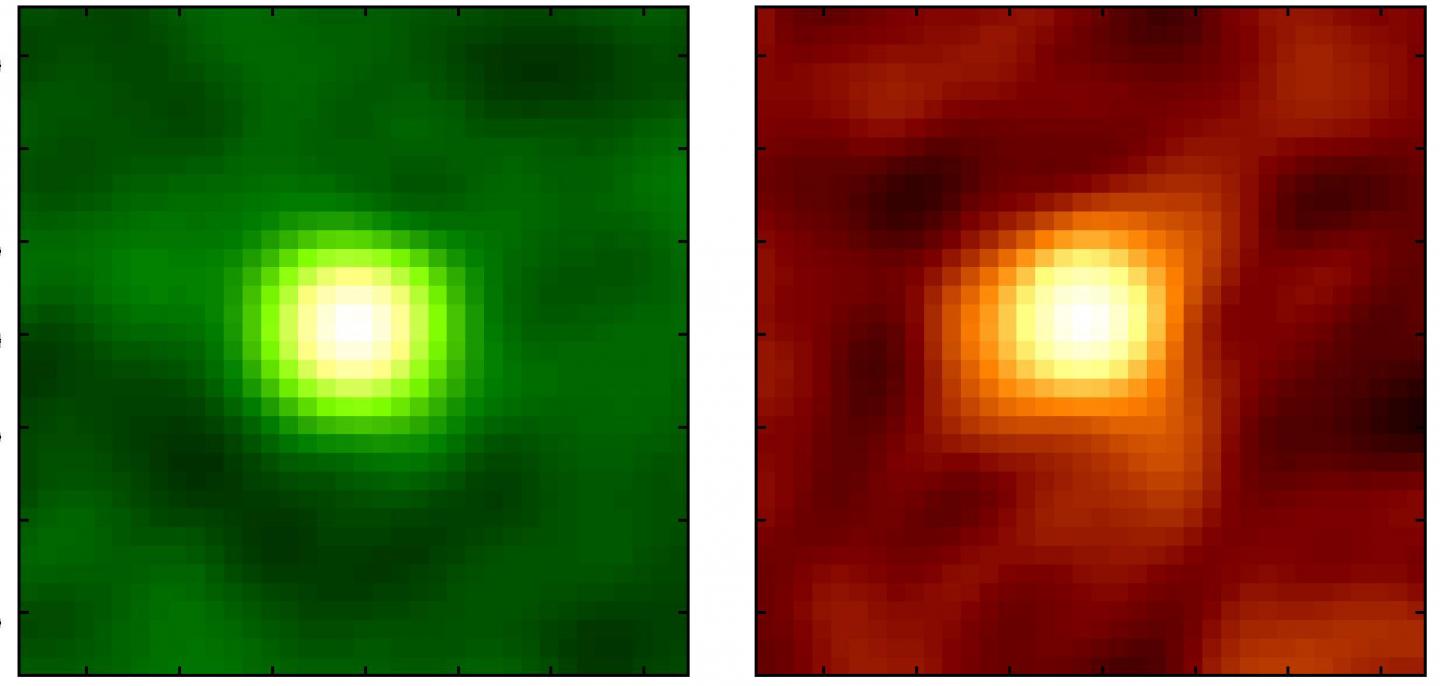
For the sake of their study, the team used data obtained by the Atacama Large Millimeter/submillimeter Array (ALMA) between January 21st to April 25th, 2017. This data revealed that the star underwent a significant flaring event on March 24th, where it reached a peak that was 1000 times brighter than the star’s quiescent emission for a period of ten seconds.

Astronomers have known for a long time that when compared to stars like our Sun, M-type stars are variable and unstable. While they are the smallest, coolest, and dimmest stars in our Universe, they tend to flare up at a far greater rate. In this case, the flare detected by the team was ten times larger than our Sun’s brightest flares at similar wavelengths.

Along with a smaller preceding flare, the entire event lasted fewer than two minutes of the 10 hours that ALMA was observing the star between January and March of last year. While it was already known that Proxima Centauri, like all M-type stars, experiences regular flare activity, this one appeared to be a rare event. However, stars like Proxima Centauri are also known to experienced regular, although smaller, X-ray flares.

All of this adds up to a bad case for habitability. As MacGregor explained in a recent NRAO press statement:

“It’s likely that Proxima b was blasted by high energy radiation during this flare. Over the billions of years since Proxima b formed, flares like this one could have evaporated any atmosphere or ocean and sterilized the surface, suggesting that habitability may involve more than just being the right distance from the host star to have liquid water.”

Artist’s impression of the surface of the planet Proxima b orbiting the red dwarf star Proxima Centauri. The double star Alpha Centauri AB is visible to the upper right of Proxima itself. Credit: ESO

MacGregor and her colleagues also considered the possibility that Proxima Centauri is circled by several disks of dust. This was suggested by a previous study (also based on ALMA data) that indicated that the light output of both the star and flare together pointed towards the existence of debris belts around the star. However, after examining the ALMA data as a function of observing time, they were able to eliminate this as a possibility.

As Alycia J. Weinberger, also a researcher with the Carnegie Institution for Science and a co-author on the paper, explained:

“There is now no reason to think that there is a substantial amount of dust around Proxima Cen. Nor is there any information yet that indicates the star has a rich planetary system like ours.”

To date, studies that have looked at possible conditions on Proxima b have come to different conclusions as to whether or not it could retain an atmosphere or liquid water on its surface. While some have found room for “transient habitability” or evidence of liquid water, others have expressed doubt based on the long-term effects that radiation and flares from its star would have on a tidally-locked planet.

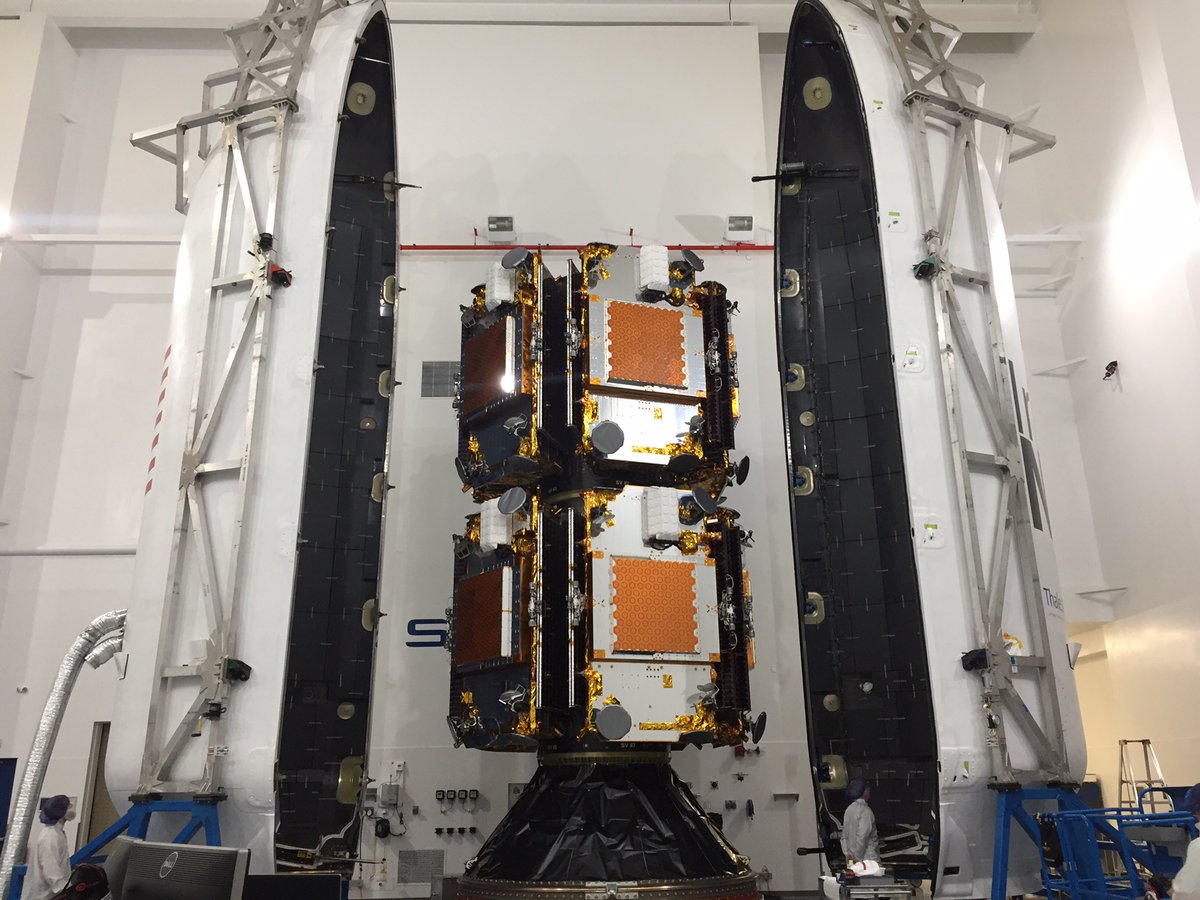
In the future, the deployment of next-generation instruments like the James Webb Space Telescope are expected to provide more detailed information on this system. With precise measurements of this star and its planet, the question of whether or not life can (and does) exist in this system may finally be answered.

And be sure to enjoy this animation of Proxima Centauri in motion, courtesy of NRAO outreach:

Further Reading: NRAO, The Astrophysical Journal Letters

Precise New Measurements From Hubble Confirm the Accelerating Expansion of the Universe. Still no Idea Why it’s Happening

These Hubble Space Telescope images showcase two of the 19 galaxies analyzed in a project to improve the precision of the universe's expansion rate, a value known as the Hubble constant. The color-composite images show NGC 3972 (left) and NGC 1015 (right), located 65 million light-years and 118 million light-years, respectively, from Earth. The yellow circles in each galaxy represent the locations of pulsating stars called Cepheid variables. Credits: NASA, ESA, A. Riess (STScI/JHU)

In the 1920s, Edwin Hubble made the groundbreaking revelation that the Universe was in a state of expansion. Originally predicted as a consequence of Einstein’s Theory of General Relativity, this confirmation led to what came to be known as Hubble’s Constant. In the ensuring decades, and thanks to the deployment of next-generation telescopes – like the aptly-named Hubble Space Telescope (HST) – scientists have been forced to revise this law.

In short, in the past few decades, the ability to see farther into space (and deeper into time) has allowed astronomers to make more accurate measurements about how rapidly the early Universe expanded. And thanks to a new survey performed using Hubble, an international team of astronomers has been able to conduct the most precise measurements of the expansion rate of the Universe to date.

This survey was conducted by the Supernova H0 for the Equation of State (SH0ES) team, an international group of astronomers that has been on a quest to refine the accuracy of the Hubble Constant since 2005. The group is led by Adam Reiss of the Space Telescope Science Institute (STScI) and Johns Hopkins University, and includes members from the American Museum of Natural History, the Neils Bohr Institute, the National Optical Astronomy Observatory, and many prestigious universities and research institutions.

Illustration of the depth by which Hubble imaged galaxies in prior Deep Field initiatives, in units of the Age of the Universe. Credit: NASA and A. Feild (STScI)

The study which describes their findings recently appeared in The Astrophysical Journal under the title “Type Ia Supernova Distances at Redshift >1.5 from the Hubble Space Telescope Multi-cycle Treasury Programs: The Early Expansion Rate“. For the sake of their study, and consistent with their long term goals, the team sought to construct a new and more accurate “distance ladder”.

This tool is how astronomers have traditionally measured distances in the Universe, which consists of relying on distance markers like Cepheid variables – pulsating stars whose distances can be inferred by comparing their intrinsic brightness with their apparent brightness. These measurements are then compared to the way light from distance galaxies is redshifted to determine how fast the space between galaxies is expanding.

From this, the Hubble Constant is derived. To build their distant ladder, Riess and his team conducted parallax measurements using Hubble’s Wide Field Camera 3 (WFC3) of eight newly-analyzed Cepheid variable stars in the Milky Way. These stars are about 10 times farther away than any studied previously – between 6,000 and 12,000 light-year from Earth – and pulsate at longer intervals.

To ensure accuracy that would account for the wobbles of these stars, the team also developed a new method where Hubble would measure a star’s position a thousand times a minute every six months for four years. The team then compared the brightness of these eight stars with more distant Cepheids to ensure that they could calculate the distances to other galaxies with more precision.

Illustration showing three steps astronomers used to measure the universe’s expansion rate (Hubble constant) to an unprecedented accuracy, reducing the total uncertainty to 2.3 percent. Credits: NASA/ESA/A. Feild (STScI)/and A. Riess (STScI/JHU)

Using the new technique, Hubble was able to capture the change in position of these stars relative to others, which simplified things immensely. As Riess explained in a NASA press release:

“This method allows for repeated opportunities to measure the extremely tiny displacements due to parallax. You’re measuring the separation between two stars, not just in one place on the camera, but over and over thousands of times, reducing the errors in measurement.”

Compared to previous surveys, the team was able to extend the number of stars analyzed to distances up to 10 times farther. However, their results also contradicted those obtained by the European Space Agency’s (ESA) Planck satellite, which has been measuring the Cosmic Microwave Background (CMB) – the leftover radiation created by the Big Bang – since it was deployed in 2009.

By mapping the CMB, Planck has been able to trace the expansion of the cosmos during the early Universe – circa. 378,000 years after the Big Bang. Planck’s result predicted that the Hubble constant value should now be 67 kilometers per second per megaparsec (3.3 million light-years), and could be no higher than 69 kilometers per second per megaparsec.

The Big Bang timeline of the Universe. Cosmic neutrinos affect the CMB at the time it was emitted, and physics takes care of the rest of their evolution until today. Credit: NASA/JPL-Caltech/A. Kashlinsky (GSFC).

Based on their sruvey, Riess’s team obtained a value of 73 kilometers per second per megaparsec, a discrepancy of 9%. Essentially, their results indicate that galaxies are moving at a faster rate than that implied by observations of the early Universe. Because the Hubble data was so precise, astronomers cannot dismiss the gap between the two results as errors in any single measurement or method. As Reiss explained:

“The community is really grappling with understanding the meaning of this discrepancy… Both results have been tested multiple ways, so barring a series of unrelated mistakes. it is increasingly likely that this is not a bug but a feature of the universe.”

These latest results therefore suggest that some previously unknown force or some new physics might be at work in the Universe. In terms of explanations, Reiss and his team have offered three possibilities, all of which have to do with the 95% of the Universe that we cannot see (i.e. dark matter and dark energy). In 2011, Reiss and two other scientists were awarded the Nobel Prize in Physics for their 1998 discovery that the Universe was in an accelerated rate of expansion.

Consistent with that, they suggest that Dark Energy could be pushing galaxies apart with increasing strength. Another possibility is that there is an undiscovered subatomic particle out there that is similar to a neutrino, but interacts with normal matter by gravity instead of subatomic forces. These “sterile neutrinos” would travel at close to the speed of light and could collectively be known as “dark radiation”.

This illustration shows the evolution of the Universe, from the Big Bang on the left, to modern times on the right. Credit: NASA

Any of these possibilities would mean that the contents of the early Universe were different, thus forcing a rethink of our cosmological models. At present, Riess and colleagues don’t have any answers, but plan to continue fine-tuning their measurements. So far, the SHoES team has decreased the uncertainty of the Hubble Constant to 2.3%.

This is in keeping with one of the central goals of the Hubble Space Telescope, which was to help reduce the uncertainty value in Hubble’s Constant, for which estimates once varied by a factor of 2.

So while this discrepancy opens the door to new and challenging questions, it also reduces our uncertainty substantially when it comes to measuring the Universe. Ultimately, this will improve our understanding of how the Universe evolved after it was created in a fiery cataclysm 13.8 billion years ago.

Further Reading: NASA, The Astrophysical Journal

This was Exactly Where Cassini Crashed into Saturn

The site of the Cassini probe's crash in Saturn's atmosphere, circled in white. Credit: NASA/JPL-Caltech/Space Science Institute

On September 15th, 2017, after nearly 20 years in service, the Cassini spacecraft ended its mission by plunging into the atmosphere of Saturn. During the 13 years it spent in the Saturn system, this probe revealed a great deal about the gas giant, its rings, and its systems of moons. As such, it was a bittersweet moment for the mission team when the probe concluded its Grand Finale and began descending into Saturn’s atmosphere.

Even though the mission has concluded, scientists are still busy poring over the data sent back by the probe. These include a mosaic of the final images snapped by Cassini’s cameras, which show the location of where it would enter Saturn’s atmosphere just hours later. The exact spot (shown above) is indicated by a white oval, which was on Saturn’s night side at the time, but would later come around to be facing the Sun.

From the beginning, the Cassini mission was a game-changer. After reaching the Saturn system on July 1st, 2004, the probe began a series of orbits around Saturn that allowed it conduct close flybys of several of its moons. Foremost among these were Saturn’s largest moon Titan and its icy moon Enceladus, both of which proved to be a treasure trove of scientific data.

Artist’s impression of the Cassini spacecraft orbiting Saturn. Credit: NASA/JPL-Caltech/Space Science Institute

On Titan, Cassini revealed evidence of methane lakes and seas, the existence of a methanogenic cycle (similar to Earth’s hydrological cycle), and the presence of organic molecules and prebiotic chemistry. On Enceladus, Cassini examined the mysterious plumes emanating from its southern pole, revealing that they extended all the way to the moon’s interior ocean and contained organic molecules and hydrated minerals.

These findings have inspired a number of proposals for future robotic missions to explore Titan and Enceladus more closely. So far, proposals range from exploring Titan’s surface and atmosphere using lightweight aerial platforms, balloons and landers, or a dual quadcopter. Other proposals include exploring its seas using a paddleboat or a even a submarine. And alongside Europa, there are scientists clamoring for a mission to Enceladus and other “Ocean Worlds” to explore its plumes and maybe even its interior ocean.

Beyond that, Cassini also revealed a great deal about Saturn’s atmosphere, which included the persistent hexagonal storm that exists around the planet’s north pole. During its Grand Finale, where it made 22 orbits between Saturn and its rings, the probe also revealed a great deal about the three-dimensional structure and dynamic behavior of the planet’s famous system of rings.

This montage of images, made from data obtained by Cassini’s visual and infrared mapping spectrometer, shows the location on Saturn where the NASA spacecraft entered Saturn’s atmosphere on Sept. 15, 2017. Credits: NASA/JPL-Caltech/University of Arizona

It is only fitting then that the Cassini probe would also capture images of the very spot where its mission would end. The images were taken by Cassini’s wide-angle camera on Sept. 14th, 2017, when the probe was at a distance of about 634,000 km (394,000 mi) from Saturn. They were taken using red, green and blue spectral filters, which were then combined to show the scene in near-natural color.

The resulting image is not dissimilar from another mosaic that was released on September 15th, 2017, to mark the end of the Cassini mission. This mosaic was created using data obtained by Cassini’s visual and infrared mapping spectrometer, which also showed the exact location where the spacecraft would enter the atmosphere – 9.4 degrees north latitude by 53 degrees west longitude.

The main difference, of course, is that this latest mosaic benefits from the addition of color, which provides a better sense of orientation. And for those who are missing the Cassini mission and its regular flow of scientific discoveries, its much more emotionally fitting! While we may never be able to find the wreckage buried inside Saturn’s atmosphere, it is good to know where its last known location was.

Further Reading: NASA

Wow, Indonesia’s Mount Sinabung is Making a Mess. Here’s the View From Space!

The Eruption of Sinabung Volcano, Indonesia, as seen from space. Credit: NASA Earth Observatory.

NASA’s Earth Observatory is a vital part of the space agency’s mission to advance our understanding of Earth, its climate, and the ways in which it is similar and different from the other Solar Planets. For decades, the EO has been monitoring Earth from space in order to map it’s surface, track it’s weather patterns, measure changes in our environment, and monitor major geological events.

For instance, Mount Sinabung – a stratovolcano located on the island of Sumatra in Indonesia – became sporadically active in 2010 after centuries of being dormant. But on February 19th, 2018, it erupted violently, spewing ash at least 5 to 7 kilometers (16,000 to 23,000 feet) into the air over Indonesia. Just a few hours later, Terra and other NASA Earth Observatory satellites captured the eruption from orbit.

The images were taken with Terra’s Moderate Resolution Imaging Spectroradiometer (MODIS), which recorded a natural-color image of the eruption at 11:10 am local time (04:10 Universal Time). This was just hours after the eruption began and managed to illustrate what was being reported by sources on the ground. According to multiple reports from the Associated Press, the scene was one of carnage.

Mount Sinabung on September 13th, 2010, after it became sporatically-active again. Credit: Kenrick95/Wikipedia Commons

According to eye-witness accounts, the erupting lava dome obliterated a chunk of the peak as it erupted. This was followed by plumes of hot gas and ash riding down the volcano’s summit and spreading out in a 5-kilometer (3 mile) diameter. Ash falls were widespread, covering entire villages in the area and leading to airline pilots being issued the highest of alerts for the region.

In fact, ash falls were recorded as far as away as the town of Lhokseumawe – located some 260 km (160 mi) to the north. To address the threat to public health, the Indonesian government advised people to stay indoors due to poor air quality, and officials were dispatched to Sumatra to hand out face masks. Due to its composition and its particulate nature, volcanic ash is a severe health hazard.

On the one hand, it contains sulfur dioxide (SO²), which can irritate the human nose and throat when inhaled. The gas also reacts with water vapor in the atmosphere to produce acid rain, causing damage to vegetation and drinking water. It can also react with other gases in the atmosphere to form aerosol particles that can create thick hazes and even lead to global cooling.

These levels were recorded by the Suomi-NPP satellite using its Ozone Mapper Profiler Suite (OMPS). The image below shows what SO² concentrations were like at 1:20 p.m. local time (06:20 Universal Time) on February 19th, several hours after the eruption. The maximum concentrations of SO² reached 140 Dobson Units in the immediate vicinity of the mountain.

Map showing concentrations of sulfur dioxide (SO²) due to the eruption of Mount Sinabung on the island of Sumatra, Indonesia. Credit: NASA/EO

Erik Klemetti, a volcanologist, was on hand to witness the event. As he explained in an article for Discovery Magazine:

“On February 19, 2018, the volcano decided to change its tune and unleashed a massive explosion that potentially reached at least 23,000 and possibly to up 55,000 feet (~16.5 kilometers), making it the largest eruption since the volcano became active again in 2013.”

Klemetti also cited a report that was recently filed by the Darwin Volcanic Ash Advisory Center – part of the Australian Government’s Bureau of Meteorology. According to this report, the ash will drift to the west and fall into the Indian Ocean, rather than continuing to rain down on Sumatra. Other sensors on NASA satellites have also been monitoring Mount Sinabung since its erupted.

This includes the Cloud-Aerosol Lidar and Infrared Pathfinder Satellite Observation (CALIPSO), an environmental satellite operated jointly by NASA and France’s Centre National d’Etudes Spatiales (CNES). Data from this satellite indicated that some debris and gas released by the eruption has risen as high as 15 to 18 km (mi) into the atmosphere.

In addition, data from the Aura satellite‘s Ozone Monitoring Instrument (OMI) recently indicated rising levels of SO² around Sinabung, which could mean that fresh magma is approaching the surface. As Erik Klemetti concluded:

“This could just be a one-off blast from the volcano and it will return to its previous level of activity, but it is startling to say the least. Sinabung is still a massive humanitarian crisis, with tens of thousands of people unable to return to their homes for years. Some towns have even been rebuilt further from the volcano as it has shown no signs of ending this eruptive period.”

Be sure to check out this video of the eruption, courtesy of New Zealand Volcanologist Dr. Janine Krippner:

Further Reading: NASA Earth Observatory

Spacecraft Shields Will Need to be Tough. Here’s an Aluminum Bullet Shattering a Shield at 7 km/s

Still pic from the high-speed video where ESA researchers conduct a hypervelocity test with their new FML shielding. Credit: Fraunhofer Institute for High-Speed Dynamics

After sixty years of space agencies sending rockets, satellites and other missions into orbit, space debris has become something of a growing concern. Not only are there large pieces of junk that could take out a spacecraft in a single hit, but there are also countless tiny pieces of debris traveling at very high speeds. This debris poses a serious threat to the International Space Station (ISS), active satellites and future crewed missions in orbit.

For this reason, the European Space Agency is looking to develop better debris shielding for the ISS and future generations of spacecraft. This project, which is supported through the ESA’s General Support Technology Programme, recently conducted ballistics tests that looked at the efficiency of new fiber metal laminates (FMLs), which may replace aluminum shielding in the coming years.

To break it down, any and all orbital missions – be they satellites or space stations – need to be prepared for the risk of high-speed collisions with tiny objects. This includes the possibility of colliding with human-made space junk, but also includes the risk of micro-meteoroid object damage (MMOD). These are especially threatening during intense seasonal meteoroid streams, such as the Leonids.

While larger pieces of orbital debris – ranging from 5 cm (2 inches) to 1 meter (1.09 yards) in diameter – are regularly monitored by NASA and and the ESA’s Space Debris Office, the smaller pieces are undetectable – which makes them especially threatening. To make matters worse, collisions between bits of debris can cause more to form, a phenomena known as the Kessler Effect.

And since humanity’s presence Near-Earth Orbit (NEO) is only increasing, with thousands of satellites, space habitats and crewed missions planned for the coming decades, growing levels of orbital debris therefore pose an increasing risk. As engineer Andreas Tesch explained:

“Such debris can be very damaging because of their high impact speeds of multiple kilometres per second. Larger pieces of debris can at least be tracked so that large spacecraft such as the International Space Station can move out of the way, but pieces smaller than 1 cm are hard to spot using radar – and smaller satellites have in general fewer opportunities to avoid collision.”

To see how their new shielding would hold up to space debris, a team of ESA researchers recently conducted a test where a 2.8 mm-diameter aluminum bullet was fired at sample of spacecraft shield – the results of which were filmed by a high-speed camera. At this size, and with a speed of 7 km/s, the bullet effectively simulated the impact energy that a small piece of debris would have as if it came into contact with the ISS.

Artist’s impression of all the space junk in Earth orbit. Credit: NASA

As researcher Benoit Bonvoisin explained in a recent ESA press release:

“We used a gas gun at Germany’s Fraunhofer Institute for High-Speed Dynamics to test a novel material being considered for shielding spacecraft against space debris. Our project has been looking into various kinds of ‘fibre metal laminates’ produced for us by GTM Structures, which are several thin metal layers bonded together with composite material.”

As you can see from the video (posted above), the solid aluminum bullet penetrated the shield but then broke apart into a could of fragments and vapor, which are much easier for the next layer of armor to capture or deflect. This is standard practice when dealing with space debris and MMOD, where multiple shields are layered together to adsorb and capture the impact so that it doesn’t penetrate the hull.

An common variant of this is known as the ‘Whipple shield’, which was originally devised to guard against comet dust. This shielding consists of two layers, a bumper and a rear wall, with a mutual distance of 10 to 30 cm (3.93 to 11.8 inches). In this case, the FML, which is produced for the ESA by GTM Structures BV (a Netherlands-based aerospace company), consists of several thin metal layers bonded together with a composite material.

Based on this latest test, the FML appears to be well-suited at preventing damage to the ISS and future space stations. As Benoit indicated, he and his colleagues now need to test this shielding on other types of orbital missions. “The next step would be to perform in-orbit demonstration in a CubeSat, to assess the efficiency of these FMLs in the orbital environment,” he said.

And be sure to enjoy this video from the ESA’s Orbital Debris Office:

Further Reading: ESA

Maybe There’s no Connection Between Supermassive Black Holes and Their Host Galaxies?

Artist's impression of an ionized gas outflow (green) driven by the central supermassive black hole does not affect the star formation of its host galaxy. This situation may occur if the ionized gas is outflowing perpendicularly to the molecular gas. Credit: ALMA (ESO/NAOJ/NRAO)

For decades, astrophysicists have puzzled over the relationship between Supermassive Black Holes (SMBHs) and their respective galaxies. Since the 1970s, it has been understood the majority of massive galaxies have an SMBH at their center, and that these are surrounded by rotating tori of gas and dust. The presence of these black holes and tori are what cause massive galaxies to have an Active Galactic Nucleus (AGN).

However, a recent study conducted by an international team of researchers revealed a startling conclusion when studying this relationship. Using the Atacama Large Millimeter/submillimeter Array (ALMA) to observe an active galaxy with a strong ionized gas outflow from the galactic center, the team obtained results that could indicate that there is no relationship between a an SMBH and its host galaxy.

The study, titled “No sign of strong molecular gas outflow in an infrared-bright dust-obscured galaxy with strong ionized-gas outflow“, recently appeared in the Astrophysical Journal. The study was led by Yoshiki Toba of the Academia Sinica Institute of Astronomy and Astrophysics in Taiwan and included members from Ehime University, Kogakuin University, and the National Astronomical Observatory of Japan, The Graduate University for Advanced Studies (SOKENDAI), and Johns Hopkins University.

Images from the Sloan Digital Sky Survey (SDSS) (left), and mid-infrared image from WISE (right), respectively. Credit: Sloan Digital Sky Survey/NASA/JPLCaltech

The question of how SMBHs have affected galactic evolution remains one of the greatest unresolved questions in modern astronomy. Among astrophysicists, it is something of a foregone conclusion that SMBHs have a significant impact on the formation and evolution of galaxies. According to this accepted notion, SMBHs significantly influence the molecular gas in galaxies, which has a profound effect on star formation.

Basically, this theory holds that larger galaxies accumulate more gas, thus resulting in more stars and a more massive central black hole. At the same time, there is a feedback mechanism, where growing black holes accrete more matter on themselves. This results in them sending out a tremendous amount of energy in the form of radiation and particle jets, which is believed to curtail star formation in their vicinity.

However, when observing an infrared (IR)-bright dust-obscured galaxy (DOG) – WISE1029+0501 – Yoshiki and his colleagues obtained results that contradicted this notion. After conducting a detailed analysis using ALMA, the team found that there were no signs of significant molecular gas outflow coming from WISE1029+0501. They also found that star-forming activity in the galaxy was neither more intense or suppressed.

This indicates that a strong ionized gas outflow coming from the SMBH in WISE1029+0501 did not significantly affect the surrounding molecular gas or star formation. As Dr. Yoshiki Toba explained, this result:

“[H]as made the co-evolution of galaxies and supermassive black holes more puzzling. The next step is looking into more data of this kind of galaxies. That is crucial for understanding the full picture of the formation and evolution of galaxies and supermassive black holes”.

Emission from Carbon Monoxide (Left) and Cold Dust (Right) in WISE1029 Observed by ALMA (image). Credit: ALMA (ESO/NAOJ/NRAO), Toba et al.

This not only flies in the face of conventional wisdom, but also in the face of recent studies that showed a tight correlation between the mass of central black holes and those of their host galaxies. This correlation suggests that supermassive black holes and their host galaxies evolved together over the course of the past 13.8 billion years and closely interacted as they grew.

In this respect, this latest study has only deepened the mystery of the relationship between SMBHs and their galaxies. As Tohru Nagao, a Professor at Ehime University and a co-author on the study, indicated:

“[W]e astronomers do not understand the real relation between the activity of supermassive black holes and star formation in galaxies. Therefore, many astronomers including us are eager to observe the real scene of the interaction between the nuclear outflow and the star-forming activities, for revealing the mystery of the co-evolution.”

The team selected WISE1029+0501 for their study because astronomers believe that DOGs harbor actively growing SMBHs in their nuclei. In particular, WISE1029+0501 is an extreme example of galaxies where outflowing gas is being ionized by the intense radiation from its SMBH. As such, researchers have been highly motivated to see what happens to this galaxy’s molecular gas.

Artist’s impression of the black hole wind at the center of a galaxy. Credit: ESA

The study was made possible thanks to ALMA’s sensitivity, which is excellent when it comes to investigating the properties of molecular gas and star-forming activity in galaxies. In fact, multiple studies have been conducted in recent years that have relied on ALMA to investigate the gas properties and SMBHs of distant galaxies.

And while the results of this study contradict widely-held theories about galactic evolution, Yoshiki and his colleagues are excited about what this study could reveal. In the end, it may be that radiation from a SMBH does not always affect the molecular gas and star formation of its host galaxy.

“[U]nderstanding such co-evolution is crucial for astronomy,” said Yoshiki. “By collecting statistical data of this kind of galaxies and continuing in more follow-up observations using ALMA, we hope to reveal the truth.”

Further Reading: ALMA Observatory, Astrophysical Journal

SpaceX Launches the First of Thousands of Space Internet Satellites, but Didn’t Quite Catch the Fairing

SpaceX Falcon 9 booster stationed at Launch Complex 4 East (SLC-4E) at the Vandenburg Air Force Base. Credit: SpaceX

After multiple delays, SpaceX’s PAZ mission launched from from Space Launch Complex 4 East (SLC-4E) at Vandenburg Air Force Base on the morning of Thursday, February 22nd. Shortly after it reached orbit, the rocket deployed its payload (the PAZ Earth Observing satellite) as well as and two Starlink demonstrations satellites that will test SpaceX’s ability to provide broadband internet service from orbit.

In addition, this launch was the first time that SpaceX would be attempting to “catch” the payload fairings from a Falcon 9 rocket using a retrieval ship. As part of their plan to make their rockets fully reusable, the rocket’s fairings were equipped with deployable chutes that would control their descent to the Pacific Ocean. Once there, the newly-commissioned “Mr. Steven” retrieval ship would be waiting to catch them in its net.

As noted, the primary mission for this launch was the deployment of the the PAZ satellite to low-Earth orbit. This  synthetic-aperture radar satellite was commisioned by Hisdesat, a Spanish commercial satellite company, for governmental and commercial use. Its purpose s to generate high-resolution images of the Earth’s surface, regardless of whether there are clouds covering the ground.

https://www.instagram.com/p/BfgHKDNAplx/

The secondary payload consisted of two experimental satellites  – Microsat-2a and 2b – which are the first phase in SpaceX’s plan to deliver broadband internet service to the entire world. The plan calls for the deployment of more satellites in phases, reaching a total of 4,000 by 2024. However, it was the attempted retrieval of the rocket’s payload fairings that was of particular interest during the launch.

To be fair, this would not be the first time that SpaceX’s attempted to retrieve payload fairings. In March of 2017, SpaceX successfully recovered the fairings for one of their Falcon 9s, which allowed them to recoup an estimated $6 million dollars from that launch. At present, SpaceX indicates that the cost of an individual Falcon 9 launch is estimated to be around $62 million.

If the payload fairings could be recovered regularly, that means that the company could stand to recoup an additional 10% from every individual Falcon 9 launch. These additional savings would not only make the company more competitive, but could allow for additional mission profiles that are currently considered too expensive.

On Thursday Morning, SpaceX founder Elon Musk posted a picture of Mr. Steven taking to sea on Instagram with the following statement:

“Going to try to catch the giant fairing (nosecone) of Falcon 9 as it falls back from space at about eight times the speed of sound. It has onboard thrusters and a guidance system to bring it through the atmosphere intact, then releases a parafoil and our ship with basically a giant catcher’s mitt welded on tries to catch it.”

The launch, which was covered via webcast, went as planned. After taking off amid clear skies, the Falcon 9 reached orbit and deployed the PAZ satellite without incident, and the two Starlink satellites were deployed shortly thereafter. However, the webcast ended without providing any information about the status of the retrieval of the payload fairings.

At 7:14 am, Musk tweeted an update about the attempted retrieval, indicating that the fairings had landed in the ocean a few hundred meters from where Mr. Steven was waiting to catch them. While unsuccessful, Musk was optimistic about future attempts to retrieve payload fairings, saying:

“Missed by a few hundred meters, but fairing landed intact in water. Should be able catch it with slightly bigger chutes to slow down descent.”

As always, Musks seems undeterred by a setback and the company is moving ahead with its plans for expanded reusability. If successful, future attempts at retrieval are likely to involve the second stages of the Falcon 9 and Falcon Heavy rockets. Given all the possibilities that this will allow for, there are many who want to see Musk’s latest venture to succeed.

In the meantime, check out this webcast of the launch:

Further Reading: ArsTechnica

Here’s How SpaceX is Planning to Recover Rocket Fairings: a Boat With a Net Called Mr. Steven

"Mr. Steven", SpaceX's platform for retrieving fairings, is taking to sea. Credit: Pauline Acalin/Teslarati

When visionary entrepreneur Elon Musk founded SpaceX in 2002, he did so with the intention of rekindling human space exploration and sending humans to Mars. Intrinsic to this vision was the reduction of costs associated with individual launches, which has so far been focused on the development of reusable first-stage rockets. However, the company recently announced that they are looking to make their rocket’s payload fairings reusable as well.

The payload fairing is basically the disposable shell at the top of the rocket that protects the cargo during launch. Once the rocket reaches orbit, the fairings falls away to release the payload to space and are lost. But if they could be retrieved, it would reduce launch cost by additional millions. Known as “Mr. Steven”, this new retrieval system consists of a platform ship, extended arms, and a net strung between them.

Mr. Steven is not unlike SpaceX’s Autonomous Spaceport Drone Ships (ASDS), which are used to retrieve first stage rocket boosters at sea. SpaceX has two operational drone ships, including Just Read the Instructions – which is stationed in the Pacific to retrieve launches from Vandenberg – and Of Course I Still Love You, which is stationed in the Atlantic to retrieve launches from Canaveral.

The first ten IridiumNEXT satellites are stacked and encapsulated in the Falcon 9 fairing for launch from Vandenberg Air Force Base, Ca., in early 2017. Credit: Iridium

Recently, Teslarati’s Pauline Acalin captured some photographs of Mr. Steven while it was docked on the California coast near Vandenberg Air Force Base, where it preparing to head out to sea in support of the latest Falcon 9 launch. Known as the PAZ Mission, this launch will place a series of Spanish imaging satellites in orbit, as well as test satellites that will be part of SpaceX’s plan to provide broadband internet service.

Originally scheduled for Wednesday, February 21st, the launch was scrubbed due to strong upper level winds. It is currently scheduled to take place at 6:17 a.m. PST (14:17 UTC) on Thursday, February 22nd, from Space Launch Complex 4 East (SLC-4E) at the Vandenburg Air Force Base. After the cargo is deployed to orbit, the fairings will fall back slowly to Earth thanks to a set of geotagged parachutes.

These chutes will guide the fairings down to the Pacific Ocean, where Mr. Steven will sail to meet them. The fairings, if all goes as planned, will touch down gently into the net and be recovered for later use. In March of 2017, SpaceX successfully recovered a fairing for the first time, which allowed them to recoup an estimated $6 million dollars from that launch.

At present, SpaceX indicates that the cost of an individual Falcon 9 launch is an estimated $62 million. If the payload fairings can be recovered regularly, that means that the company stands to recoup an additional 10% of every individual Falcon 9 launch.

This news comes on the heels of SpaceX having successfully launched their Falcon Heavy rocket, which carried a Tesla Roadster with “Spaceman” into orbit. The launch was made all the more impressive due to the fact that two of the three rocket boosters used were successfully recovered. The core booster unfortunately crashed while attempted to land on one of the ASDS at sea.

At this rate, SpaceX may even start trying to recover their rocket’s second stages in the not-too-distant future. If indeed all components of a rocket are reusable, the only costs associated with individual launches will be the one-time manufacturing cost of the rocket, the cost of fuel, plus any additional maintenance post-launch.

For fans of space exploration and commercial aerospace, this is certainly exciting news! With every cost-cutting measure, the possibilities for scientific research and crewed missions increase exponentially. Imagine a future where it costs roughly the same to deploy space habitats to orbit as it does to deploy commercial satellites, and sending space-based solar arrays to orbit (and maybe even building a space elevator) is financially feasible!

It might sound a bit fantastic, but when the costs are no longer prohibitive, a lot of things become possible.

Further Reading: Teslatari, TechCrunch

Some of The Last Glaciers in The Tropics. They’ll be Gone in About a Decade

Side by side comparison of images taken of the Puncak Jaya icefields in New Guinea on Nov. 3rd, 1988 (left) and Dec. 5th, 2017 (right). Credit: NASA/EO

One of the most visible signs of Climate Change are the ways in which glaciers and ice sheets have been disappearing all over the world. This trend is not reserved to the Arctic ice cap or the Antarctic Basin, of course. On every part of the planet, scientists have been monitoring glaciers that have been shrinking in the past few decades to determine their rate of loss.

These activities are overseen by NASA’s Earth Observatory, which relies on instruments like the Landsat satellites to monitor seasonal ice losses from orbit. As these satellites demonstrated with a series of recently released images, the Puncak Jaya ice sheets on the south pacific island of Papua/New Guinea have been receding in the past three decades, and are at risk of disappearing in just a decade.

The Papau province of New Guinea has a very rugged landscape that consists of the mountains that make up Sudirman Range. The tallest peaks in this range are Puncak Jaya and Ngga Pulu, which stand 4,884 meters (16,020 feet) and 4,862 meters (15,950 feet) above sea level, respectively. Despite being located in the tropics, the natural elevation of these peaks allows them to sustain small fields of “permanent” ice.

Image of the Puncak Jaya icefields, taken on Nov 3, 1988. Credit: NASA/EO

Given the geography, these ice fields are incredibly rare. In fact, within the tropics, the closest glacial ice is found 11,200 km (6,900 mi) away on Mount Kenya in Africa. Otherwise, one has to venture north for about 4,500 km (2,800 mi) to Mount Tate in central Japan, where glacial ice is more common since it is much farther away from the equator.

Sadly, these rare glaciers are becoming more threatened with every passing year. Like all tropical glaciers in the world today, the glaciers on the slopes around Puncak Jaya have been shrinking at a such a rate that scientists estimate that they could be gone within a decade. This was illustrated by a pair of Landsat images that show how the ice fields have shrunk over the past thirty years.

The first of these images (shown above) was acquired on November 3rd, 1988, by the Thematic Mapper instrument aboard the Landsat 5 satellite. The second image (shown below) was acquired on December 5th, 2017, by the Operational Land Imager (OLI) on the Landsat 8 satellite. These false-color images are a combination of shortwave infrared, infrared, near-infrared, and red light.

The extent of the ice fields are shown in light blue, whereas rocky areas are represented in brown, vegetation in green, and clouds in white. The gray circular area near the center of the 2017 image is the Grasberg mine, the largest gold and second-largest copper mine in the world. This mine expanded considerably between the 1980s and 2000s are a result of a boom in copper prices.

Image of the Puncak Jaya icefields in New Guinea, taken on December 5, 2017. Credit: NASA/EO

As the images show, in 1988, there were five masses of ice resting on the mountain slopes – the Meren, Southwall, Carstensz, East Northwall Firn and West Northwall Firn glaciers. However, by 2017, only the Carstensz and a small portion of the East Northwall Firn glaciers remained. As Christopher Shuman, a research professor at the University of Maryland Baltimore County and NASA’s Goddard Space Flight Center, explained:

“The ice area losses since the 1980s here are quite striking, visible in the contrast of the blue ice with the reddish bedrock. Even though the area still gets snowfalls, it is clearly not sustaining these glacial remnants.”

Similarly, in 2009, images taken by Landsat 5 of these same glaciers (see below) indicated that the Meren and Southwall glaciers had disappeared. Meanwhile, the Carstensz, East Northwall Firn and West Northwall Firn glaciers had retreated dramatically. Based on the rate of loss, scientists estimated at the time that all of Puncak Jaya’s glaciers would be gone within 20 years.

As these latest images demonstrate, their estimates were right on the money. At their current rate, what remains of the Carstensz and East Northwall Firn glaciers will be gone by the late 2020s. The primary cause of the ice loss is rising air temperatures, which leads to rapid sublimation. However, changes in humidity levels, precipitation patterns and cloudiness can also have an impact.

Image of the Puncak Jaya icefields in New Guinea, October 9, 2009. Credit: NASA/EO

Humidity is also important, since it affects how readily glaciers can lose mass directly to the atmosphere. Where the air is more moist, ice is able to make the transition to water more easily, and can be returned to the glacier in the form of precipitation. Where the air is predominately dry, ice makes the transition directly from a solid form to a gaseous form (aka. sublimation).

Temperature and precipitation are also closely linked to ice loss. Where temperatures are low enough, precipitation takes the form of snow, which can sustain glaciers and cause them to grow. Rainfall, on the other hand, will cause ice sheets to melt and recede. And of course, clouds affect how much sunlight reaches the glacier’s surface, which results in warming and sublimation.

For many tropical glaciers, scientists are still working out the relative importance of these factors and attempting to determine to what extent anthropogenic factors plays a role. In the meantime, tracking how these changes are leading to ice loss in the tropical regions provides scientists with a means of comparison when studying ice loss in other parts of the world.

As Andrew Klein, a geography professor at Texas A & M University who has studied the region, explained:

“Glacier recession continues in the tropics—these happen to be the last glaciers in the eastern tropics. Fortunately, the impact will be limited given their small size and the fact that they do not represent a significant water resource.”

Satellites continue to play an important role in the monitoring process, giving scientist the ability to map glacier ice loss, map seasonal changes, and draw comparisons between different parts on the planet. They also allow scientists to monitor remote and inaccessible areas of the planet to see how they too are being affected. Last, but not least, they allow scientists to estimate the timing of a glacier’s disappearance.

Click on the posted images to enlarge the ice fields, or follow these link to see image comparisons.

Further Reading: NASA Earth Observatory

OSIRIS-REx Sends Home an Image of the Earth and Moon

Image of the Earth-Moon system, taken by the OSIRIS-REx spacecraft on Jan. 17th 2018. Credit: NASA/Goddard/University of Arizona/Lockheed Martin

On September 8th. 2016, NASA’s Origins, Spectral Interpretation, Resource Identification, Security, Regolith Explorer (OSIRIS-REx) launched from Earth to rendezvous with the asteroid 101955 Bennu. This mission will be the first American robotic spacecraft to rendezvous with an asteroid, which it will reach by December of 2018, and return samples to Earth for analysis (by September 24th, 2023).

Since that time, NASA has been keeping the public apprised of the mission’s progress, mainly by sending back images taken by the spacecraft. The latest image was one of the Earth and Moon, which the spacecraft took using its NavCam 1 imager on January 17th, 2018. As part of an engineering test, this image shows just how far the probe has ventured from Earth.

Image of the Earth-Moon system, taken by the OSIRIS-REx spacecraft on Jan. 17th 2018. Credit: NASA/Goddard/University of Arizona/Lockheed Martin

The image was taken when the spacecraft was at a distance of 63.6 million km (39.5 million mi) from the Earth and Moon. When the camera acquired the image, the spacecraft was moving at a speed of 8.5 km per second (19,000 mph) away from Earth. Earth can be seen in the center of the image as the brightest of the two spots while the smaller, dimmer Moon appears to the right.

Several constellations are also visible in the surrounding space, including the Pleiades cluster in the upper left corner. Hamal, the brightest star in Aries, is also visible in the upper right corner of the image. Meanwhile, the Earth-Moon system is nestled between the five stars that make up the head of Cetus the Whale.

This is merely the latest in a string of photographs that show how far OSIRIS-REx has ventured from Earth. On October 2nd, 2017, the probe’s MapCam instrument took a series of images of the Earth and Moon while the probe was at a distance of 5 million km (3 million mi) – about 13 times the distance between the Earth and the Moon. NASA then created a composite image to create a lovely view of the Earth-Moon system (see below).

The Earth-Moon system, as imaged by NASA’s OSIRIS-REx mission. Credit: NASA/OSIRIS-REx team and the University of Arizona

On September 22nd, 2017, the probe also snapped a “Blue Marble” image of Earth (seen below) while it was at a distance of just 170,000 km (106,000 mi). The image was captured just a few hours after OSIRIS-REx had completed its critical Earth Gravity Assist (EGA) maneuver, which slung it around the Earth and on its way towards the asteroid Bennu for its scheduled rendezvous in December of 2018.

On both of these occasions, the images were taken by the probe’s MapCam instrument, a medium-range camera designed to capture images of outgassing around Bennu and help map its surface in color. The NavCam 1 instrument, by contrast, is a grayscale imager that is part of Touch-And-Go Camera System (TAGCAMS) navigation camera suite.

A color composite image of Earth taken on Sept. 22, 2017 by the MapCam camera on NASA’s OSIRIS-REx spacecraft just hours after the spacecraft completed its Earth Gravity Assist at a range of approximately 106,000 miles (170,000 kilometers). Credit: NASA/Goddard/University of Arizona

The design, construction and testing of this instrument was carried out by Malin Space Science Systems, and Lockheed Martin is responsible for its operation. By the time OSIRIS-REx begins to approach asteroid Bennu in December of 2018, we can expect that the probes cameras will once again be busy.

However, by this time, they will be turned towards its destination. As it nears Bennu, its cameras will need to be calibrated yet again by snapping images of the asteroid on approach. And we, the public, can expect that more beautiful composite images will be shared as a result.

Further Reading: NASA