Engineers Develop a Whole New Way to Use Curiosity’s Drill After a Recent Hardware Failure

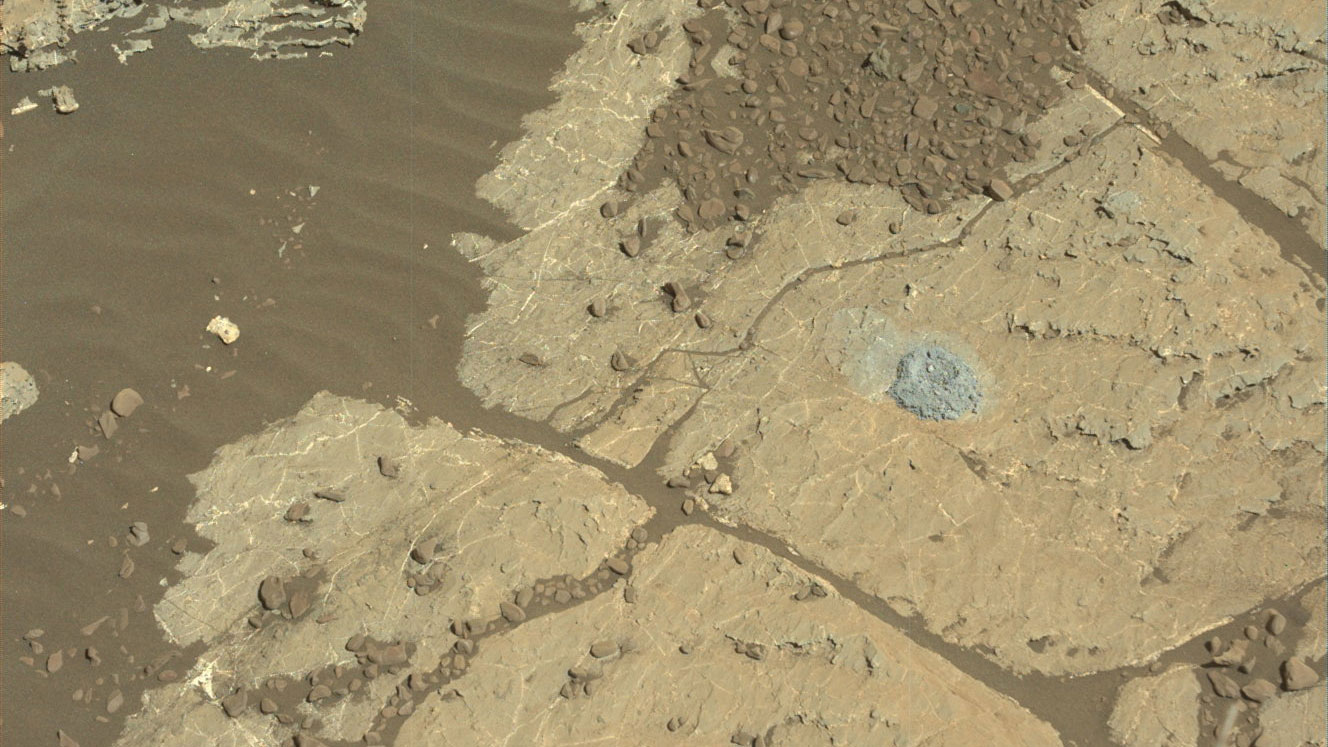
NASA's Curiosity Mars rover used a new drill method to produce a hole on February 26 in a target named Lake Orcadie. The hole marks the first operation of the rover's drill since a motor problem began acting up more than a year ago. Credit: NASA/JPL-Caltech/MSSS

Since it landed on Mars in 2012, the Curiosity rover has used its drill to gather samples from a total of 15 sites. These samples are then deposited into two of Curiosity’s laboratory instruments – the Sample Analysis at Mars (SAM) or the Chemistry and Mineralogy X-ray Diffraction (CheMin) instrument – where they are examined to tell us more about the Red Planet’s history and evolution.

Unfortunately, in December of 2016, a key part of the drill stopped working when a faulty motor prevented the bit from extending and retracting between its two stabilizers. After managing to get the bit to extend after months of work, the Curiosity team has developed a new method for drilling that does not require stabilizers. The new method was recently tested and has been proven to be effective.

The new method involves freehand drilling, where the drill bit remains extended and the entire arm is used to push the drill forward. While this is happening, the rover’s force sensor – which was originally included to stop the rover’s arm if it received a high-force jolt – is used to takes measurements. This prevents the drill bit from drifting sideways and getting stuck in rock, as well as providing the rover with a sense of touch.
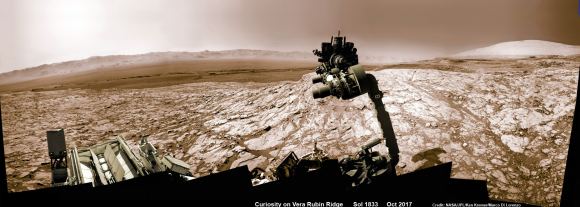
NASA’s Curiosity rover raised robotic arm with drill pointed skyward while exploring Vera Rubin Ridge at the base of Mount Sharp inside Gale Crater – backdropped by distant crater rim. Credit: NASA/JPL/Ken Kremer/kenkremer.com/Marco Di Lorenzo

The test drill took place at a site called Lake Orcadie, which is located in the upper Vera Rubin Ridge – where Curiosity is currently located. The resulting hole, which was about 1 cm (half an inch) deep was not enough to produce a scientific sample, but indicated that the new method worked. Compared to the previous method, which was like a drill press, the new method is far more freehand.

As Steven Lee, the deputy project manager of the Mars Science Laboratory at NASA’s Jet Propulsion Laboratory, explained:

“We’re now drilling on Mars more like the way you do at home. Humans are pretty good at re-centering the drill, almost without thinking about it. Programming Curiosity to do this by itself was challenging — especially when it wasn’t designed to do that.”

This new method was the result of months of hard work by JPL engineers, who practiced the technique using their testbed – a near-exact replica of Curiosity. But as Doug Klein of JPL, one of Curiosity’s sampling engineers, indicated, “This is a really good sign for the new drilling method. Next, we have to drill a full-depth hole and demonstrate our new techniques for delivering the sample to Curiosity’s two onboard labs.”
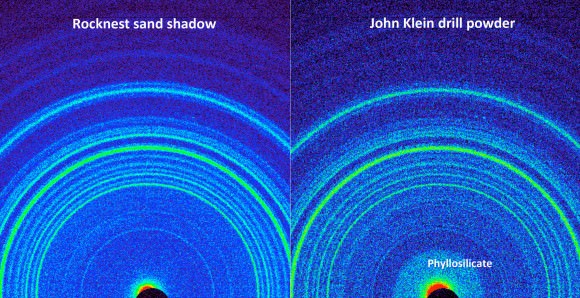
This side-by-side comparison shows the X-ray diffraction patterns of two different samples collected from the Martian surface by NASA’s Curiosity rover, as obtained by Curiosity’s Chemistry and Mineralogy instrument (CheMin). Credit: NASA/JPL-Caltech/Ames

Of course, there are some drawbacks to this new method. For one, leaving the drill in its extended position means that it no longer has access to the device that sieves and portions rock powder before delivering it to the rover’s Collection and Handling for In-Situ Martian Rock Analysis (CHIMRA) instrumet. To address this, the engineers at JPL had to invent a new way to deposit the powder without this device.

Here too, the engineers at JPL tested the method here on Earth. It consists of the drill shaking out the grains from its bit in order to deposit the sand directly in the CHIMRA instrument. While the tests have been successful here on Earth, it remains to be seen if this will work on Mars. Given that both atmospheric conditions and gravity are very different on the Red Planet, it remains to be seen if this will work there.

This drill test was the first of many that are planned. And while this first test didn’t produce a full sample, Curiosity’s science team is confident that this is a positive step towards the resumption of regular drilling. If the method proves effective, the team hopes to collect multiple samples from Vera Rubin Ridge, especially from the upper side. This area contains both gray and red rocks, the latter of which are rich in minerals that form in the presence of water.

Samples drilled from these rocks are expected to shed light on the origin of the ridge and its interaction with water. In the days ahead, Curiosity’s engineers will evaluate the results and likely attempt another drill test nearby. If enough sample is collected, they will use the rover’s Mastcam to attempt to portion the sample out and determine how much powder can be shaken from the drill bit.

Further Reading: NASA

Saturn Photobombs a Picture of the Martian Moon Phobos

This image of Deimos and Saturn was taken by the Super Resolution Channel of Mars Express’ High Resolution Stereo Camera. Credit: ESA/DLR/FU Berlin

The ESA’s Mars Express probe has been studying Mars and its Moons for many years. While there are several missions currently in orbit around Mars, Mars Express‘s near-polar elliptical orbit gives it some advantages over the others. For one, its orbital path takes it closer to Phobos than any other spacecraft, which allows it to periodically observe the moon from distances of around 150 km (93 mi).

Because of this, the probe is in an ideal position to study Mars’ moons and capture images of them. On occasion, this allows for some interesting photo opportunities. For example, in November of 2017, while taking pictures of Phobos and Deimos, the probe spotted Saturn in the background. This fortuitous event led to the creation of some beautiful images, which were put together to produce a video.

Since 2003, Mars Express has been studying Phobos and Deimos in the hopes of learning more about these mysterious objects. While it has learned much about their size, appearance and position, much remains unknown about their composition, how and where they formed, and what their surface conditions are like. To answer these questions, the probe has been conducting regular flybys of these moons and taking pictures of them.

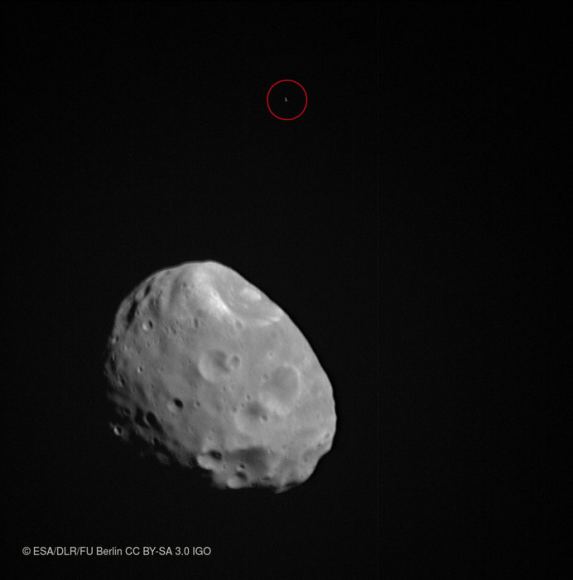
Phobos and background star (circled in red). Credit: ESA/DLR/FU Berlin

The video that was recently released by the ESA combines 30 such images which show Phobos passing through the frame. In the background, Saturn is visible as a small ringed dot, despite being roughly 1 billion km away.  The images that were used to create this video were taken by the probes High Resolution Stereo Camera on November 26th, 2016, while the probe was traveling at a speed of about 3 km/s.

This photobomb was not unexpected, since the Mars Express repeatedly uses background reference stars and other bodies in the Solar System to confirm positions of the moons in the sky. In so doing, the probe is able to calculate the position of Phobos and Deimos with an accuracy of up to a few kilometers. The probes ideal position for capturing detailed images has also helped scientists to learn more about the surface features and structure of the two moons.

For instance, the pictures taken during the probe’s close flybys of Phobos showed its bumpy, irregular and dimpled surface in detail.The moon’s largest impact crater – the Stickney Crater – is also visible in one of the frames. Measuring 9 km ( mi) in diameter, this crater accounts for a third of the moon’s diameter, making it one the largest impact craters relative to body size in the Solar System.

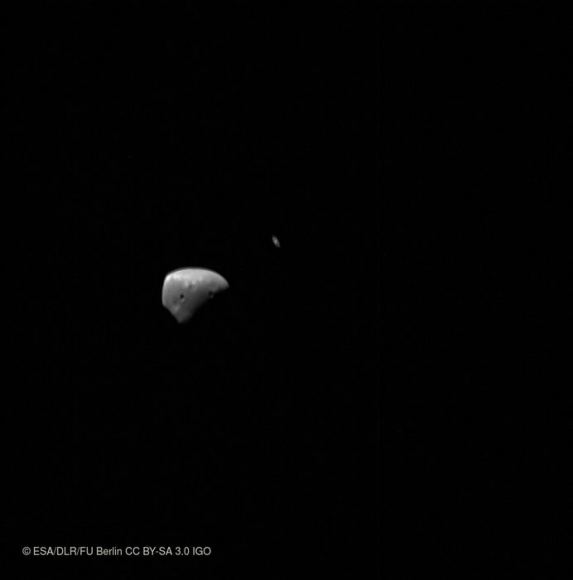
In another image, taken on January 15th, 2018, Deimos is visible as an irregular and partially shadowed body in the foreground, while the delicate rings of Saturn are just visible encircling the small dot in the background (see below). In addition, Mars Express also obtained images of Phobos set against a reference star on January 8th, 2018 (see above) and close-up images of Phobos’ pockmarked surface on September 12th, 2017.

This image of Deimos and Saturn was taken by the Super Resolution Channel of Mars Express’ High Resolution Stereo Camera. Credit: ESA/DLR/FU Berlin

In the future, the Mars Express probe is expected to reveal a great deal more about Mars’ system of moons. In addition to the enduring questions of their origins, formation and composition, there are also questions about where future missions could land in order to study the surface directly. In particular, Phobos has been considered for a possible landing and sample-return mission.

Because of its nearness to Mars and the fact that one side is always facing towards the planet, the moon could make for an ideal location for a permanent observation post. This post would allow for the long-term study of the Martian surface and atmosphere, could act as a communications relay for other spacecraft, and could even serve as a base for future missions to the surface.

If and when such a mission to Phobos becomes a reality, it is the Mars Express probe that will determine where the ideal landing site would be. In essence, by studying the Martian moons to learning more about them, Mars Express is helping to prepare future missions to the Red Planet.

Be sure to check out the time-lapse video of Phobos and Saturn, courtesy of the ESA:

Further Reading: ESA

The Biggest Airplane Taxis Down the Runway, By 2020 it Could Be Launching Rockets

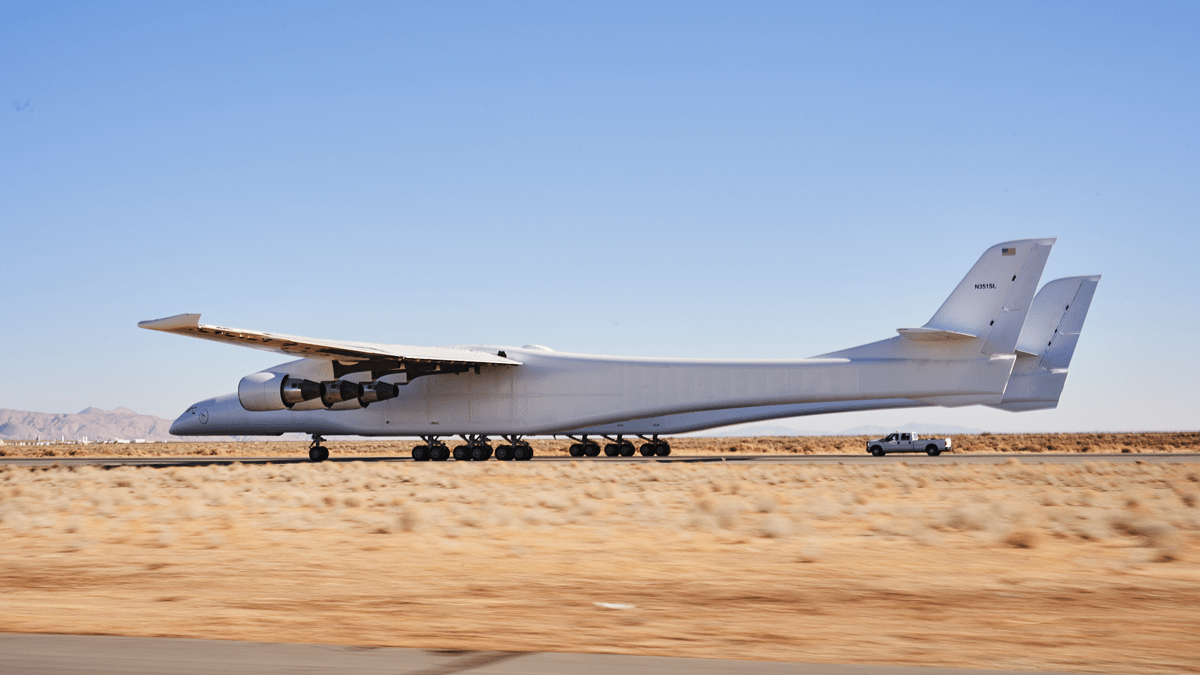
StratoLaunch's Roc aircraft performing taxi tests at the Mojave Air and Space Port. Credit: Stratolaunch Systems Corp

In 2011, Stratolaunch Systems was founded with a simple goal: to reduce the costs of rocket launches by creating the world’s largest air-launch-to-orbit system. Similar to Virgin Galactic’s SpaceShipTwo, this concept involves a large air carrier – Scaled Composites Model 351 (aka. the “Roc”) – deploying rockets from high altitudes so they can deliver small payloads to Low-Earth Orbit (LEO).

Recently, the aircraft reached a major milestone when it conducted its second taxi test at the Mojave Air and Space Port. The test consisted of the aircraft rolling down the runway at a speed of 74 km/h (46 mph) in preparation for its maiden flight. The event was captured on video and posted to twitter by Stratolaunch Systems (and Microsoft) co-founder Paul Allen, who was on hand for the event.

The Roc is essentially two 747 hulls mated together, making it the largest aircraft in the world – spanning 117 meters (385 ft) from one wingtip to the other and weighing 226,796 kg (500,000 lbs). It is powered by six Pratt & Whitney turbofan engines, giving it a maximum lift capacity of up to 249,476 kg (550,000 pounds). This would allow it to air-launch rockets that could deploy satellites to Low-Earth Orbit (LEO).

As with other alternatives to rocket launches, the concept of an air-launch-to-orbit system is a time-honored one. During the early days of the Space Race, NASA relied on heavy aircraft to bring experimental aircraft to high altitudes (like the Bell X-1) where they would then be deployed. Since that time, NASA has partnered with companies like Orbital ATK and the Virgin Group to develop such a system to launch rockets.

However, the process is still somewhat limited when it comes to what kinds of payloads can be deployed. For instance, Orbital ATK’s three-stage Pegasus rocket is capable of deploying only small satellites weighing up to 454 kg (1,000 pounds) to Low-Earth Orbit (LEO). Looking to accommodating heavier payloads, which could include space planes, StratoLaunch has created the heaviest commercial airlift craft in history.

Back on May 31st, 2017, the aircraft was presented to the world for the first time as it was rolled out of the company’s hangar facility at the Mojave Air and Space Port in California. This presentation also marked the beginning of several tests, which including fueling tests, engine runs, and a series of taxi tests. The engine testing took place in September, 19th, 2017, and involved the aircraft starting it’s six Pratt & Whitney turbofan engines.

The testing followed a build-up approach that consisted of three phases. First, there was the “dry motor” phase, where an auxiliary power unit charged the engines. This was followed by the “wet motor” phase, where fuel was introduced to the engines. In the final phase, the engines were started one at a time and were allowed to idle.

This test was followed in December 18th, 2017, with the aircraft conducting its first low-speed taxi test, where it traveled down the runway under its own power. The primary purpose of this was to test the aircraft’s ability to steer and stop, and saw the aircraft reach a maximum taxing speed of 45 km/h (28 mph). This latest test almost doubled that taxing speed and brought the aircraft one step closer to flight.

The aircraft’s maiden flight is currently scheduled to take place in 2019. If successful, the Roc could be conducted regular satellite runs within a few years time, helping to fuel the commercialization of LEO. Alongside companies like SpaceX, Blue Origin, and the Virgin Group, StratoLaunch will be yet another company that is making space more accessible.

Further Reading: The Verge

Did the Milky Way Steal These Stars or Kick Them Out of the Galaxy?

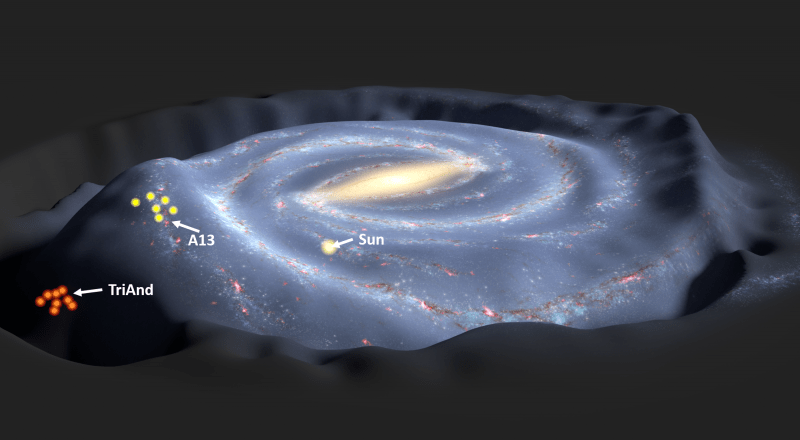
The Milky Way galaxy, perturbed by the tidal interaction with a dwarf galaxy, as predicted by N-body simulations. The locations of the observed stars above and below the disk, which are used to test the perturbation scenario, are indicated. Credit: T. Mueller/C. Laporte/NASA/JPL-Caletch

Despite thousands of years of research and observation, there is much that astronomers still don’t know about the Milky Way Galaxy. At present, astronomers estimate that it spans 100,000 to 180,000 light-years and consists of 100 to 400 billion stars. In addition, for decades, there have been unresolved questions about how the structure of our galaxy evolved over the course of billions of years.

For example, astronomers have long suspected that galactic halo came from – giant structures of stars that orbit above and below the flat disk of the Milky Way – were formed from debris left behind by smaller galaxies that merged with the Milky Way. But according to a new study by an international team of astronomers, it appears that these stars may have originated within the Milky Way but were then kicked out.

The study recently appeared in the journal Nature under the title “Two chemically similar stellar overdensities on opposite sides of the plane of the Galactic disk“. The study was led by Margia Bergmann, a researcher from the Max Planck Institute for Astronomy, and included members from the Australian National University, the California Institute of Technology, and multiple universities.

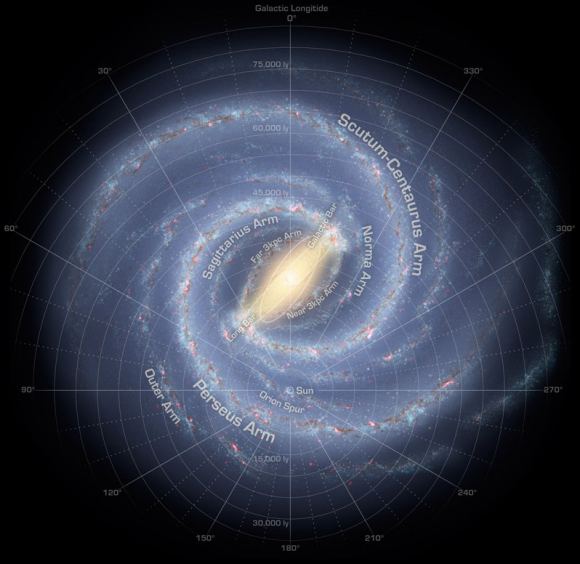
Artist’s impression of the Milky Way Galaxy. Credit: NASA/JPL-Caltech/R. Hurt (SSC-Caltech)

For the sake of their study, the team relied on data from the W.M. Keck Observatory to determine the chemical abundance patterns from 14 stars located in the galactic halo. These stars were located in two different halo structures – the Triangulum-Andromeda (Tri-And) and the A13 stellar overdensities – which are bout 14,000 light years above and below the Milky Way disc.

As Bergemann explained in a Keck Observatory press release:

“The analysis of chemical abundances is a very powerful test, which allows, in a way similar to the DNA matching, to identify the parent population of the star. Different parent populations, such as the Milky Way disk or halo, dwarf satellite galaxies or globular clusters, are known to have radically different chemical compositions. So once we know what the stars are made of, we can immediately link them to their parent populations.”

The team also obtained spectra from one additional using the European Southern Observatory’s Very Large Telescope (VLT) in Chile. By comparing the chemical compositions of these stars with the ones found in other cosmic structures, the scientists noticed that the chemical compositions were almost identical. Not only were they similar within and between the groups being studies, they closely matched the abundance patterns of stars found within the Milky Way’s outer disk.

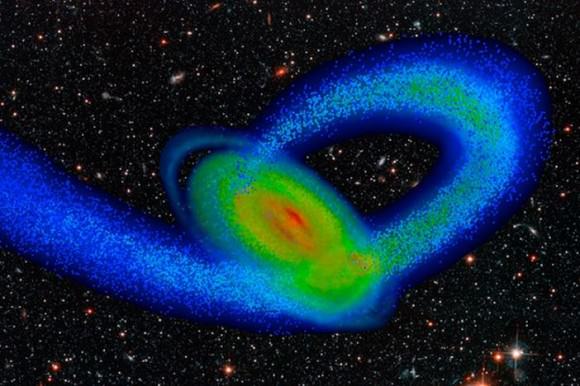
Computer model of the Milky Way and its smaller neighbor, the Sagittarius dwarf galaxy. Credit: Tollerud, Purcell and Bullock/UC Irvine

From this, they concluded that these stellar population in the Galactic Halo were formed in the Milky Way, but then relocated to locations above and below the Galactic Disk. This phenomena is known as “galactic eviction”, where structures are pushed off the plane of the Milky Way when a massive dwarf galaxy passes through the galactic disk. This process causes oscillations that eject stars from the disk, in whichever the dwarf galaxy is moving.

“The oscillations can be compared to sound waves in a musical instrument,” added Bergemann. “We call this ‘ringing’ in the Milky Way galaxy ‘galactoseismology,’ which has been predicted theoretically decades ago. We now have the clearest evidence for these oscillations in our galaxy’s disk obtained so far!”

These observations were made possible thanks to the High-Resolution Echelle Spectrometer (HiRES) on the Keck Telescope. As Judy Cohen, the Kate Van Nuys Page Professor of Astronomy at Caltech and a co-author on the study, explained:

“The high throughput and high spectral resolution of HIRES were crucial to the success of the observations of the stars in the outer part of the Milky Way. Another key factor was the smooth operation of Keck Observatory; good pointing and smooth operation allows one to get spectra of more stars in only a few nights of observation. The spectra in this study were obtained in only one night of Keck time, which shows how valuable even a single night can be.”

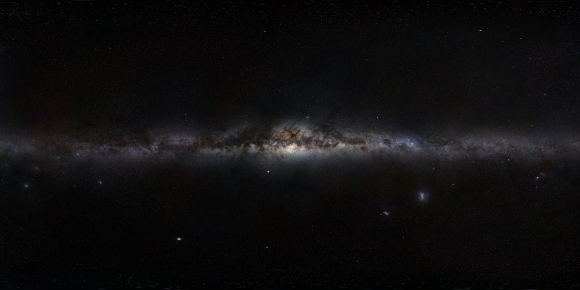
360-degree panorama view of the Milky Way (an assembled mosaic of photographs) by ESO. Credit: ESO/S. Brunier

These findings are very exciting for two reasons. On the one hand, it demonstrates that halo stars likely originated in the Galactic think disk – a younger part of the Milky Way. On the other hand, it demonstrates that the Milky Way’s disk and its dynamics are much more complex than previously thought. As Allyson Sheffield of LaGuardia Community College/CUNY, and a co-author on the paper, said:

“We showed that it may be fairly common for groups of stars in the disk to be relocated to more distant realms within the Milky Way – having been ‘kicked out’ by an invading satellite galaxy. Similar chemical patterns may also be found in other galaxies, indicating a potential galactic universality of this dynamic process.”

As a next step, the astronomers plan to analyze the spectra of additional stars in the Tri-And and A13 overdensities, as well as stars in other stellar structures further away from the disk. They also plan to determine masses and ages of these stars so they can constrain the time limits of when this galactic eviction took place.

In the end, it appears that another long-held assumption on galactic evolution has been updated. Combined with ongoing efforts to probe the nuclei of galaxies – to see how their Supermassive Black Holes and star formation are related – we appear to be getting closer to understanding just how our Universe evolved over time.

Further Reading: W.M. Keck Observatory, Nature

Space Catapult Startup SpinLaunch has Come Out of Stealth Mode. Space catapults? Yes Please

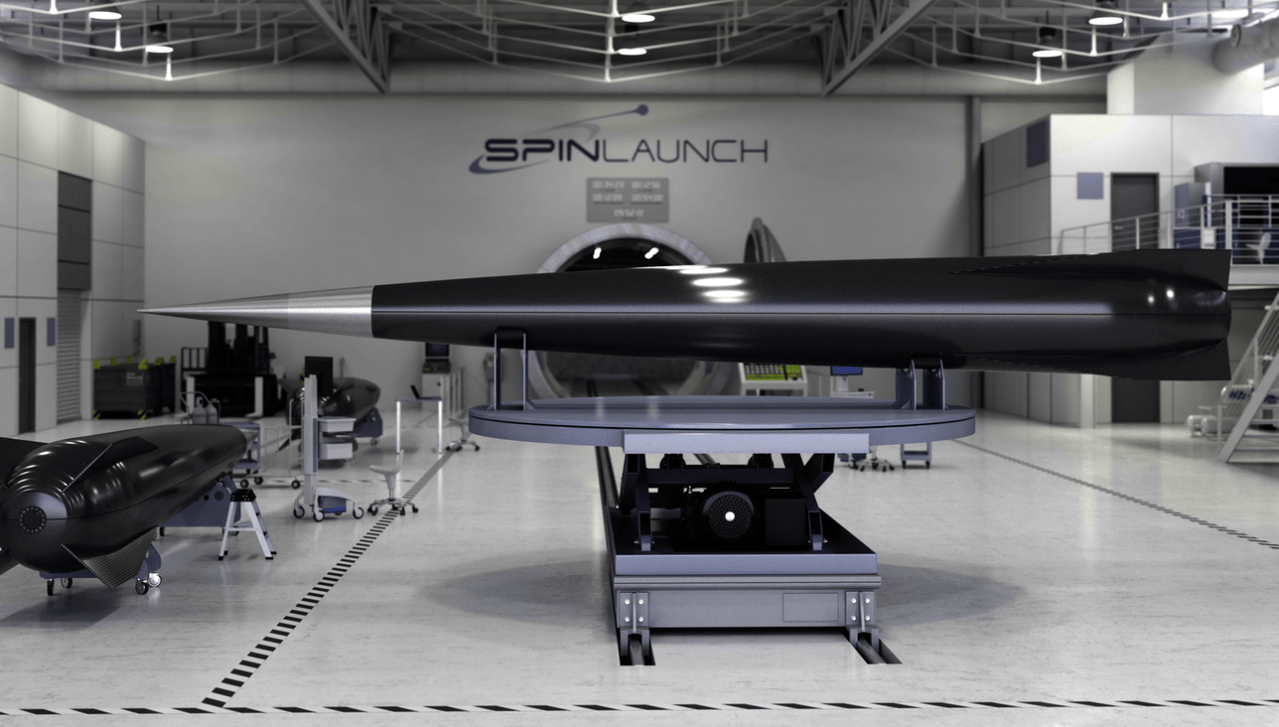
SpinLaunch's company hangar. Credit: SpinLaunch

Of all challenges presented by space exploration – and to be fair, there are many! – one of the greatest is the cost. When it comes right down to it, launching disposable rockets from Earth and getting them to the point where they can achieve escape velocity and reach space is expensive. In addition, these rockets need to be big, powerful and hold a lot of fuel to lift spacecraft or cargo.

For this reason, so many efforts in the past few decades have been focused on reducing the cost of individual launches. There are many ways to make launch vehicles cheaper, ranging from reusable rockets to reusable spacecraft (i.e., the Space Shuttle). But to Jonathan Yaney, the founder of SpinLaunch, a real cost-cutting solution is to propel smaller payloads into orbit using a space catapult instead.

The concept of a space catapult is simple and has been explored at length since the dawn of the Space Age. Also known as a mass driver or coilgun, the concept relies on a set of powerful electromagnetic rails to accelerate spacecraft or payloads to escape velocity and launch them horizontally. Since the 1960s, NASA has been exploring the concept as an alternative to conducting rocket launches.

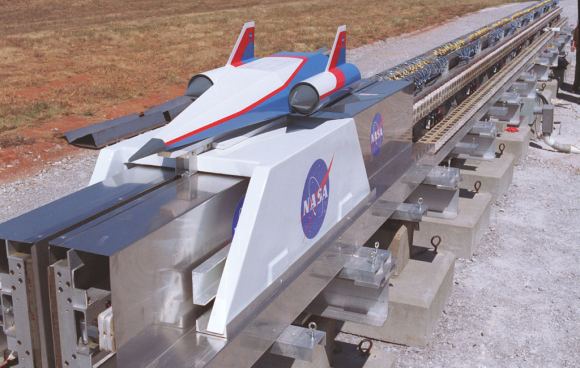
The Magnetic Levitation (MagLev) System is being evaluated at NASA’s Marshall Space Flight Center. Credit: NASA

In addition, NASA has continued developing this technology through the Marshall Space Flight Center and the Kennedy Space Center. Here, engineers have been working on ways to launch spacecraft horizontally using scramjets on an electrified track or gas-powered sled. A good example of this is the Magnetic Levitation (MagLev) System which uses the same technology as a maglev train to accelerate a small space plane into orbit.

Another variation on the concept involves a centrifuge, where the spacecraft or cargo is accelerated on a circular track until it reaches escape velocity (and then launches). This concept was proposed by Dr. Derek Tidman – a physicist who specialized in electrothermal and electromagnetic acceleration – in the 1990s. Known as the Slingatron, this version of the space catapult is currently being researched by HyperV Technologies.

However, these ideas were never adopted because vast improvements in electromagnetic induction technology were needed to achieve the speed necessary to put heavy payloads into space. But thanks to advancements in high-speed maglev trains, recent attempts to create Hyperloop pods and tracks, and the growth of the commercial aerospace market, the time may be ripe to revisit this concept.

Such is the hope of Jonathan Yaney, an aerospace enthusiast with a long history of co-founding startups. As he describes himself, Yaney is a “serial entrepreneur” who has spent the past 15 years founding companies in the fields of consulting, IT, construction, and aerospace. Now, he has established SpinLaunch for the sake of launching satellites into space.

SpinLaunch’s company logo. Credit: SpinLaunch

And while Yaney has been known for being rather recluse, TechCrunch recently secured an exclusive interview and gained access to the company hangar. According to multiple sources they cite, Yaney and the company he founded are launching a crowdfunding campaign to raise the $30 million in Series A funding to develop the catapult technology. In the course of the interview, Yaney expressed his vision for space exploration as follows:

“Since the dawn of space exploration, rockets have been the only way to access space. Yet in 70 years, the technology has only made small incremental advances. To truly commercialize and industrialize space, we need 10x tech improvement.”

According to a source cited by TechCrunch, SpinLaunch’s design would involve a centrifuge that accelerates payloads to speeds of up to 4,828 km/h (3,000 mph). Additionally, the cargo could be equipped with supplemental rockets to escape Earth’s atmosphere. By replacing rocket boosters with a kinetic launch system, SpinLaunch’s concept would rely on principles similar to those explored by NASA.

But as he went on to explain, the method his company is exploring is different. “SpinLaunch employs a rotational acceleration method, harnessing angular momentum to gradually accelerate the vehicle to hypersonic speeds,” he said. “This approach employs a dramatically lower cost architecture with much lower power.” Utilizing this technology, Yaney estimates that the costs of individual launches could be reduced to $500,000 – essentially, by a factor of 10 to 200.

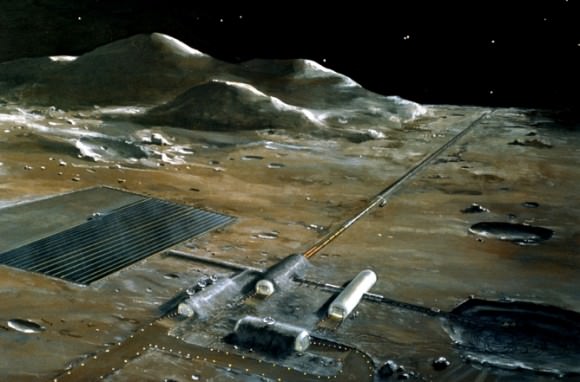
A lunar base, as imagined by NASA in the 1970s. Credit: NASA

According to Bloomberg Financial, not much more is known about the company or its founder beyond a brief description. However, according to SEC documents cited by TechCrunch, Yaney managed to raise $1 million in equity in 2014 and $2.9 million in 2015. The same documents indicate that he was $2.2 million in debt by mid-2017 and another $2 million in debt by late 2017.

Luckily, the Hawaii state senate introduced a bill last month that proposed issuing $25 million in bonds to assist SpinLaunch with constructing its space catapult. Hawaii also hopes to gain construction contracts for the launch system as part of its commitment to making space accessible. As it states in the bill:

“[T]he department of budget and finance, with the approval of the governor, is authorized to issue special purpose revenue bonds in a total amount not to exceed $25,000,000, in one or more series, for the purpose of assisting SpinLaunch Inc., a Delaware corporation, in financing the costs relating to the planning, design, construction, equipping, acquisition of land, including easements or other interests therein, and other tangible assets for an electrically powered, kinetic launch system to transport small satellites into low Earth orbit.”

In the meantime, Yaney is looking to the public and several big venture capital firms to raise the revenue he needs to make his vision a reality. Of course, beyond the issue of financing, several technical barriers still need to be addressed before a space catapult could be realized. The most obvious of these is how to overcome the air resistance produced by Earth’s dense atmosphere.

However, Yaney was optimistic in his interview with TechCrunch, claiming that his company is investigating these and other challenges:

“During the last three years, the core technology has been developed, prototyped, tested and most of the tech risk retired. The remaining challenges are in the construction and associated areas that all very large hardware development and construction projects face.”

There’s no indication of when such a system might be complete, but that’s to be expected at this point. However, with the support of the Hawaiian government and some additional capital, his company is likely to secure its Series A funding and begin moving to the next phase of development. Much like the Hyperloop, this concept may prove to be one of those ideas that keep advancing because of the people who are willing to make it happen!

And be sure to check out this video about SpinLaunch’s crowdfunding campaign, courtesy of Scott Manley:

Further Reading: TechCrunch

Amazing High Resolution Image of the Core of the Milky Way, a Region with Surprisingly Low Star Formation Compared to Other Galaxies

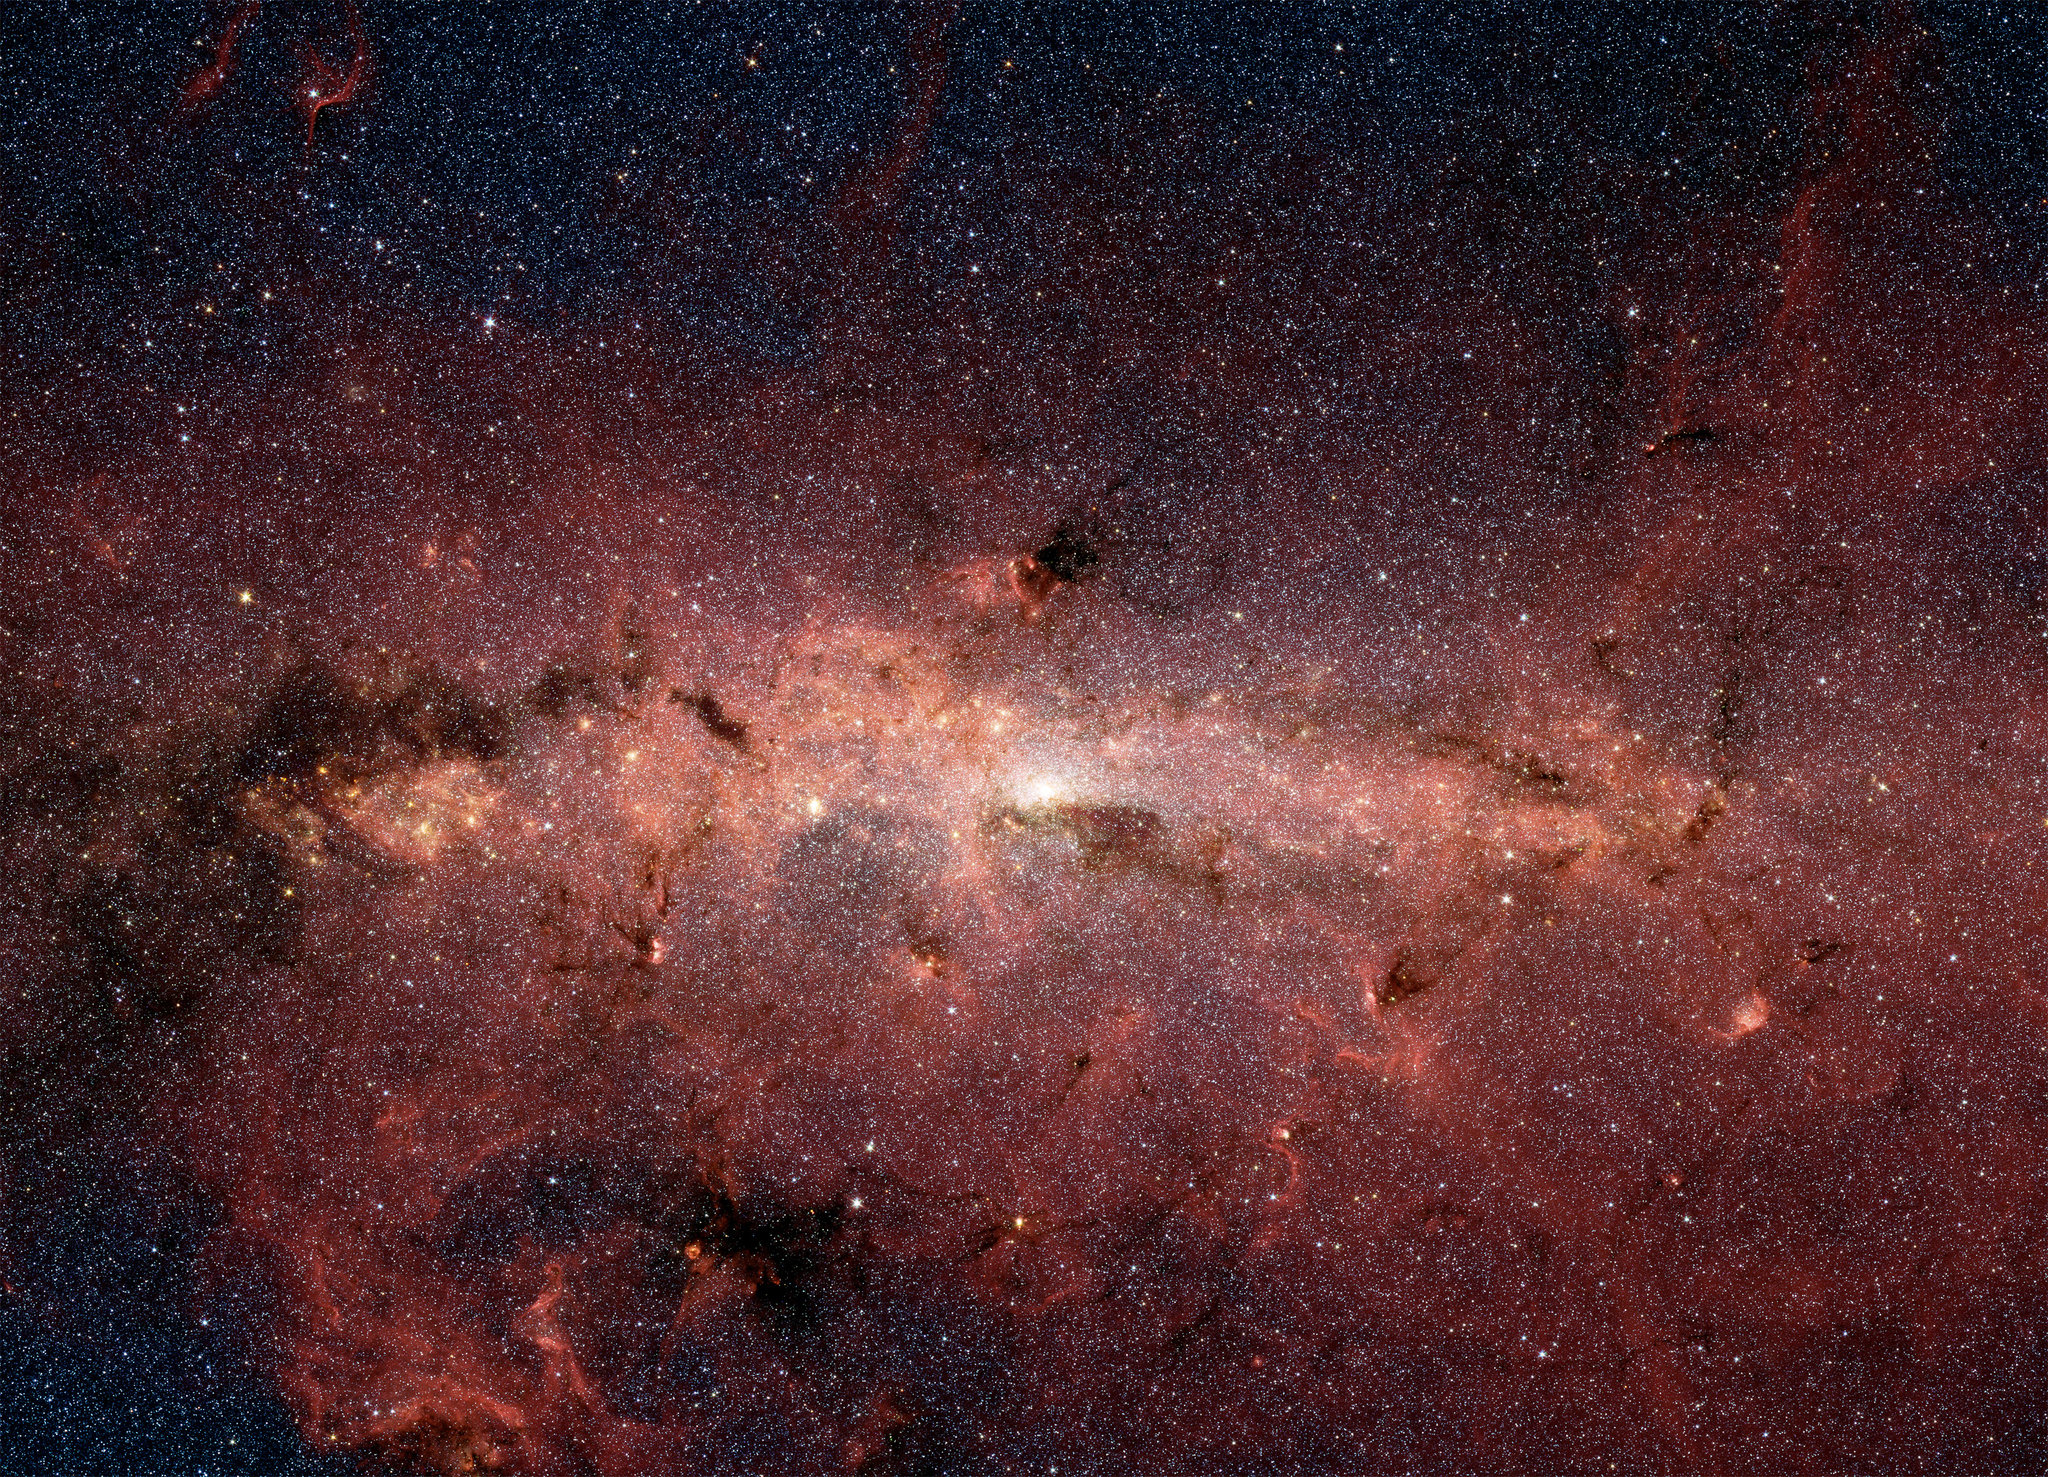
NASA's Spitzer Space Telescope captured this stunning infrared image of the center of the Milky Way Galaxy, where the black hole Sagitarrius A resides. Credit: NASA/JPL-Caltech

Compared to some other galaxies in our Universe, the Milky Way is a rather subtle character. In fact, there are galaxies that are a thousands times as luminous as the Milky Way, owing to the presence of warm gas in the galaxy’s Central Molecular Zone (CMZ). This gas is heated by massive bursts of star formation that surround the Supermassive Black Hole (SMBH) at the nucleus of the galaxy.

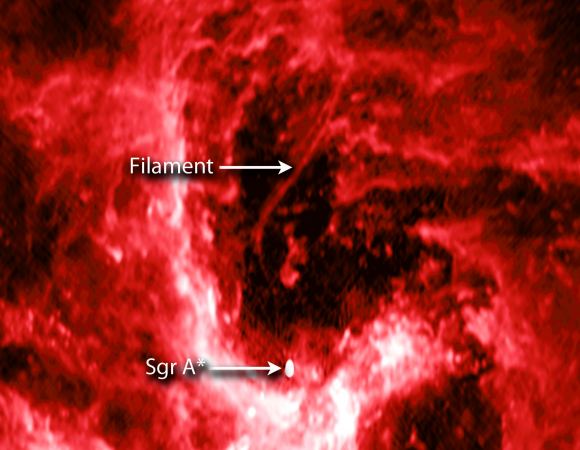
The core of the Milky Way also has a SMBH (Sagittarius A*) and all the gas it needs to form new stars. But for some reason, star formation in our galaxy’s CMZ is less than the average. To address this ongoing mystery, an international team of astronomers conducted a large and comprehensive study of the CMZ to search for answers as to why this might be.

The study, titled “Star formation in a high-pressure environment: an SMA view of the Galactic Centre dust ridge” recently appeared in the Monthly Notices of the Royal Astronomical Society. The study was led by Daniel Walker of the Joint ALMA Observatory and the National Astronomical Observatory of Japan, and included members from multiple observatories, universities and research institutes.

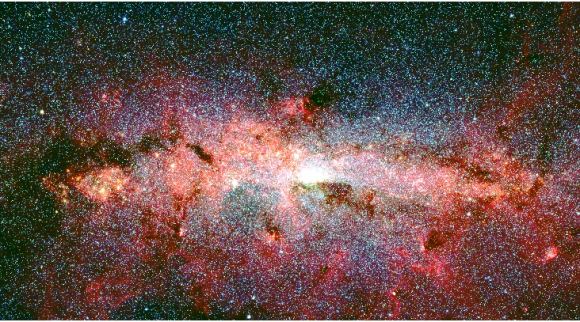
A false color Spitzer infrared image of the Milky Way’s Central Molecular Zone (CMZ). Credit: Spitzer/NASA/CfA

For the sake of their study, the team relied on the Submillimeter Array (SMA) radio interferometer, which is located atop Maunakea in Hawaii. What they found was a sample of thirteen high-mass cores in the CMZ’s “dust ridge” that could be young stars in the initial phase of development. These cores ranged in mass from 50 to 2150 Solar Masses and have radii of 0.1 – 0.25 parsecs (0.326 – 0.815 light-years).

They also noted the presence of two objects that appeared to be previously unknown young, high-mass protostars. As they state in their study, all of this indicated that stars in CMZ had about the same rate of formation as those in the galactic disc, despite their being vast pressure differences:

“All appear to be young (pre-UCHII), meaning that they are prime candidates for representing the initial conditions of high-mass stars and sub-clusters. We compare all of the detected cores with high-mass cores and clouds in the Galactic disc and find that they are broadly similar in terms of their masses and sizes, despite being subjected to external pressures that are several orders of magnitude greater.”

To determine that the external pressure in the CMZ was greater, the team observed spectral lines of the molecules formaldehyde and methyl cyanide to measure the temperature of the gas and its kinetics. These indicated that the gas environment was highly turbulent, which led them to the conclusion that the turbulent environment of the CMZ is responsible for inhibiting star formation there.

A radio image from the NSF’s Karl G. Jansky Very Large Array showing the center of our  galaxy. Credit: NSF/VLA/UCLA/M. Morris et al.

As they state in their study, these results were consistent with their previous hypothesis:

“The fact that >80 percent of these cores do not show any signs of star-forming activity in such a high-pressure environment leads us to conclude that this is further evidence for an increased critical density threshold for star formation in the CMZ due to turbulence.”

So in the end, the rate of star formation in a CMZ is not only dependent on their being a lot of gas and dust, but on the nature of the gas environment itself. These results could inform future studies of not only the Milky Way, but of other galaxies as well – particularly when it comes to the relationship that exists between Supermassive Black Holes (SMBHs), star formation, and the evolution of galaxies.

For decades, astronomers have studied the central regions of galaxies in the hopes of determining how this relationship works. And in recent years, astronomers have come up with conflicting results, some of which indicate that star formation is arrested by the presence of SMBHs while others show no correlation.

In addition, further examinations of SMBHs and Active Galactic Nuclei (AGNs) have shown that there may be no correlation between the mass of a galaxy and the mass of its central black hole – another theory that astronomers previously subscribed to.

As such, understanding how and why star formation appears to be different in galaxies like the Milky Way could help us to unravel these other mysteries. From that, a better understanding of how stars and galaxies evolved over the course of cosmic history is sure to emerge.

Further Reading: CfA, MNRAS

Proxima Centauri Just Released a Deadly Flare, so it’s Probably not a Great Place for Habitable Planets

Artist impression of a red dwarf star like Proxima Centauri, the nearest star to our sun. New analysis of ALMA observations reveal that Proxima Centauri emitted a powerful flare that would have created inhospitable conditions for planets in that system. Credit: NRAO/AUI/NSF; D. Berry

Since it’s discovery was announced in August of 2016, Proxima b has been an endless source of wonder and the target of many scientific studies. As the closest extra-solar planet to our Solar System – and a terrestrial planet that orbits within Proxima Centauri’s circumstellar habitable zone (aka. “Goldilocks Zone”) – scientists have naturally wondered whether or not this planet could be habitable.

Unfortunately, many of these studies have emphasized the challenges that life on Proxima b would likely face, not the least of which is harmful radiation from its star. According to a recent study, a team of astronomers used the ALMA Observatory to detect a large flare emanating from Proxima Centauri. This latest findings, more than anything, raises questions about how habitable its exoplanet could be.

The study, titled “Detection of a Millimeter Flare from Proxima Centauri“, recently appeared in The Astrophysical Journal Letters. Led by Meredith A. MacGregor, an NSF Astronomy and Astrophysics Postdoctoral Fellow at the Carnegie Institution for Science, the team also included members from the Harvard-Smithsonian Center for Astrophysics (CfA) and the University of Colorado Boulder.

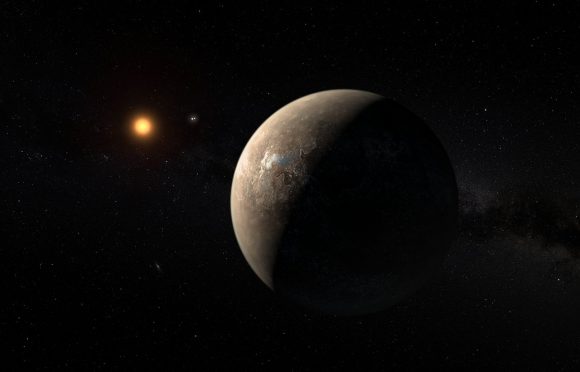
Artist’s impression of Proxima b, which was discovered using the Radial Velocity method. Credit: ESO/M. Kornmesser

For the sake of their study, the team used data obtained by the Atacama Large Millimeter/submillimeter Array (ALMA) between January 21st to April 25th, 2017. This data revealed that the star underwent a significant flaring event on March 24th, where it reached a peak that was 1000 times brighter than the star’s quiescent emission for a period of ten seconds.

Astronomers have known for a long time that when compared to stars like our Sun, M-type stars are variable and unstable. While they are the smallest, coolest, and dimmest stars in our Universe, they tend to flare up at a far greater rate. In this case, the flare detected by the team was ten times larger than our Sun’s brightest flares at similar wavelengths.

Along with a smaller preceding flare, the entire event lasted fewer than two minutes of the 10 hours that ALMA was observing the star between January and March of last year. While it was already known that Proxima Centauri, like all M-type stars, experiences regular flare activity, this one appeared to be a rare event. However, stars like Proxima Centauri are also known to experienced regular, although smaller, X-ray flares.

All of this adds up to a bad case for habitability. As MacGregor explained in a recent NRAO press statement:

“It’s likely that Proxima b was blasted by high energy radiation during this flare. Over the billions of years since Proxima b formed, flares like this one could have evaporated any atmosphere or ocean and sterilized the surface, suggesting that habitability may involve more than just being the right distance from the host star to have liquid water.”

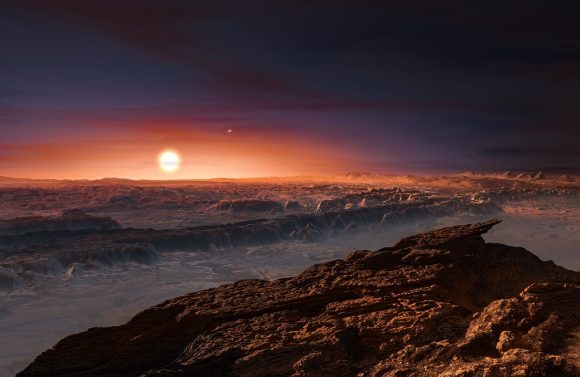
Artist’s impression of the surface of the planet Proxima b orbiting the red dwarf star Proxima Centauri. The double star Alpha Centauri AB is visible to the upper right of Proxima itself. Credit: ESO

MacGregor and her colleagues also considered the possibility that Proxima Centauri is circled by several disks of dust. This was suggested by a previous study (also based on ALMA data) that indicated that the light output of both the star and flare together pointed towards the existence of debris belts around the star. However, after examining the ALMA data as a function of observing time, they were able to eliminate this as a possibility.

As Alycia J. Weinberger, also a researcher with the Carnegie Institution for Science and a co-author on the paper, explained:

“There is now no reason to think that there is a substantial amount of dust around Proxima Cen. Nor is there any information yet that indicates the star has a rich planetary system like ours.”

To date, studies that have looked at possible conditions on Proxima b have come to different conclusions as to whether or not it could retain an atmosphere or liquid water on its surface. While some have found room for “transient habitability” or evidence of liquid water, others have expressed doubt based on the long-term effects that radiation and flares from its star would have on a tidally-locked planet.

In the future, the deployment of next-generation instruments like the James Webb Space Telescope are expected to provide more detailed information on this system. With precise measurements of this star and its planet, the question of whether or not life can (and does) exist in this system may finally be answered.

And be sure to enjoy this animation of Proxima Centauri in motion, courtesy of NRAO outreach:

Further Reading: NRAO, The Astrophysical Journal Letters

Precise New Measurements From Hubble Confirm the Accelerating Expansion of the Universe. Still no Idea Why it’s Happening

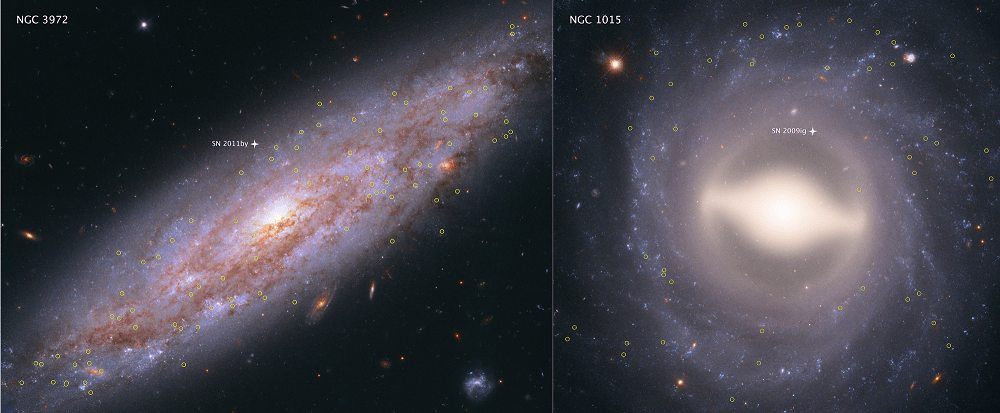
These Hubble Space Telescope images showcase two of the 19 galaxies analyzed in a project to improve the precision of the universe's expansion rate, a value known as the Hubble constant. The color-composite images show NGC 3972 (left) and NGC 1015 (right), located 65 million light-years and 118 million light-years, respectively, from Earth. The yellow circles in each galaxy represent the locations of pulsating stars called Cepheid variables. Credits: NASA, ESA, A. Riess (STScI/JHU)

In the 1920s, Edwin Hubble made the groundbreaking revelation that the Universe was in a state of expansion. Originally predicted as a consequence of Einstein’s Theory of General Relativity, this confirmation led to what came to be known as Hubble’s Constant. In the ensuring decades, and thanks to the deployment of next-generation telescopes – like the aptly-named Hubble Space Telescope (HST) – scientists have been forced to revise this law.

In short, in the past few decades, the ability to see farther into space (and deeper into time) has allowed astronomers to make more accurate measurements about how rapidly the early Universe expanded. And thanks to a new survey performed using Hubble, an international team of astronomers has been able to conduct the most precise measurements of the expansion rate of the Universe to date.

This survey was conducted by the Supernova H0 for the Equation of State (SH0ES) team, an international group of astronomers that has been on a quest to refine the accuracy of the Hubble Constant since 2005. The group is led by Adam Reiss of the Space Telescope Science Institute (STScI) and Johns Hopkins University, and includes members from the American Museum of Natural History, the Neils Bohr Institute, the National Optical Astronomy Observatory, and many prestigious universities and research institutions.

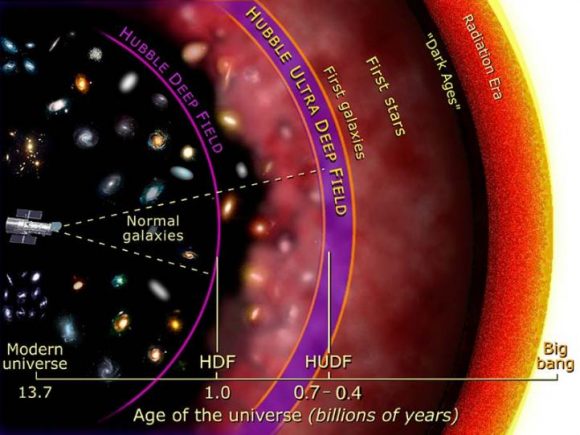
Illustration of the depth by which Hubble imaged galaxies in prior Deep Field initiatives, in units of the Age of the Universe. Credit: NASA and A. Feild (STScI)

The study which describes their findings recently appeared in The Astrophysical Journal under the title “Type Ia Supernova Distances at Redshift >1.5 from the Hubble Space Telescope Multi-cycle Treasury Programs: The Early Expansion Rate“. For the sake of their study, and consistent with their long term goals, the team sought to construct a new and more accurate “distance ladder”.

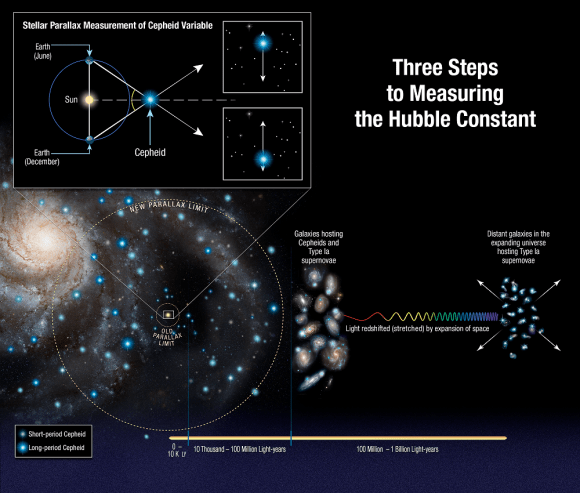
This tool is how astronomers have traditionally measured distances in the Universe, which consists of relying on distance markers like Cepheid variables – pulsating stars whose distances can be inferred by comparing their intrinsic brightness with their apparent brightness. These measurements are then compared to the way light from distance galaxies is redshifted to determine how fast the space between galaxies is expanding.

From this, the Hubble Constant is derived. To build their distant ladder, Riess and his team conducted parallax measurements using Hubble’s Wide Field Camera 3 (WFC3) of eight newly-analyzed Cepheid variable stars in the Milky Way. These stars are about 10 times farther away than any studied previously – between 6,000 and 12,000 light-year from Earth – and pulsate at longer intervals.

To ensure accuracy that would account for the wobbles of these stars, the team also developed a new method where Hubble would measure a star’s position a thousand times a minute every six months for four years. The team then compared the brightness of these eight stars with more distant Cepheids to ensure that they could calculate the distances to other galaxies with more precision.

Illustration showing three steps astronomers used to measure the universe’s expansion rate (Hubble constant) to an unprecedented accuracy, reducing the total uncertainty to 2.3 percent. Credits: NASA/ESA/A. Feild (STScI)/and A. Riess (STScI/JHU)

Using the new technique, Hubble was able to capture the change in position of these stars relative to others, which simplified things immensely. As Riess explained in a NASA press release:

“This method allows for repeated opportunities to measure the extremely tiny displacements due to parallax. You’re measuring the separation between two stars, not just in one place on the camera, but over and over thousands of times, reducing the errors in measurement.”

Compared to previous surveys, the team was able to extend the number of stars analyzed to distances up to 10 times farther. However, their results also contradicted those obtained by the European Space Agency’s (ESA) Planck satellite, which has been measuring the Cosmic Microwave Background (CMB) – the leftover radiation created by the Big Bang – since it was deployed in 2009.

By mapping the CMB, Planck has been able to trace the expansion of the cosmos during the early Universe – circa. 378,000 years after the Big Bang. Planck’s result predicted that the Hubble constant value should now be 67 kilometers per second per megaparsec (3.3 million light-years), and could be no higher than 69 kilometers per second per megaparsec.

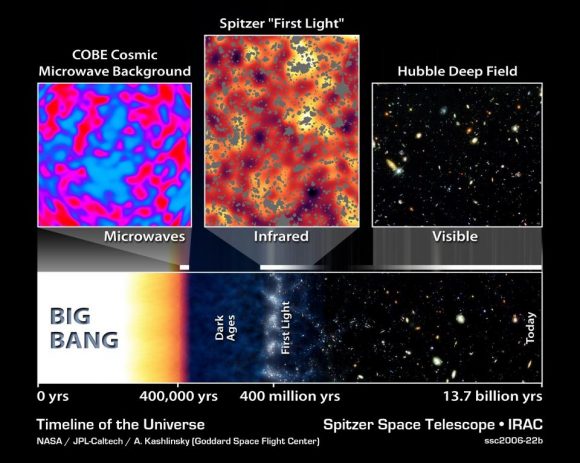
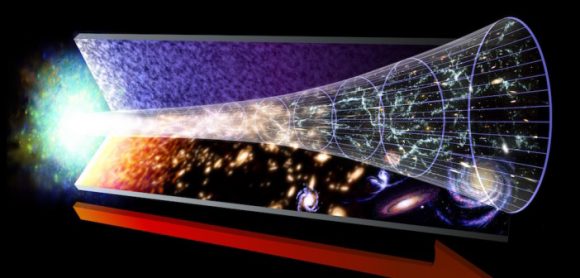
The Big Bang timeline of the Universe. Cosmic neutrinos affect the CMB at the time it was emitted, and physics takes care of the rest of their evolution until today. Credit: NASA/JPL-Caltech/A. Kashlinsky (GSFC).

Based on their sruvey, Riess’s team obtained a value of 73 kilometers per second per megaparsec, a discrepancy of 9%. Essentially, their results indicate that galaxies are moving at a faster rate than that implied by observations of the early Universe. Because the Hubble data was so precise, astronomers cannot dismiss the gap between the two results as errors in any single measurement or method. As Reiss explained:

“The community is really grappling with understanding the meaning of this discrepancy… Both results have been tested multiple ways, so barring a series of unrelated mistakes. it is increasingly likely that this is not a bug but a feature of the universe.”

These latest results therefore suggest that some previously unknown force or some new physics might be at work in the Universe. In terms of explanations, Reiss and his team have offered three possibilities, all of which have to do with the 95% of the Universe that we cannot see (i.e. dark matter and dark energy). In 2011, Reiss and two other scientists were awarded the Nobel Prize in Physics for their 1998 discovery that the Universe was in an accelerated rate of expansion.

Consistent with that, they suggest that Dark Energy could be pushing galaxies apart with increasing strength. Another possibility is that there is an undiscovered subatomic particle out there that is similar to a neutrino, but interacts with normal matter by gravity instead of subatomic forces. These “sterile neutrinos” would travel at close to the speed of light and could collectively be known as “dark radiation”.

This illustration shows the evolution of the Universe, from the Big Bang on the left, to modern times on the right. Credit: NASA

Any of these possibilities would mean that the contents of the early Universe were different, thus forcing a rethink of our cosmological models. At present, Riess and colleagues don’t have any answers, but plan to continue fine-tuning their measurements. So far, the SHoES team has decreased the uncertainty of the Hubble Constant to 2.3%.

This is in keeping with one of the central goals of the Hubble Space Telescope, which was to help reduce the uncertainty value in Hubble’s Constant, for which estimates once varied by a factor of 2.

So while this discrepancy opens the door to new and challenging questions, it also reduces our uncertainty substantially when it comes to measuring the Universe. Ultimately, this will improve our understanding of how the Universe evolved after it was created in a fiery cataclysm 13.8 billion years ago.

Further Reading: NASA, The Astrophysical Journal

This was Exactly Where Cassini Crashed into Saturn

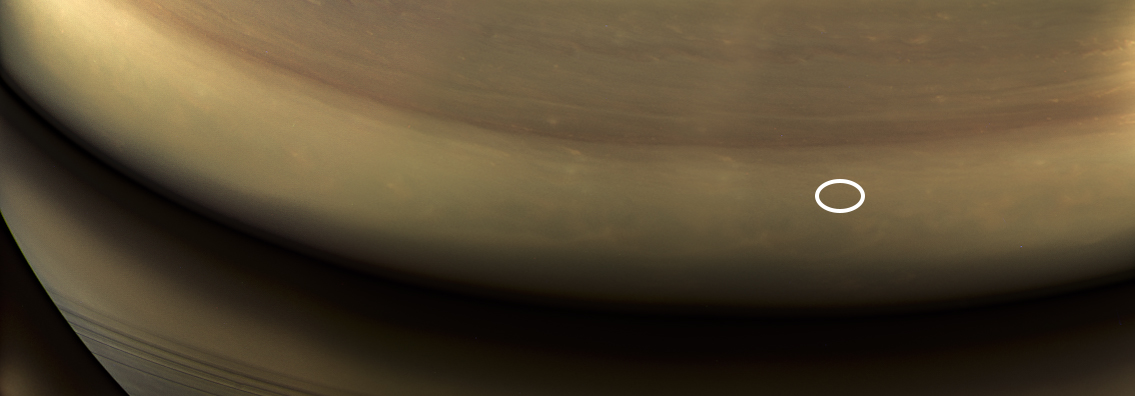
The site of the Cassini probe's crash in Saturn's atmosphere, circled in white. Credit: NASA/JPL-Caltech/Space Science Institute

On September 15th, 2017, after nearly 20 years in service, the Cassini spacecraft ended its mission by plunging into the atmosphere of Saturn. During the 13 years it spent in the Saturn system, this probe revealed a great deal about the gas giant, its rings, and its systems of moons. As such, it was a bittersweet moment for the mission team when the probe concluded its Grand Finale and began descending into Saturn’s atmosphere.

Even though the mission has concluded, scientists are still busy poring over the data sent back by the probe. These include a mosaic of the final images snapped by Cassini’s cameras, which show the location of where it would enter Saturn’s atmosphere just hours later. The exact spot (shown above) is indicated by a white oval, which was on Saturn’s night side at the time, but would later come around to be facing the Sun.

From the beginning, the Cassini mission was a game-changer. After reaching the Saturn system on July 1st, 2004, the probe began a series of orbits around Saturn that allowed it conduct close flybys of several of its moons. Foremost among these were Saturn’s largest moon Titan and its icy moon Enceladus, both of which proved to be a treasure trove of scientific data.

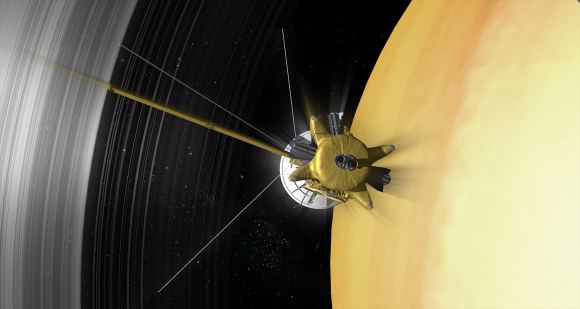
Artist’s impression of the Cassini spacecraft orbiting Saturn. Credit: NASA/JPL-Caltech/Space Science Institute

On Titan, Cassini revealed evidence of methane lakes and seas, the existence of a methanogenic cycle (similar to Earth’s hydrological cycle), and the presence of organic molecules and prebiotic chemistry. On Enceladus, Cassini examined the mysterious plumes emanating from its southern pole, revealing that they extended all the way to the moon’s interior ocean and contained organic molecules and hydrated minerals.

These findings have inspired a number of proposals for future robotic missions to explore Titan and Enceladus more closely. So far, proposals range from exploring Titan’s surface and atmosphere using lightweight aerial platforms, balloons and landers, or a dual quadcopter. Other proposals include exploring its seas using a paddleboat or a even a submarine. And alongside Europa, there are scientists clamoring for a mission to Enceladus and other “Ocean Worlds” to explore its plumes and maybe even its interior ocean.

Beyond that, Cassini also revealed a great deal about Saturn’s atmosphere, which included the persistent hexagonal storm that exists around the planet’s north pole. During its Grand Finale, where it made 22 orbits between Saturn and its rings, the probe also revealed a great deal about the three-dimensional structure and dynamic behavior of the planet’s famous system of rings.

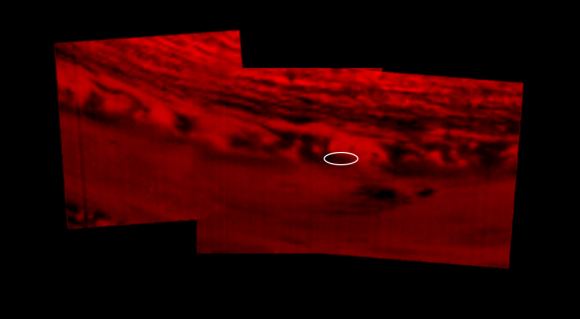
This montage of images, made from data obtained by Cassini’s visual and infrared mapping spectrometer, shows the location on Saturn where the NASA spacecraft entered Saturn’s atmosphere on Sept. 15, 2017. Credits: NASA/JPL-Caltech/University of Arizona

It is only fitting then that the Cassini probe would also capture images of the very spot where its mission would end. The images were taken by Cassini’s wide-angle camera on Sept. 14th, 2017, when the probe was at a distance of about 634,000 km (394,000 mi) from Saturn. They were taken using red, green and blue spectral filters, which were then combined to show the scene in near-natural color.

The resulting image is not dissimilar from another mosaic that was released on September 15th, 2017, to mark the end of the Cassini mission. This mosaic was created using data obtained by Cassini’s visual and infrared mapping spectrometer, which also showed the exact location where the spacecraft would enter the atmosphere – 9.4 degrees north latitude by 53 degrees west longitude.

The main difference, of course, is that this latest mosaic benefits from the addition of color, which provides a better sense of orientation. And for those who are missing the Cassini mission and its regular flow of scientific discoveries, its much more emotionally fitting! While we may never be able to find the wreckage buried inside Saturn’s atmosphere, it is good to know where its last known location was.

Further Reading: NASA
Wow, Indonesia’s Mount Sinabung is Making a Mess. Here’s the View From Space!

The Eruption of Sinabung Volcano, Indonesia, as seen from space. Credit: NASA Earth Observatory.

NASA’s Earth Observatory is a vital part of the space agency’s mission to advance our understanding of Earth, its climate, and the ways in which it is similar and different from the other Solar Planets. For decades, the EO has been monitoring Earth from space in order to map it’s surface, track it’s weather patterns, measure changes in our environment, and monitor major geological events.

For instance, Mount Sinabung – a stratovolcano located on the island of Sumatra in Indonesia – became sporadically active in 2010 after centuries of being dormant. But on February 19th, 2018, it erupted violently, spewing ash at least 5 to 7 kilometers (16,000 to 23,000 feet) into the air over Indonesia. Just a few hours later, Terra and other NASA Earth Observatory satellites captured the eruption from orbit.

The images were taken with Terra’s Moderate Resolution Imaging Spectroradiometer (MODIS), which recorded a natural-color image of the eruption at 11:10 am local time (04:10 Universal Time). This was just hours after the eruption began and managed to illustrate what was being reported by sources on the ground. According to multiple reports from the Associated Press, the scene was one of carnage.

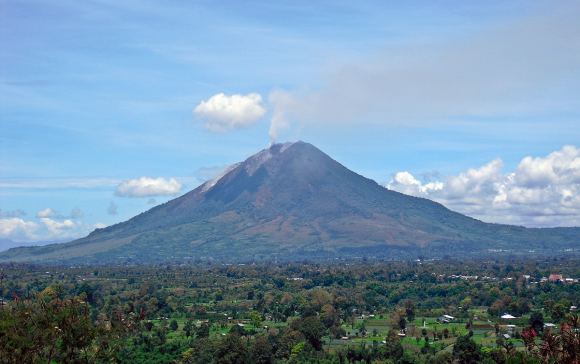
Mount Sinabung on September 13th, 2010, after it became sporatically-active again. Credit: Kenrick95/Wikipedia Commons

According to eye-witness accounts, the erupting lava dome obliterated a chunk of the peak as it erupted. This was followed by plumes of hot gas and ash riding down the volcano’s summit and spreading out in a 5-kilometer (3 mile) diameter. Ash falls were widespread, covering entire villages in the area and leading to airline pilots being issued the highest of alerts for the region.

In fact, ash falls were recorded as far as away as the town of Lhokseumawe – located some 260 km (160 mi) to the north. To address the threat to public health, the Indonesian government advised people to stay indoors due to poor air quality, and officials were dispatched to Sumatra to hand out face masks. Due to its composition and its particulate nature, volcanic ash is a severe health hazard.

On the one hand, it contains sulfur dioxide (SO²), which can irritate the human nose and throat when inhaled. The gas also reacts with water vapor in the atmosphere to produce acid rain, causing damage to vegetation and drinking water. It can also react with other gases in the atmosphere to form aerosol particles that can create thick hazes and even lead to global cooling.

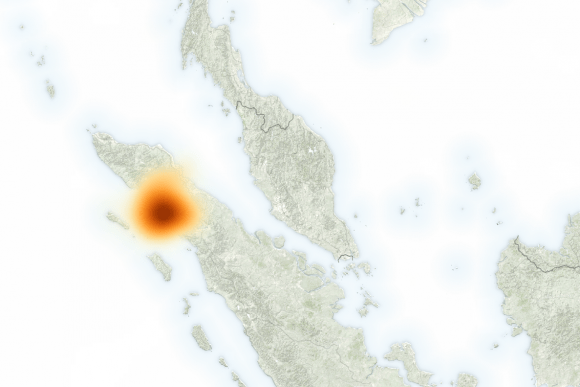
These levels were recorded by the Suomi-NPP satellite using its Ozone Mapper Profiler Suite (OMPS). The image below shows what SO² concentrations were like at 1:20 p.m. local time (06:20 Universal Time) on February 19th, several hours after the eruption. The maximum concentrations of SO² reached 140 Dobson Units in the immediate vicinity of the mountain.

Map showing concentrations of sulfur dioxide (SO²) due to the eruption of Mount Sinabung on the island of Sumatra, Indonesia. Credit: NASA/EO

Erik Klemetti, a volcanologist, was on hand to witness the event. As he explained in an article for Discovery Magazine:

“On February 19, 2018, the volcano decided to change its tune and unleashed a massive explosion that potentially reached at least 23,000 and possibly to up 55,000 feet (~16.5 kilometers), making it the largest eruption since the volcano became active again in 2013.”

Klemetti also cited a report that was recently filed by the Darwin Volcanic Ash Advisory Center – part of the Australian Government’s Bureau of Meteorology. According to this report, the ash will drift to the west and fall into the Indian Ocean, rather than continuing to rain down on Sumatra. Other sensors on NASA satellites have also been monitoring Mount Sinabung since its erupted.

This includes the Cloud-Aerosol Lidar and Infrared Pathfinder Satellite Observation (CALIPSO), an environmental satellite operated jointly by NASA and France’s Centre National d’Etudes Spatiales (CNES). Data from this satellite indicated that some debris and gas released by the eruption has risen as high as 15 to 18 km (mi) into the atmosphere.

In addition, data from the Aura satellite‘s Ozone Monitoring Instrument (OMI) recently indicated rising levels of SO² around Sinabung, which could mean that fresh magma is approaching the surface. As Erik Klemetti concluded:

“This could just be a one-off blast from the volcano and it will return to its previous level of activity, but it is startling to say the least. Sinabung is still a massive humanitarian crisis, with tens of thousands of people unable to return to their homes for years. Some towns have even been rebuilt further from the volcano as it has shown no signs of ending this eruptive period.”

Be sure to check out this video of the eruption, courtesy of New Zealand Volcanologist Dr. Janine Krippner:

Further Reading: NASA Earth Observatory