A graphic designer in Rhode Island, Jason writes about space exploration on his blog Lights In The Dark, Discovery News, and, of course, here on Universe Today. Ad astra!
“This is how we know nature. It is the best idea humans have ever come up with.”
– Bill Nye, Science Guy and CEO of The Planetary Society
In this latest video from NOVA’s Secret Life of Scientists and Engineers, science guy Bill Nye talks about the incredible influence that Carl Sagan had on his life, from attending his lectures on astronomy at Cornell University to eventually becoming CEO of The Planetary Society, which was co-founded by Sagan in 1980.
“I took astronomy from Carl Sagan.” Now there’s a statement that’ll get people’s attention. (It got mine, anyway.)
Illustration of the twin Van Allen Probes (formerly Radiation Belt Storm Probes) in orbit (JHUAPL/NASA)
Earth’s inner radiation belt displays a curiously zebra-esque striped pattern, according to the latest findings from NASA’s twin Van Allen Probes. What’s more, the cause of the striping seems to be the rotation of the Earth itself — something that was previously thought to be impossible.
“…it is truly humbling, as a theoretician, to see how quickly new data can change our understanding of physical properties.”
– Aleksandr Ukhorskiy, Johns Hopkins University Applied Physics Laboratory
Our planet is surrounded by two large doughnut-shaped regions of radiation called the Van Allen belts, after astrophysicist James Van Allen who discovered their presence in 1958. (Van Allen died at the age of 91 in 2006.) The inner Van Allen belt, extending from about 800 to 13,000 km (500 to 8,000 miles) above the Earth, contains high-energy electrons and protons and poses a risk to both spacecraft and humans, should either happen to spend any substantial amount of time inside it.
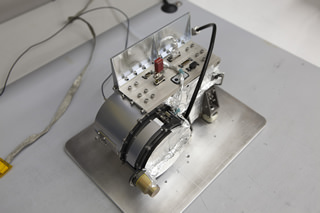
The Radiation Belt Storm Probes Ion Composition Experiment (RBSPICE) is a time-of-flight versus energy spectrometer (JHUAPL)
Launched aboard an Atlas V rocket from Cape Canaveral AFS on the morning of Aug. 30, 2012, the Van Allen Probes (originally the Radiation Belt Storm Probes) are on a two-year mission to investigate the belts and find out how they behave and evolve over time.
One of the instruments aboard the twin probes, the Radiation Belt Storm Probes Ion Composition Experiment (RBSPICE), has detected a persistent striped pattern in the particles within the inner belt. While it was once thought that any structures within the belts were the result of solar activity, thanks to RBSPICE it’s now been determined that Earth’s rotation and tilted magnetic axis are the cause.
“It is because of the unprecedented high energy and temporal resolution of our energetic particle experiment, RBSPICE, that we now understand that the inner belt electrons are, in fact, always organized in zebra patterns,” said Aleksandr Ukhorskiy of the Johns Hopkins Applied Physics Laboratory (APL) in Laurel, Md., co-investigator on RBSPICE and lead author of the paper. “Furthermore, our modeling clearly identifies Earth’s rotation as the mechanism creating these patterns. It is truly humbling, as a theoretician, to see how quickly new data can change our understanding of physical properties.”
The model of the formation of the striped patterns is likened to the pulling of taffy.
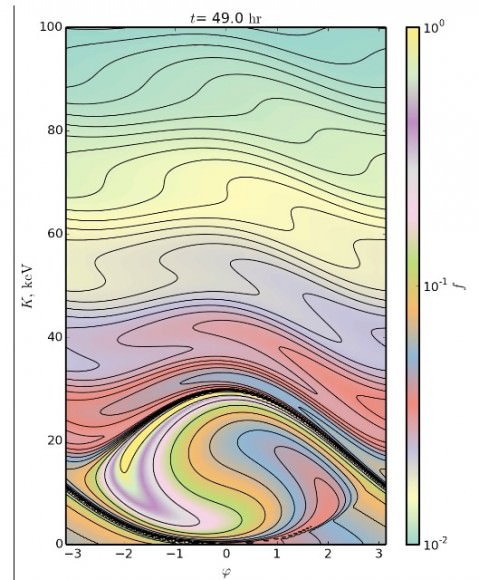
RBSPICE data of stripes within the inner Van Allen belt (Click for animation) Credit: A. Ukhorskiy/JHUAPL
“If the inner belt electron populations are viewed as a viscous fluid,” Ukhorskiy said, “these global oscillations slowly stretch and fold that fluid, much like taffy is stretched and folded in a candy store machine.”
“This finding tells us something new and important about how the universe operates,” said Barry Mauk, a project scientist at APL and co-author of the paper. “The new results reveal a new large-scale physical mechanism that can be important for planetary radiation belts throughout the solar system. An instrument similar to RBSPICE is now on its way to Jupiter on NASA’s Juno mission, and we will be looking for the existence of zebra stripe-like patterns in Jupiter’s radiation belts.”
Jupiter’s Van Allen belts are similar to Earth’s except much larger; Jupiter’s magnetic field is ten times stronger than Earth’s and the radiation in its belts is a million times more powerful (source). Juno will arrive at Jupiter in July 2016 and spend about a year in orbit, investigating its atmosphere, interior, and magnetosphere.
Thanks to the Van Allen Probes. Juno now has one more feature to look for in Jupiter’s radiation belts.
“It is amazing how Earth’s space environment, including the radiation belts, continue to surprise us even after we have studied them for over 50 years. Our understanding of the complex structures of the belts, and the processes behind the belts’ behaviors, continues to grow, all of which contribute to the eventual goal of providing accurate space weather modeling.”
– Louis Lanzerotti, physics professor at the New Jersey Institute of Technology and principal investigator for RBSPICE
The Van Allen Probes are the second mission in NASA’s Living With a Star program, managed by NASA’s Goddard Space Flight Center in Greenbelt, MD. The program explores aspects of the connected sun-Earth system that directly affect life and society.
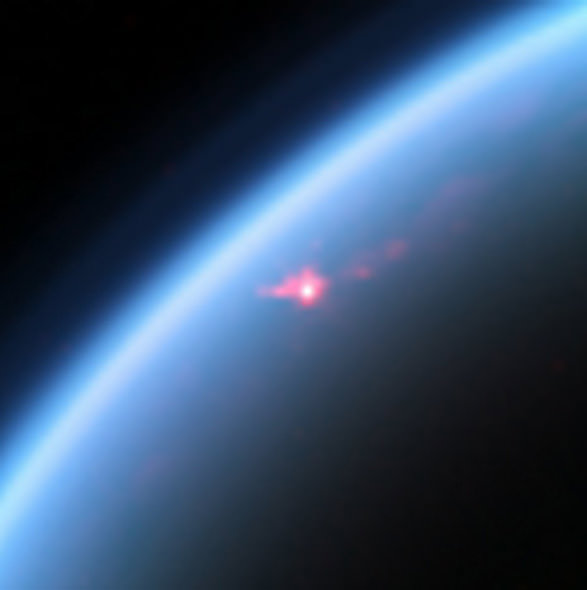
Cassini VIMS image of specular reflections in one of Titan's lakes from a flyby on July 24, 2012 (NASA/JPL-Caltech/SSI/Jason W. Barnes et al.)
It’s no surprise that Titan’s north polar region is covered with vast lakes and seas of liquid methane — these have been imaged many times by Cassini during its ten years in orbit around Saturn. What is surprising though is just how incredibly smooth the surfaces of these lakes have been found to be.
One would think that such large expanses of surface liquid — some of Titan’s seas are as big the Great Lakes — would exhibit at least a little surface action on a world with an atmosphere as dense as Titan’s. But repeated radar imaging has shown their surfaces to be “as smooth as the paint on a car.” Over the past several years scientists have puzzled over this anomaly but now they may have truly seen the light — that is, reflected light from what could actually be waves on Titan!
Using data acquired during flybys of Titan in 2012 and 2013, planetary scientist Jason Barnes from the University of Idaho and a team of researchers from several other institutions including JPL, Cornell, and MIT, have identified what might be waves in the surface of Punga Mare, one of Titan’s biggest lakes.
For a sense of scale, Lake Victoria, the largest lake in Africa, could fit lengthwise across Titan’s 380-km (236-mile) -wide Punga Mare.
Variations in specular highlights in four pixels observed in the surface of Punga Mare by Cassini’s VIMS (Visible and Infrared Mapping Spectrometer) have been interpreted by the team as being the result of waves — or, perhaps more accurately, ripples, seeing as that they are estimated to be a mere 2 centimeters in height.
Still, based on what’s been observed thus far on Titan, that’s downright choppy.
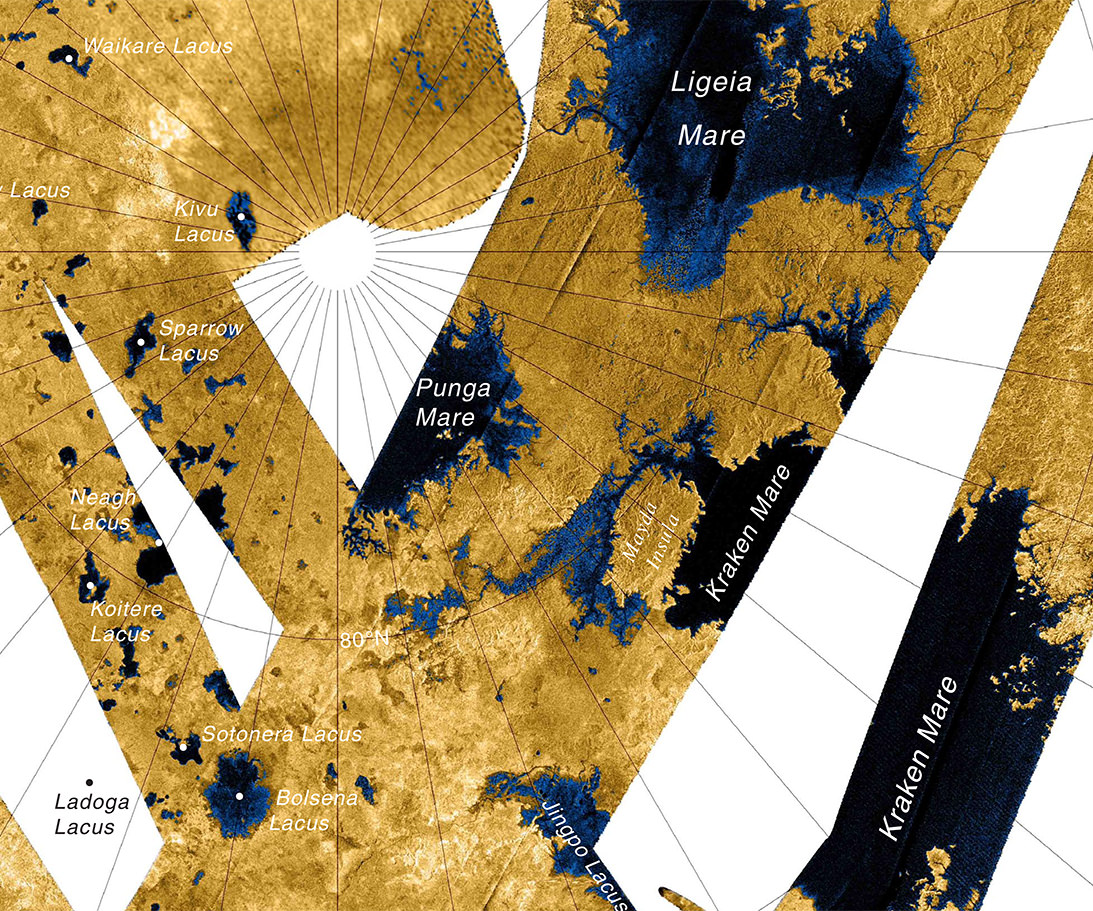
If the Cassini observations interpreted by Barnes et al. are indicative of waves in Punga Mare, they could also explain previous specular variations seen in other bodies of liquid, like the smaller Kivu Lacus (top image).
Map of Titan’s northern “Land o’ Lakes” made from Cassini high-resolution radar imaging (NASA/JPL/USGS)
“If correct this discovery represents the first sea-surface waves known outside of Earth.”
– Jason W. Barnes et al.
Then again, wave action isn’t the only possible answer. Similar varied specular highlights could also be caused by a wet surface — like a methane mud flat. Further observations will be needed to rule out other possibilities and obtain a more accurate “surf forecast” for Titan.
MESSENGER image of Mercury from its third flyby (NASA/Johns Hopkins University Applied Physics Laboratory/Carnegie Institution of Washington)
Whatever Mercury’s did to trim down its waistline has worked better than anyone thought — the innermost planet in our Solar System has reduced its radius* by about 7 kilometers (4.4 miles), over double the amount once estimated by scientists.
Of course you wouldn’t want to rush to begin the Mercury diet — its planetary contraction has taken place over the course of 3.8 billion years, since the end of the Late Heavy Bombardment. Still — lookin’ good, Mercury!
These findings come thanks to the MESSENGER spacecraft, in orbit around Mercury since 2011. Now that MESSENGER has successfully mapped literally all of Mercury’s surface, detailed measurements of more than 5,900 landforms created by cooling and contraction of the planet’s crust have allowed researchers to more precisely determine its geologic history and answer some decades-old questions raised by Mariner 10 images.
“This discrepancy between theory and observation, a major puzzle for four decades, has finally been resolved,” said MESSENGER Principal Investigator Sean Solomon. “It is wonderfully affirming to see that our theoretical understanding is at last matched by geological evidence.”
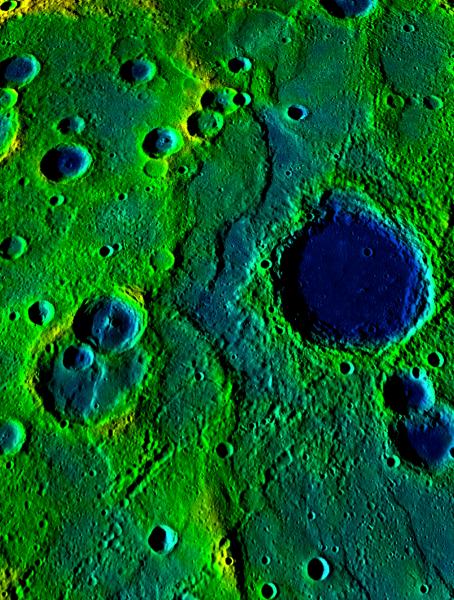
This image shows a fold-and-thrust belt stretching over 540 km on Mercury. The colors correspond to elevation— yellow/green is high and blue is low. (Courtesy NASA/Johns Hopkins University Applied Physics Laboratory/Carnegie Institution of Washington.)
Using high-definition images acquired with MESSENGER’s MDIS (Mercury Dual Imaging System) instrument, planetary geologist at the Carnegie Institution of Washington and study lead author Paul Byrne and his colleagues identified 5,934 lobate scarps and wrinkle ridges on Mercury that are the result of contraction. From measurements of these features, the team determined that the planet’s radial contraction was much more than that estimated by models based on incomplete imaging from NASA’s Mariner 10 mission — the very first spacecraft to visit (but not orbit) Mercury.
“These new results resolved a decades-old paradox between thermal history models and estimates of Mercury’s contraction,” said Byrne. “Now the history of heat production and loss and global contraction are consistent.
“Interestingly, our findings are also reminiscent of now-obsolete models for how large-scale geological deformation occurred on Earth when the scientific community thought that the Earth only had one tectonic plate,” Byrne said. “Those models were developed to explain mountain building and tectonic activity in the nineteenth century, before plate tectonics theory.”
Unlike Earth, Mercury has only one global tectonic plate.
The findings were published in the Sunday, March 16 edition of the journal Nature Geoscience.
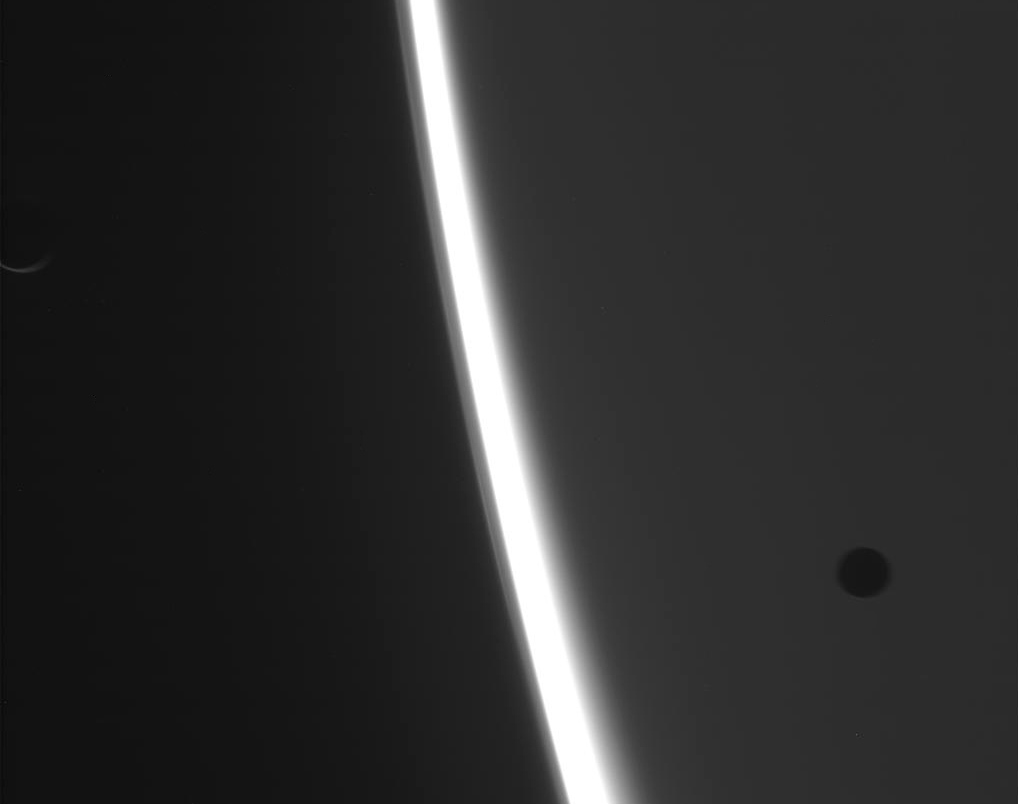
Raw image of Saturn with two moons acquired by Cassini on March 11, 2014 (NASA/JPL-Caltech/SSI)
On March 11, NASA’s Cassini spacecraft was acquiring some images of Saturn’s back-lit limb when two of its moons decided to make an entrance. Like stage hands in a darkened theatre the moons quickly passed across the scene, moving between Saturn and the spacecraft and, because of exposure time and spacecraft motion, getting a bit blurred in the process.
In the image above the silhouette of one moon can be seen at bottom right — Mimas, perhaps — while another’s crescent can be made out at upper left… possibly Enceladus. Very cool!
Watch an animation of the moons below:
Two of Saturn’s moons drift into the scene on March 11, 2014 (NASA/JPL-Caltech/SSI. Animation by Jason Major.)
While I admit I’m not 100% sure which moons these are, based on their apparent shapes, positions, and relative sizes I’d make my guess that these are 318-mile (511-km) -wide Enceladus and the 246-mile (395-km) -wide Mimas.
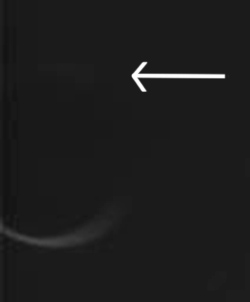
Possible location of icy spray, if Enceladus is in fact this moon’s real name
Cassini was 843,762 miles (1,357,903 km) from Saturn when the images were acquired. And, if the larger moon at left is Enceladus, I’m thinking south in these images is up based on the barely-perceptible presence of a lighter area along its top edge that could be icy spray from its southern geysers. (See enlarged detail at right.)
Saturn, of course, is on the right. A small segment of the bright arc of its backlit limb is what’s running diagonally down across the image.
These images have not yet been calibrated or cataloged by NASA or the Cassini team.
See the latest raw images from Cassini on JPL’s mission page here.
*I say “dark moons” but actually Enceladus and Mimas are pretty bright, both being composed of a lot of ice. Enceladus is actually the most reflective world in the Solar System!
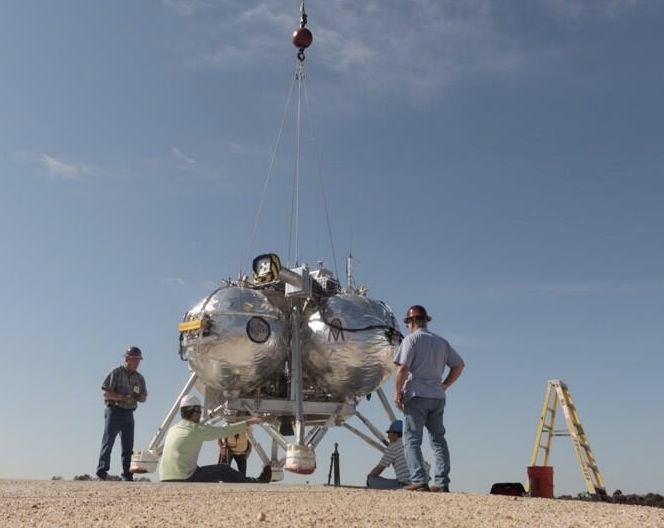
Engineers prepare the Morpheus craft for its FF9 test flight on March 11, 2014 (NASA)
)
NASA’s Project Morpheus nailed it again today with yet another successful free flight of their prototype lander, soaring higher, faster, and farther than ever before! Go Morpheus!
The FF9 test, which occurred at 3:41 p.m. EDT at Kennedy Space Center, saw the 2,300-lb (1000-kg) Morpheus craft rise to a height of 580 feet (177 meters) and travel 837 feet (255 m) downrange at 30 mph (48 km/h). After the 85-second flight the craft set down almost exactly on target — only about a foot (.3 m) off.
During today’s test flight the oxygen-and-methane-propelled Morpheus could have cleared the Washington Monument.
The next step is to integrate the Autonomous Landing and Hazard Avoidance Technology (ALHAT) sensors, which allow the craft to identify dangerous terrain and determine the best route to a safe landing — all by itself. This capability will be invaluable for future landings on unexplored surfaces on the Moon and Mars.
“It’s never been done,” said Dr. Jon Olansen, project manager of the Morpheus Project, in 2012. “We’ve never landed of the moon or Mars with real-time hazard detection and avoidance. Most of the Mars missions use air bags. They go where they go, they roll them and they stop… whatever comes, comes.”
Like many kids his age, 4-year-old Lucas Whiteley is fascinated about space and astronauts and has a lot of questions to ask. Unlike most kids, though, Lucas got his answers directly from a NASA engineer, with a custom-made video no less!
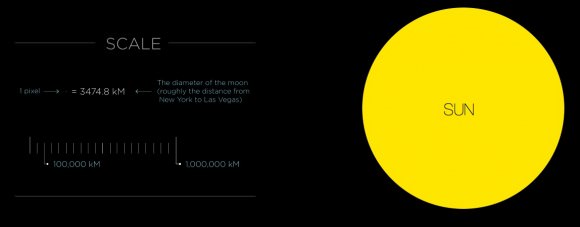
One of my favorite pet peeves is the inability of conventional models to accurately convey the gigantic scale of the Solar System. Most of us grew up with models of the planets made of wood or plastic or spray painted styrofoam balls impaled on bent wire hangers (don’t tell Mommy), or, more commonly, illustrations on posters and in textbooks. While these can be fun to look at and even show the correct relative sizes of the planets (although usually not as compared to the Sun) there’s one thing that they simply cannot relate to the viewer: space is really, really, really big.
Now there are some more human-scale models out there that do show how far the planets are from each other, but many of them require some walking, driving, or even flying to traverse their full distances. Alternatively, thanks to the magic of web pages which can be any size you like limited only by the imagination of the creator (and the patience of the viewer), accurate models can be easily presented showing the average (read: mind-blowingly enormous) distances between the planets… and no traveling or wire hangers required.
Despite their similar apparent sizes in our sky, the Moon and Sun are (obviously) quite different in actual size. Which is a good thing for us. (Credit: Josh Worth)
Created by designer Josh Worth, “If the Moon Were Only 1 Pixel: A Tediously Accurate Scale Model of the Solar System” uses a horizontally-sliding HTML page to show how far it is from one planet to another, as well as their relative sizes, based on our Moon being just a single pixel in diameter (and everything lined up neatly in a row, which it never is.) You can use the scroll bar at the bottom of the page or arrow keys to travel the distances or, if you want to feel like you’re at least getting some exercise, scroll with your mouse or computer’s swipe pad (where applicable.) You can also use the astronomical symbols at the top of the page to “warp” to each planet.
Just try not to miss anything — it’s a surprisingly big place out there.
“You may think it’s a long way down the road to the chemist’s, but that’s just peanuts to space.”
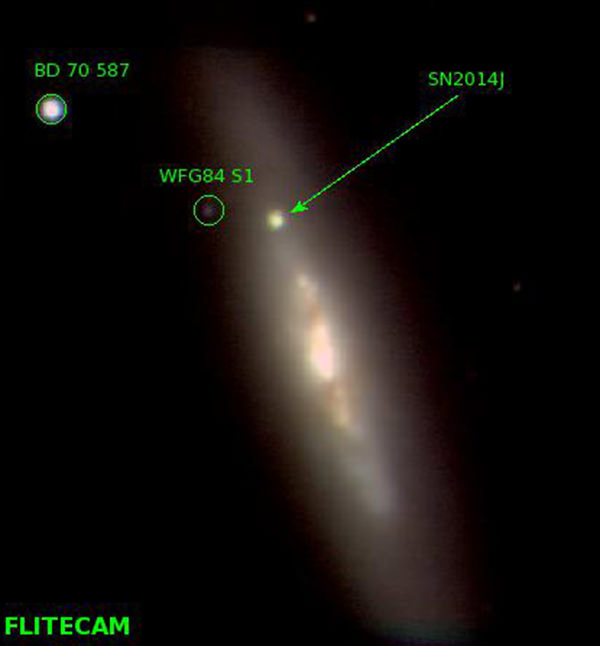
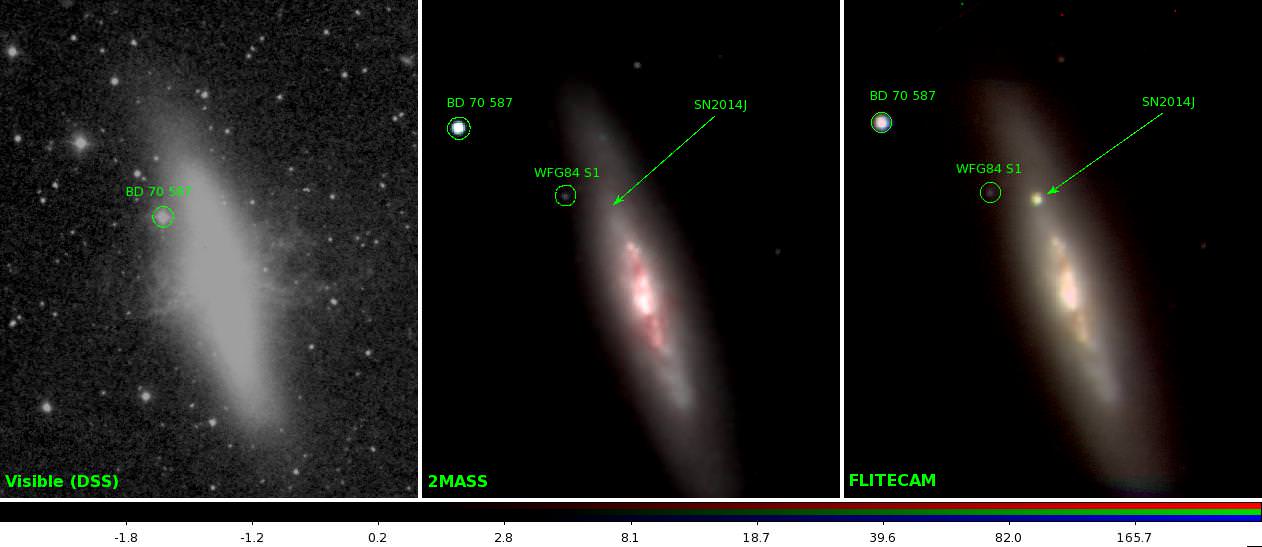
This Image of M82 including a supernova at near-infrared wavelengths J, H, and K (1.2, 1.65, and 2.2 microns), made Feb. 20 by the FLITECAM instrument on SOFIA. (NASA/SOFIA/FLITECAM team/S. Shenoy)
Astronomers wanting a closer look at the recent Type Ia supernova that erupted in M82 back in January are in luck. Thanks to NASA’s Stratospheric Observatory for Infrared Astronomy (SOFIA) near-infrared observations have been made from 43,000 feet — 29,000 feet higher than some of the world’s loftiest ground-based telescopes.
(And, technically, that is closer to M82. If only just a little.)
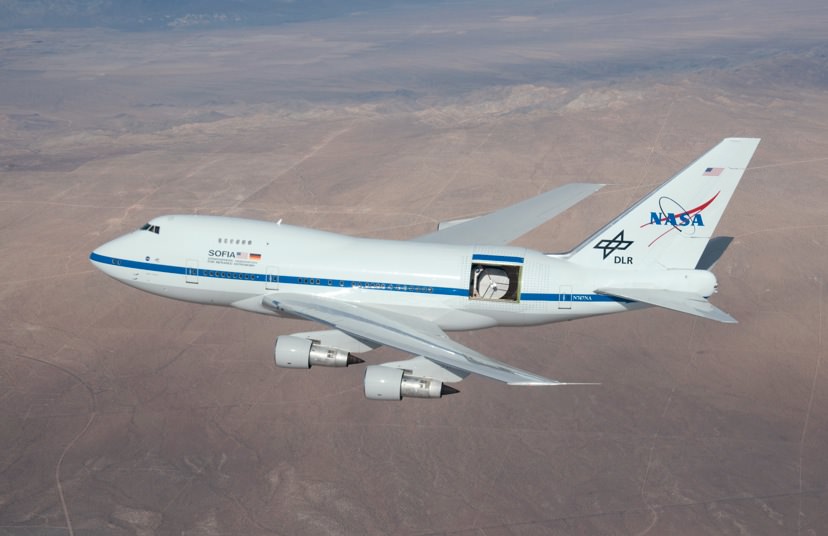
All sarcasm aside, there really is a benefit from that extra 29,000 feet. Earth’s atmosphere absorbs a lot of wavelengths of the electromagnetic spectrum, especially in the infrared and sub-millimeter ranges. So in order to best see what’s going on in the Universe in these very active wavelengths, observational instruments have to be placed in very high, dry (and thus also very remote) locations, sent entirely out into space, or, in the case of SOFIA, mounted inside a modified 747 where they can simply be flown above 99% of the atmosphere’s absorptive water vapor.
NASA’s airborne SOFIA observatory (SOFIA/USRA)
During a recent 10-hour flight over the Pacific, researchers aboard SOFIA turned their attention to SN2014J, one of the closest Type Ia “standard candle” supernovas that have ever been seen. It appeared suddenly in the relatively nearby Cigar Galaxy (M82) in mid-January and has since been an exciting target of observation for scientists and amateur skywatchers alike.
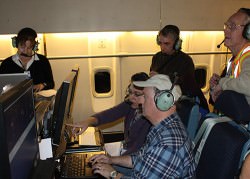
In addition to getting a bird’s-eye-view of a supernova, they used the opportunity to calibrate and test the FLITECAM (First Light Infrared Test Experiment CAMera) instrument, a near infrared camera with spectrographic capabilities mounted onto SOFIA’s 2.5-meter German-built main telescope.
What they’ve found are the light signatures of heavy metals being ejected by the exploding star. (Rock on, SN2014J.)
“When a Type Ia supernova explodes, the densest, hottest region within the core produces nickel 56,” said Howie Marion from the University of Texas at Austin, a co-investigator aboard the flight. “The radioactive decay of nickel-56 through cobalt-56 to iron-56 produces the light we are observing tonight. At this life phase of the supernova, about one month after we first saw the explosion, the H- and K-band spectra are dominated by lines of ionized cobalt. We plan to study the spectral features produced by these lines over a period of time and see how they change relative to each other. That will help us define the mass of the radioactive core of the supernova.”
Three images of M82 and the supernova SN2014J, including one from the FLITECAM instrument on SOFIA (right). Credit: NASA/SOFIA/FLITECAM team/S. Shenoy
Further observations from SOFIA will help researchers learn more about the evolution of Type Ia supernovas, which in addition to being part of the life cycles of certain binary-pair stars are also valuable tools used by astronomers to determine distances to far-off galaxies.
Researchers work at the FLITECAM instrument station on board SOFIA on Feb. 20 (NASA/SOFIA/N. Veronico)
“To be able to observe the supernova without having to make assumptions about the absorption of the Earth’s atmosphere is great,” said Ian McLean, professor at UCLA and developer of FLITECAM. “You could make these observations from space as well, if there was a suitable infrared spectrograph to make those measurements, but right now there isn’t one. So this observation is something SOFIA can do that is absolutely unique and extremely valuable to the astronomical community.”
UPDATE 4 March 2014: The FY 2015 budget request proposed by the White House will effectively shelf the SOFIA mission, redirecting its funding toward planetary missions like Cassini and an upcoming Europa mission. Unfortunately, SOFIA’s flying days are now numbered, unless German partner DLR increases its contribution. Read more here.
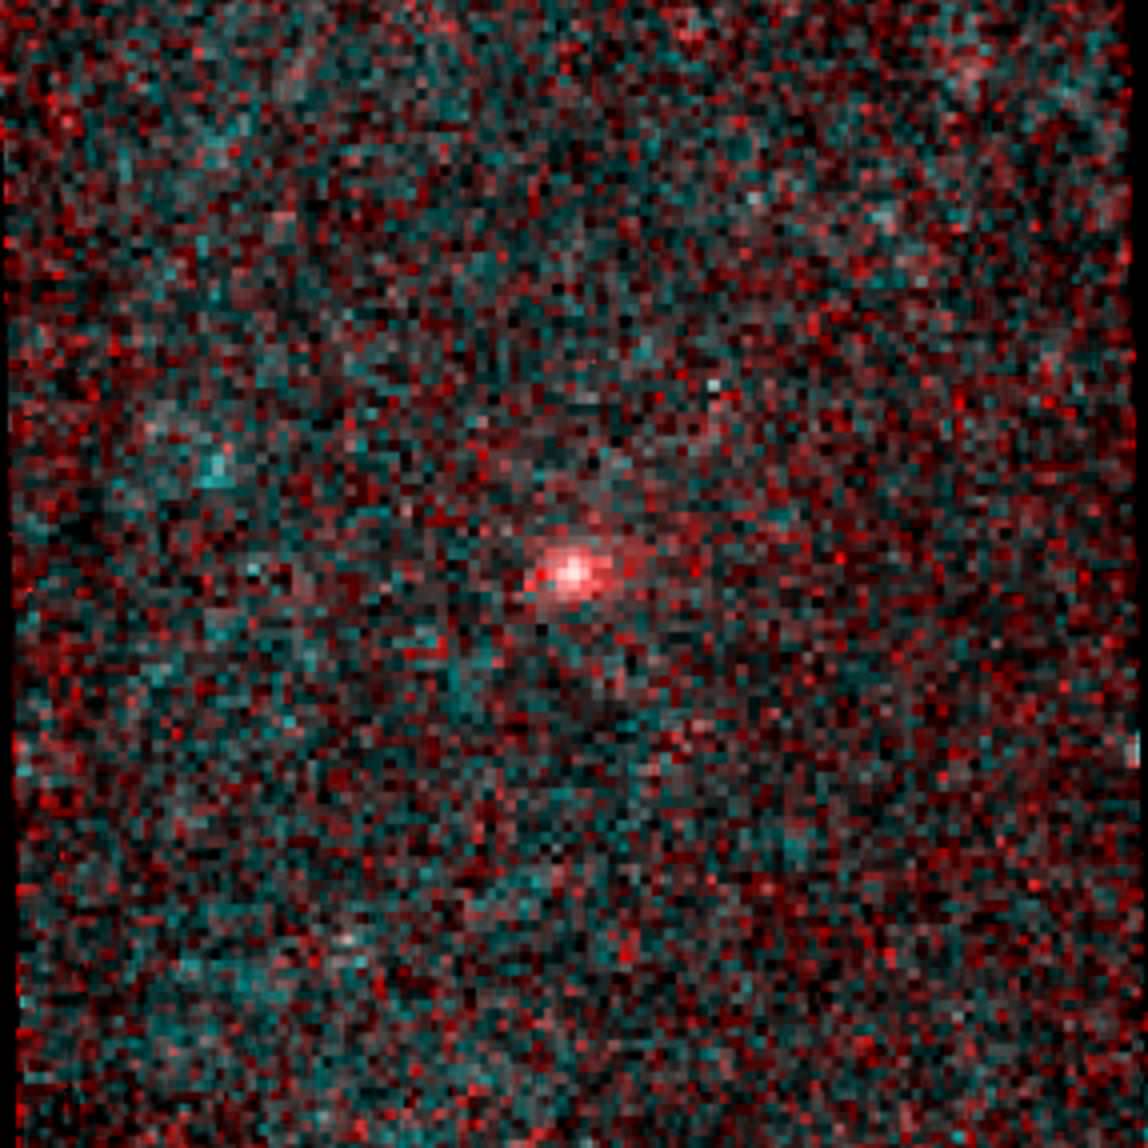
Infrared image of comet NEOWISE (C/2014 C3). Credit: NASA/JPL-Caltech
NASA’s NEOWISE mission — formerly known as just WISE — has identified the first comet of its new near-Earth object hunting career… and, according to mission scientists, it’s a “weirdo.”
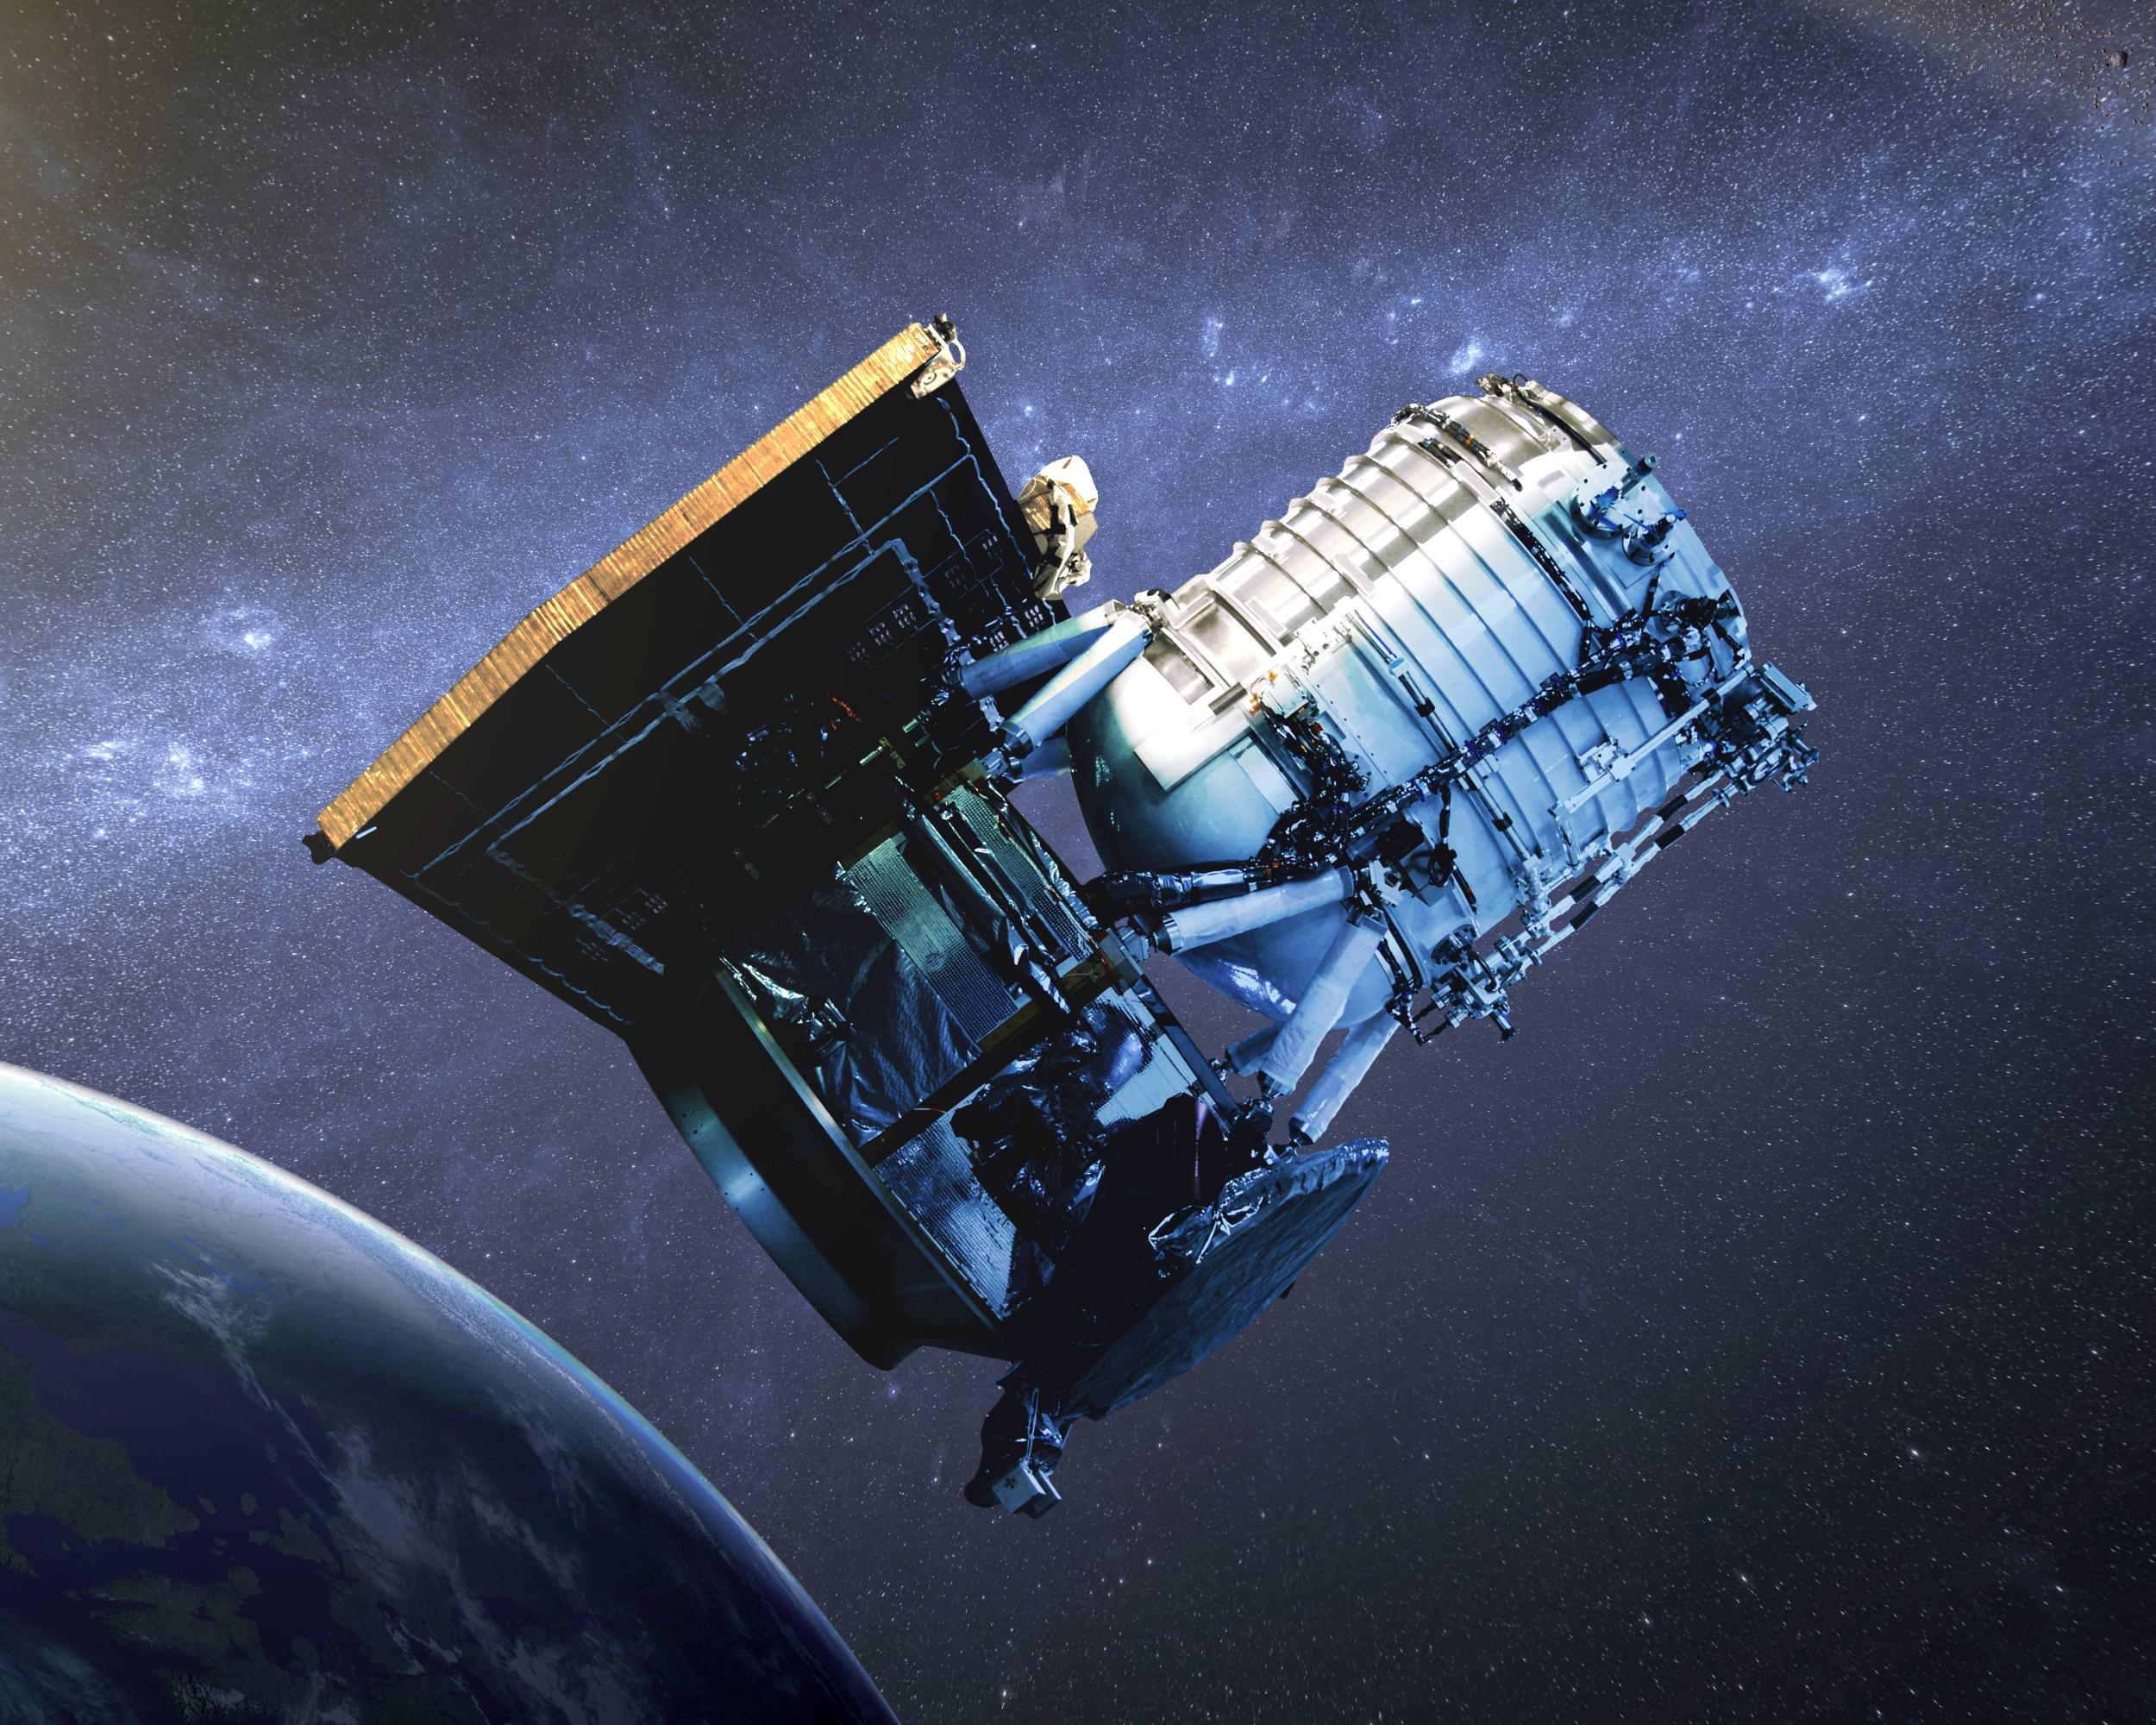
In its former life NASA’s WISE (Wide-field Infrared Survey Explorer) spacecraft scanned the entire sky in infrared wavelengths. It helped discover the galaxy’s coldest stars, the Universe’s brightest galaxies, and some of the darkest asteroids lurking in the main asteroid belt between Mars and Jupiter… as well as closer in to Earth’s neck of the woods.
After exhausting its supply of liquid coolant needed to shield itself from its own radiating heat, in 2011 WISE was put into a state of hibernation. It was awoken last year and rebranded NEOWISE, and set upon the task of locating unknown objects with orbits in the proximity of Earth’s.
Artist’s impression of the WISE satellite
To date several new asteroids have already been found by NEOWISE, and on February 14, 2014, it spotted its first comet.
“We are so pleased to have discovered this frozen visitor from the outermost reaches of our solar system,” said Amy Mainzer, NEOWISE principal investigator at JPL. “This comet is a weirdo — it is in a retrograde orbit, meaning that it orbits the sun in the opposite sense from Earth and the other planets.”
Designated “C/2014 C3 (NEOWISE),” the comet was 143 million miles (230 million km) away in the image above — a composite made from six infrared exposures. That’s 585 times the distance to the Moon, or about the average distance between the Earth and Mars.
The tail of the comet NEOWISE extends about 25,000 miles (40,000 km) to the right in the image.
Overall, C/2014 C3 (NEOWISE) was spotted six times before it moved out of range of the spacecraft’s view. The comet has a highly-eccentric 20-year orbit that takes it high above the plane of the Solar System and out past the orbit of Jupiter. Technically, with a perihelion distance greater than 1.3 AU, comet C/2014 C3 does not classify as a near-Earth object (and its orbit does not intersect Earth’s.) But it’s still good to know that NEOWISE is looking out for us.