You'd have to be in some kind of sense-of-wonder-repressed coma not to appreciate satellite images of Earth. If you are, then images from the NOAA's newest satellite might pull you out of it.
And they're only a taste of the fascinating images that it will provide.
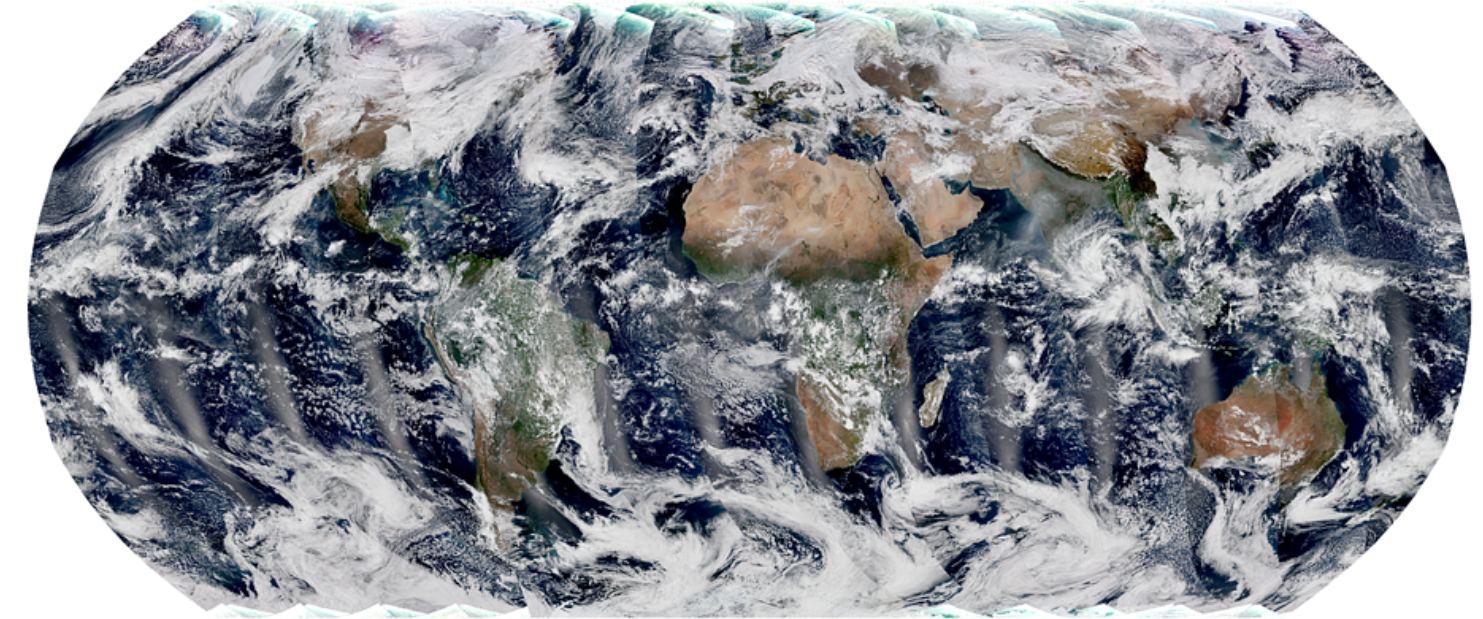
NOAA-21 is a polar-orbiting satellite that was launched on 10 November 2022. It'll orbit the Earth about 14 times per day, imaging the entire globe twice per day. It's the second one in the National Oceanic and Atmospheric Administration's latest generation of polar-orbiting, non-geosynchronous, environmental satellites. It's called the Joint Polar Satellite System (JPSS.) Their job is to provide global satellite data for weather prediction and climate change models. The NOAA operates a third polar-orbiting satellite called Suomi NPP.
If you're an Earth junkie like some of us at Universe Today, then you've already seen images from these satellites. The images are used to track all sorts of things: dust storms, forest fires, algae blooms, ice coverage, volcanic eruptions, heat waves, vast storms with their embedded lightning, and lots of other stuff.
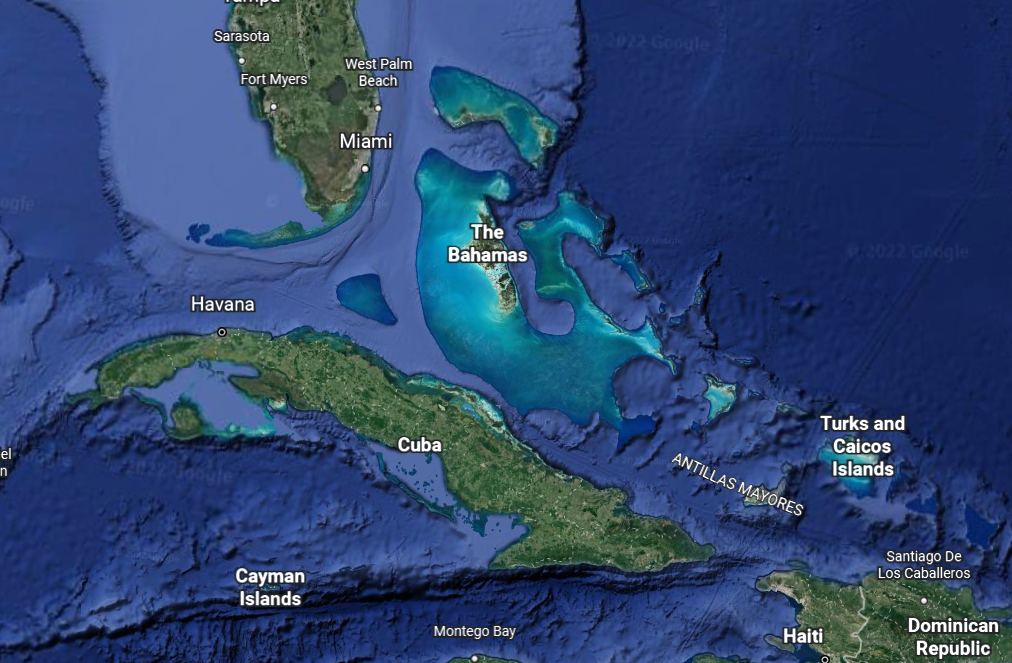
These initial images show two regions in particular. One shows bright blue water in the Caribbean Sea, the other shows smog in northern India.
"The turquoise colour that's visible around Cuba and the Bahamas in the bottom-left image above comes from sediment in the shallow waters around the continental shelf," said NOAA's Dr. Satya Kalluri, Joint Polar Satellite System program scientist. Sediment around continental shelves is called neritic sediment. It's carried from land into the ocean by wind, rivers, flowing ice, and other processes. (Obviously, not by ice in the Caribbean. Please don't email me.)
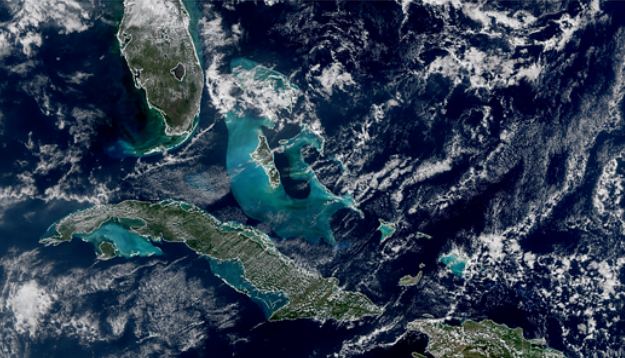
Scientists are interested in these sediments because they can analyze things like carbonates and isotopes in them to help model global and environmental change. Though we're accustomed to seeing only optical light images, including sediment and the blue waters they create, other instruments on satellites, like microwave and infrared sounders, provide deeper scientific data. That data helps researchers understand other oceanic features like flooding, river plumes, and even harmful algae blooms that can kill shellfish and poison people.
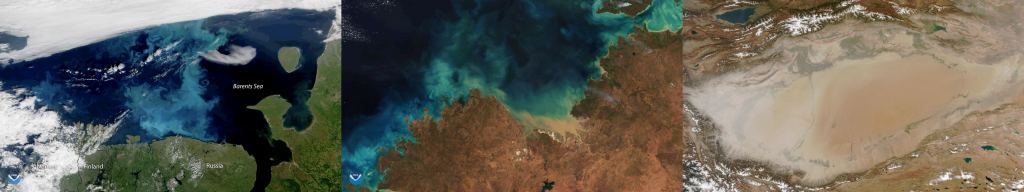
The image showing smog in India also sheds light on some of the dynamics of that large and highly-populated country.
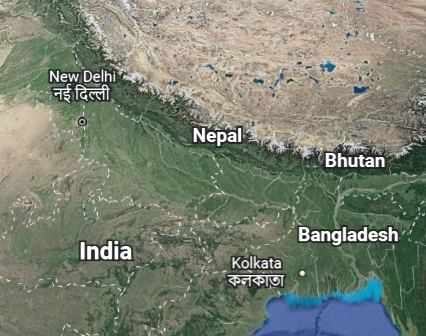
Northern India butts up against the Himalayas. The Himalayas are vast and contain some of Earth's highest mountains, including Mt. Everest. The range dominates the region's geography.
The Himalayas separate the Indo-Gangetic Plain, a vast fertile region in the Indian subcontinent, from the Tibetan Plateau. The mountain range causes enormous amounts of rainfall on the plains directly south of them during monsoons. The abundant glaciers in the Himalayas provide reliable, year-round water for agriculture. As a result, most of India's agriculture is concentrated here, as are over 400 million of its people. It's one of Earth's most densely-populated regions.
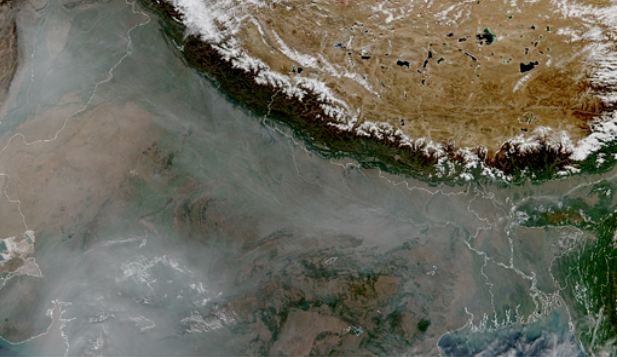
But as the image shows, the Himalayas also make smog concentrate here, right where so many people live. The satellite image shows how smog is a health hazard for hundreds of millions of people in the country's critical agricultural region.
"VIIRS (Visible Infrared Imaging Radiometer Suite) serves so many disciplines, it's an absolutely critical set of measurements," said Dr. James Gleason, NASA project scientist for the JPSS Flight Project. "VIIRS provides many different data products that are used by scientists in unrelated fields, from agricultural economists trying to do crop forecasts, to air quality scientists forecasting where wildfire smoke will be, to disaster support teams who count night lights to understand the impact of a disaster."
The NOAA now has three polar-orbiting, Earth-monitoring satellites with VIIRS onboard. That redundancy is important, according to Gleason, because we rely on satellites for so much now, and there's so much at stake.
"We had two VIIRS on orbit, and now we've got three," Dr. Gleason said. "We launch multiple weather satellites to make doubly and now triply sure we always have one going. Space is a dangerous environment. Stuff happens, and you can lose an instrument or a satellite, but we cannot lose the data. It's too important to too many people."