
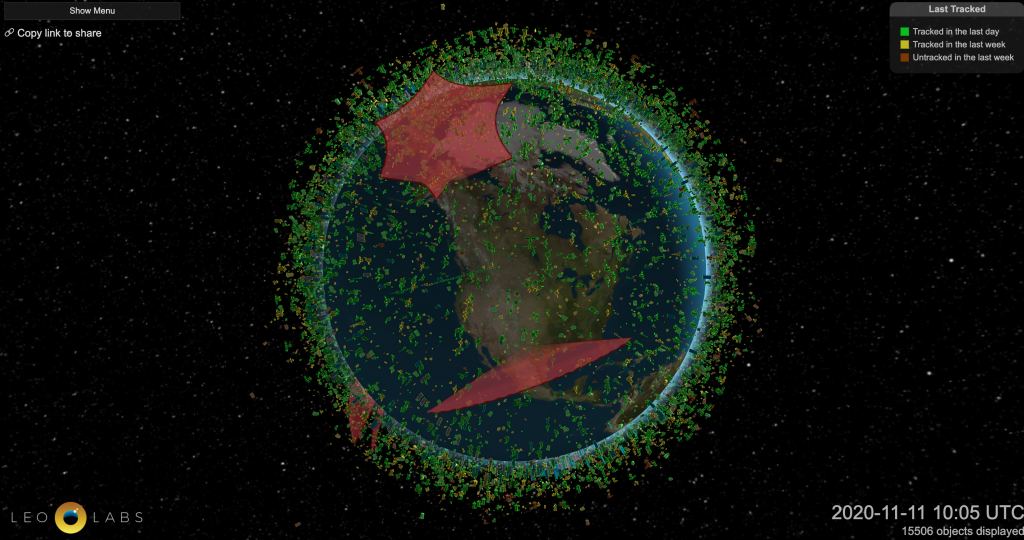
Founded in 2016, Menlo Park, California-based LeoLabs, is a mind-blowing company. They have built, and continue to expand, a network of ground-based, phased array radars worldwide to keep track of the thousands of operational satellites, defunct satellites, spent rocket bodies, and pieces of debris in orbit around the Earth. Not only is their radar technology ground-breaking, but they have built a spectacular, if not a little terrifying, digital visualization of the traffic in space that is free for the public to explore.
The visualization, seen here, is truly incredible. The company, whose founding members include astronaut Edward Lu, got started in a most remarkable way. Spun out from high-level research at SRI, the founders' initial work wasn't even focused on satellites and space debris at all.
VP of Business Development and Strategy Alan DeClerck recalls, "The original science was around ionospheric research." The initial radar array, built in Alaska, was meant to study the behavior of charged particles from the solar wind as they interact with the Earth's magnetic field. This interaction can cause issues with satellites, ground-based electrical equipment and is the origin of the beautiful aurora borealis.

DeClerck continued to describe how a graph of this initial data by co-founder and current Chief Technical Officer Michael Nicolls spawned the concept of LeoLabs. Referring to separating the data created by satellites and space debris from his ionosphere data, Nicolls had once pointed out a significant by-product of his research, saying, "...this [ionospheric data] was the relevant research data, and THIS[satellites and space debris] was all the noise not relevant to my science, so I got really good at identifying it and removing it. But in the end, it was the satellite and debris data that provided the commercial opportunity.
Once the radar data's incredible potential was realized, the company worked to expand the radar network and produce an LEO data platform with a beautiful way to interact with it visually. As DeClerck puts it, "In the early days as we presented this vision, we started hearing the phrase you’re creating the google maps of low Earth orbit! "
The Alaska facility was soon joined in 2017 by a second array based in Midland, Texas. These first two installations use *ultra high frequency* or UHF radar. These installations can detect space debris down to a size range of about 10 centimeters. Imagine being able to spot a grapefruit, traveling at 28,000 kph, from hundreds of kilometers away, and then accurately measuring its velocity precisely enough to map its future path for tens of thousands of kilometers!

LeoLabs' third radar facility has significantly upped the game from the first two facilities. Located in New Zealand and known as the Kiwi Space Radar, this facility uses S-band radar (even higher frequency than UHF). It has a resolution capable of tracking objects down to two centimeters, roughly the diameter of a US penny! The Kiwi Space Radar is the first facility of its kind built in the southern hemisphere. While the resolution improvement achieved by upgrading to S-band might seem like LeoLabs is just showing off, it is in this size regime that better tracking is most needed. According to DeClerck, around 95% of collision risks are from objects smaller than 10cm. The next three radar installations, which are expected to be complete by 2022, will all be S-band.
All of this spectacular radar technology, brilliant software, and visualizations are necessary because the crowded area of space called *low earth orbit* (this is the LEO in LeoLabs) can be a dangerous place. The nightmare scenario where orbital collisions cause a cascade of more debris leading to a runaway chain reaction of collisions (known as the Kessler Effect) is not beyond the realm of possibility. The preservation of LEO as a safe space (pun intended) is critical. As DeClerck says, "...of course, low Earth orbit is the staging area for everything else you could want to do in outer space, not to mention the growing dependency the global economy has on LEO for critical services including telecommunications and earth observation. "
DeClerck addresses the preservation of LEO, stating, "There are basically three things you can do to address the sustainability and safety of flight issue that derives from all this debris."
What are these three things?
- Avoid creating more space debris
- Monitor objects in space (and avoid them if possible)
- Clean LEO up
Step one is incumbent on space-launch firms and satellite operators to take appropriate measures to achieve, and considerable engineering advances support this today. Steps two and three are made much more achievable with the work of LeoLabs.
Commercial-grade versions of LeoLabs' products are available to space agencies and private firms through subscriptions. Actors in the space environment can take advantage of LeoLabs to monitor satellites and space debris to avoid collisions actively. DeClerck also mentions some ambitious and innovative firms, such as Astroscale, whose mission is to clean up space debris who could leverage the high spatial and temporal resolution of LeoLabs data and software.
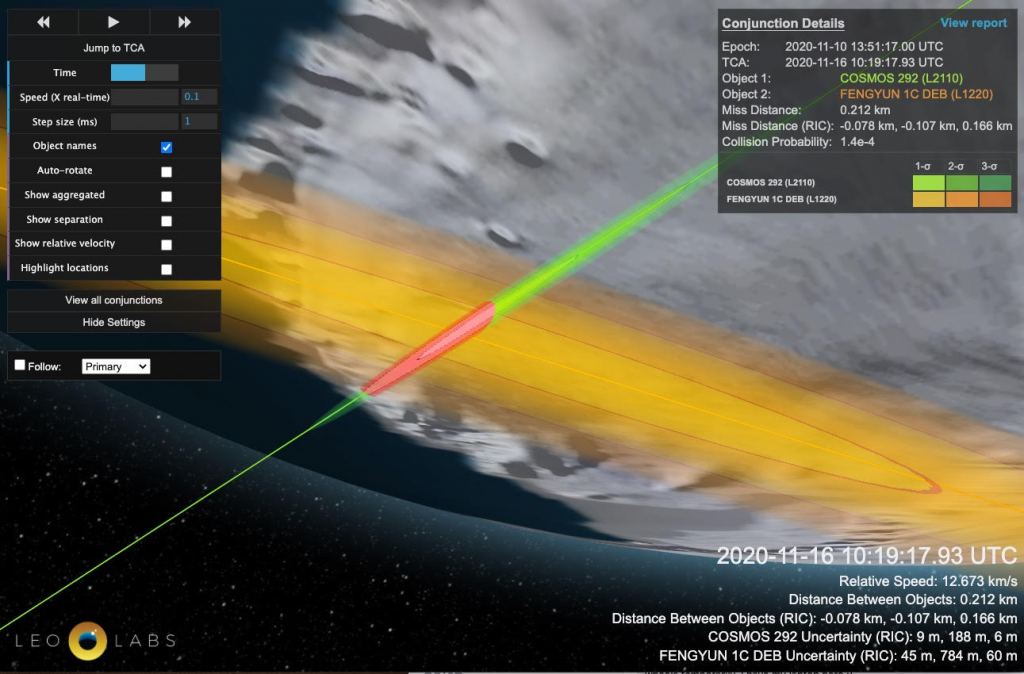
Collisions and near misses (thankfully MUCH more common) are predicted by LeoLabs and can even be visualized by the members of the public here. The software gives estimates of the likelihood of a collision and even estimates the relative speed of the two objects, giving an idea of the energy involved in these collisions. "Low-speed" collisions happen around one kilometer per second, while higher speed head-on collisions can occur well over 12 kps.
There are few places online as engaging for fans of space technology and science as LeoLabs. The visualizations are stunning and full of rabbit holes to spend hours exploring (you can specify constellations of satellites or even individual objects to track; it is mesmerizing). They are also doing an essential service to all space agencies and companies who use or intend to use outer space, and by extension, a vital service to us all back home on earth. There is something immensely satisfying about a company whose unlikely beginnings started with research on the ionosphere's behavior, finding an opportunity to gather satellite and space debris data, and then combining that with spectacular software engineering to produce such an elegant and effective product.
Learn More:
LeoLabs
Close Call in January 2020