The Sun Probably Lost a Binary Twin Billions of Years Ago

Stardust in the Perseus Molecular Cloud, a star-forming region in the Perseus constellation. Credit & Copyright: Lorand Fenyes

For us Earthlings, life under a single Sun is just the way it is. But with the development of modern astronomy, we’ve become aware of the fact that the Universe is filled with binary and even triple star systems. Hence, if life does exist on planets beyond our Solar System, much of it could be accustomed to growing up under two or even three suns. For centuries, astronomers have wondered why this difference exists and how star systems came to be.

Whereas some astronomers argue that individual stars formed and acquired companions over time, others have suggested that systems began with multiple stars and lost their companions over time. According to a new study by a team from UC Berkeley and the Harvard-Smithsonian Center for Astrophysics (CfA), it appears that the Solar System (and other Sun-like stars) may have started out as binary system billions of years ago.

This study, titled “Embedded Binaries and Their Dense Cores“, was recently accepted for publication in the Monthly Notices of the Royal Astronomical Society. In it, Sarah I. Sadavoy – a radio astronomer from the Max Planck Institute for Astronomy and the CfA – and Steven W. Stahler (a theoretical physicist from UC Berkeley) explain how a radio surveys of a star nursery led them to conclude that most Sun-like stars began as binaries.

The dark molecular cloud, Barnard 68, is a stellar nursery that can only be studied using radio astronomy. Credit: FORS Team, 8.2-meter VLT Antu, ESO

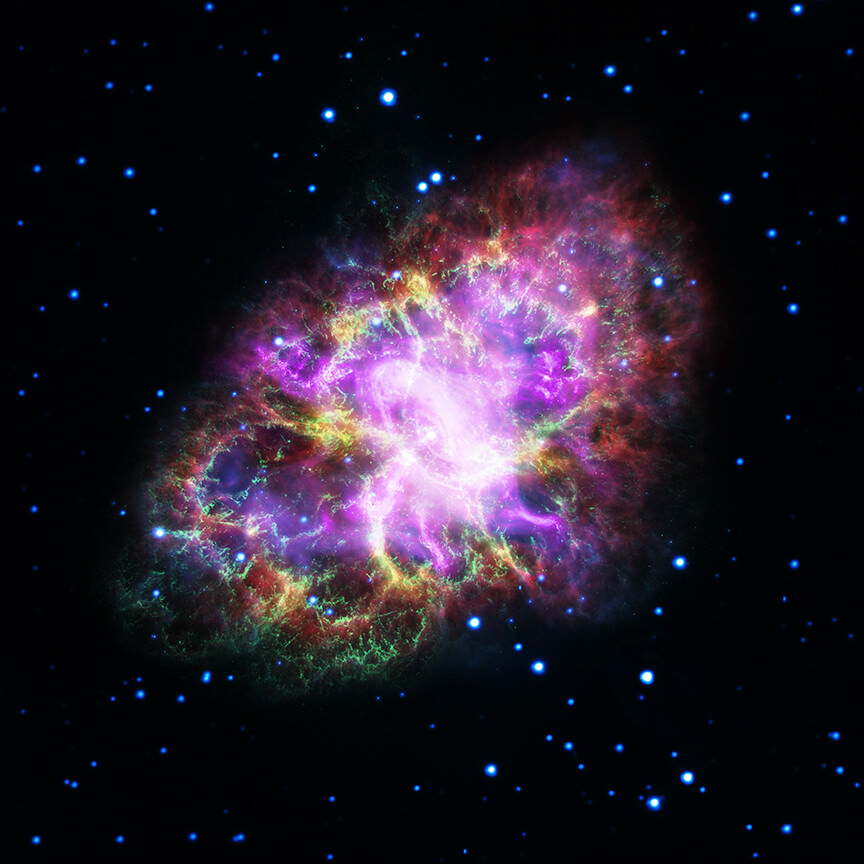
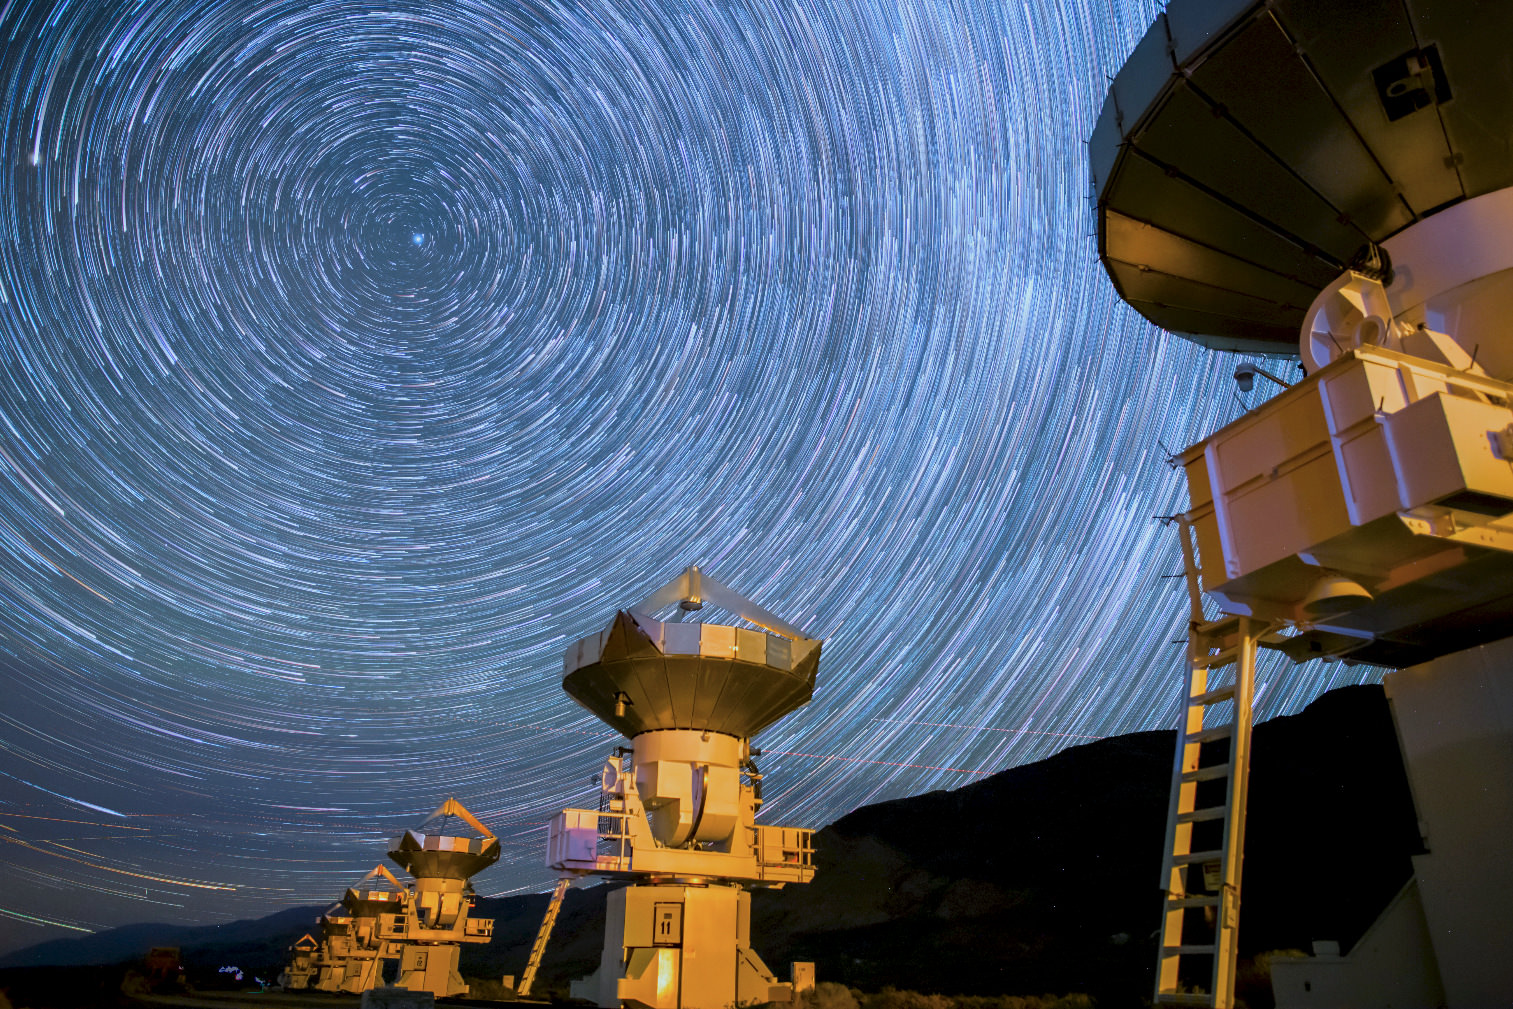
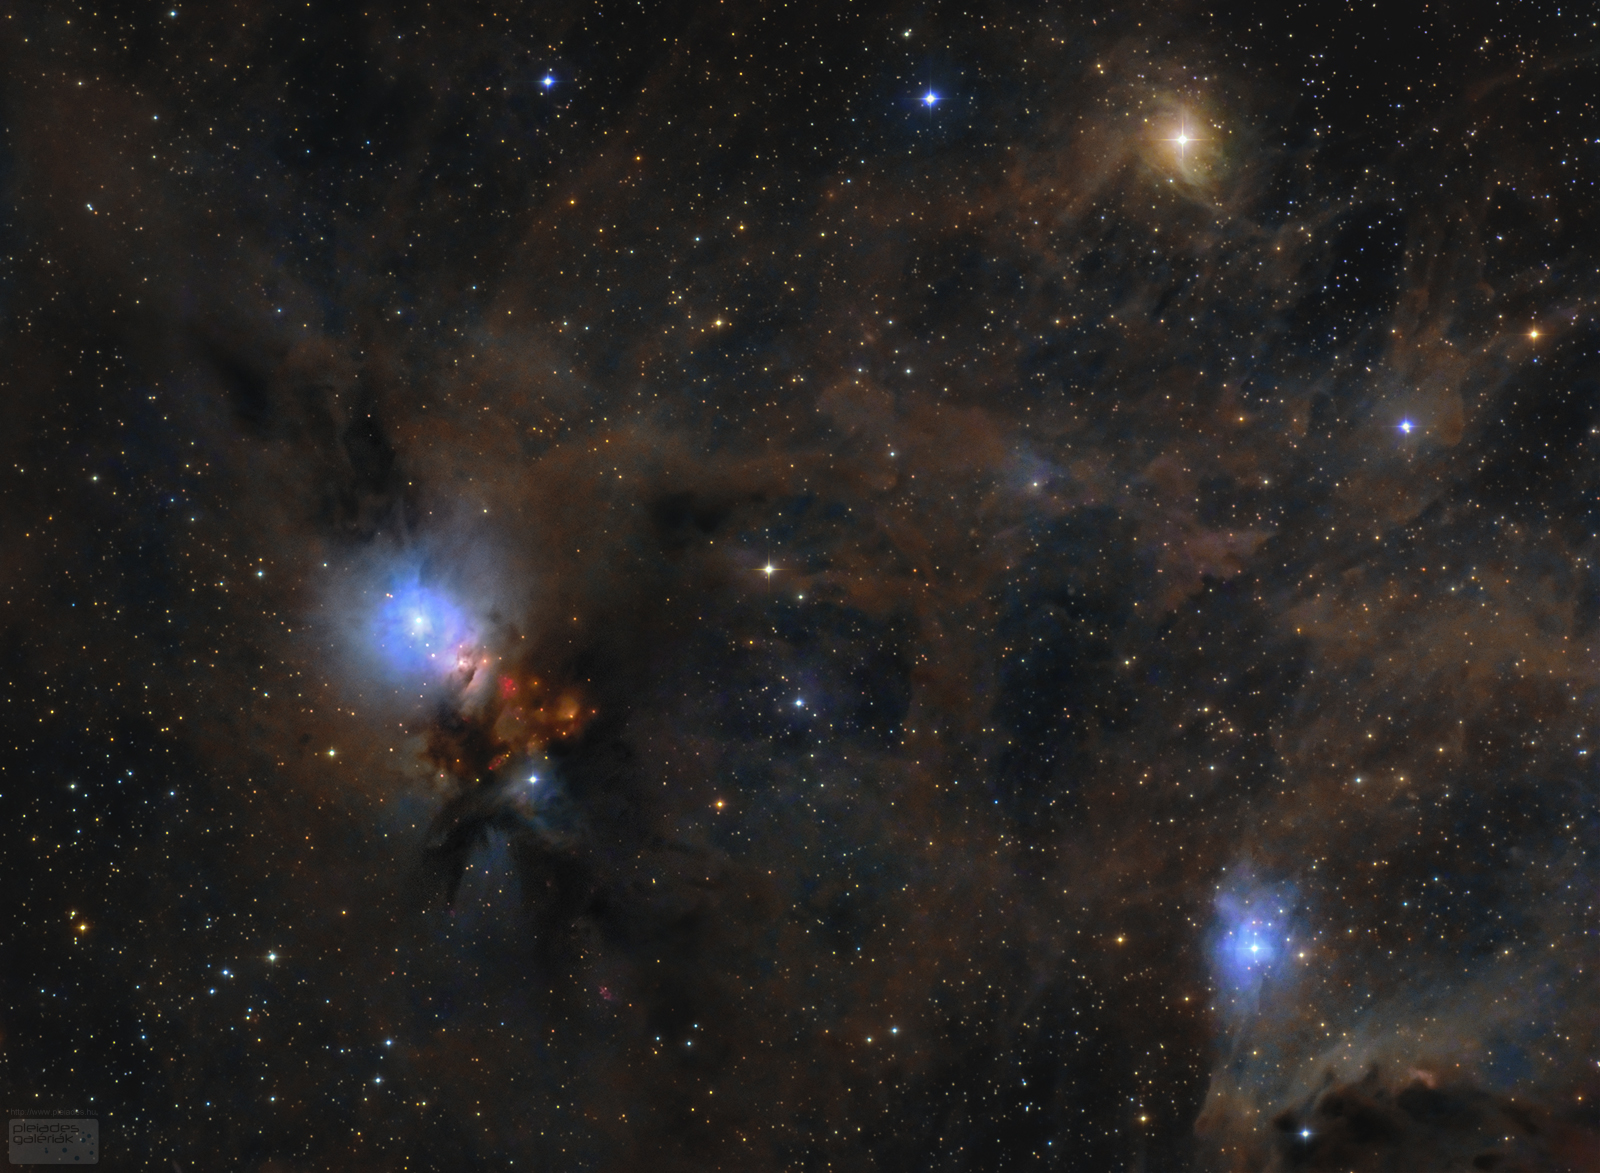
They began by examining the results of the first radio survey of the giant molecular cloud located about 600 light-years from Earth in the Perseus constellation – aka. the Perseus Molecular Cloud. This survey, known as the VLA/ALMA Nascent Disk and Multiplicity (VANDAM) survey, relied the Very Large Array in New Mexico and the Atacama Large Millimeter/submillimeter Array (ALMA) in Chile to conduct the first survey of the young stars (<4 million years old) in this star-forming region.

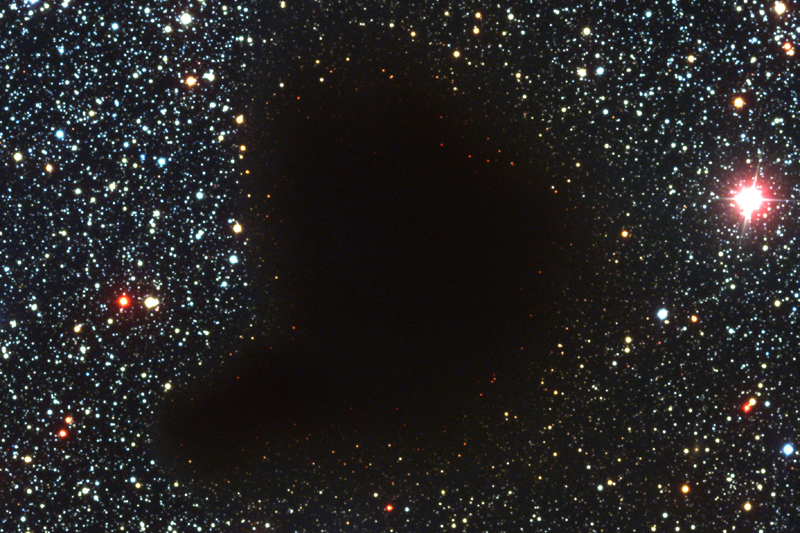
For several decades, astronomers have known that stars are born inside “stellar nurseries”, which are the dense cores that exist within immense clouds of dust and cold, molecular hydrogen. These clouds look like holes in the star field when viewed through an optical telescope, thanks to all the dust grains that obscure light coming from the stars forming within them and from background stars.

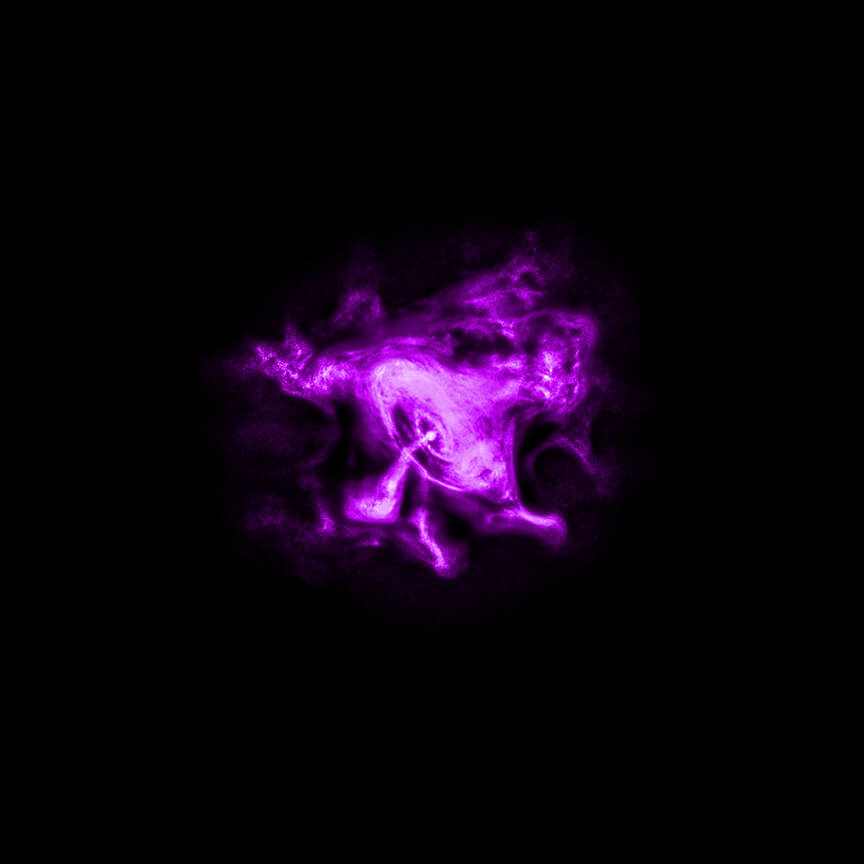
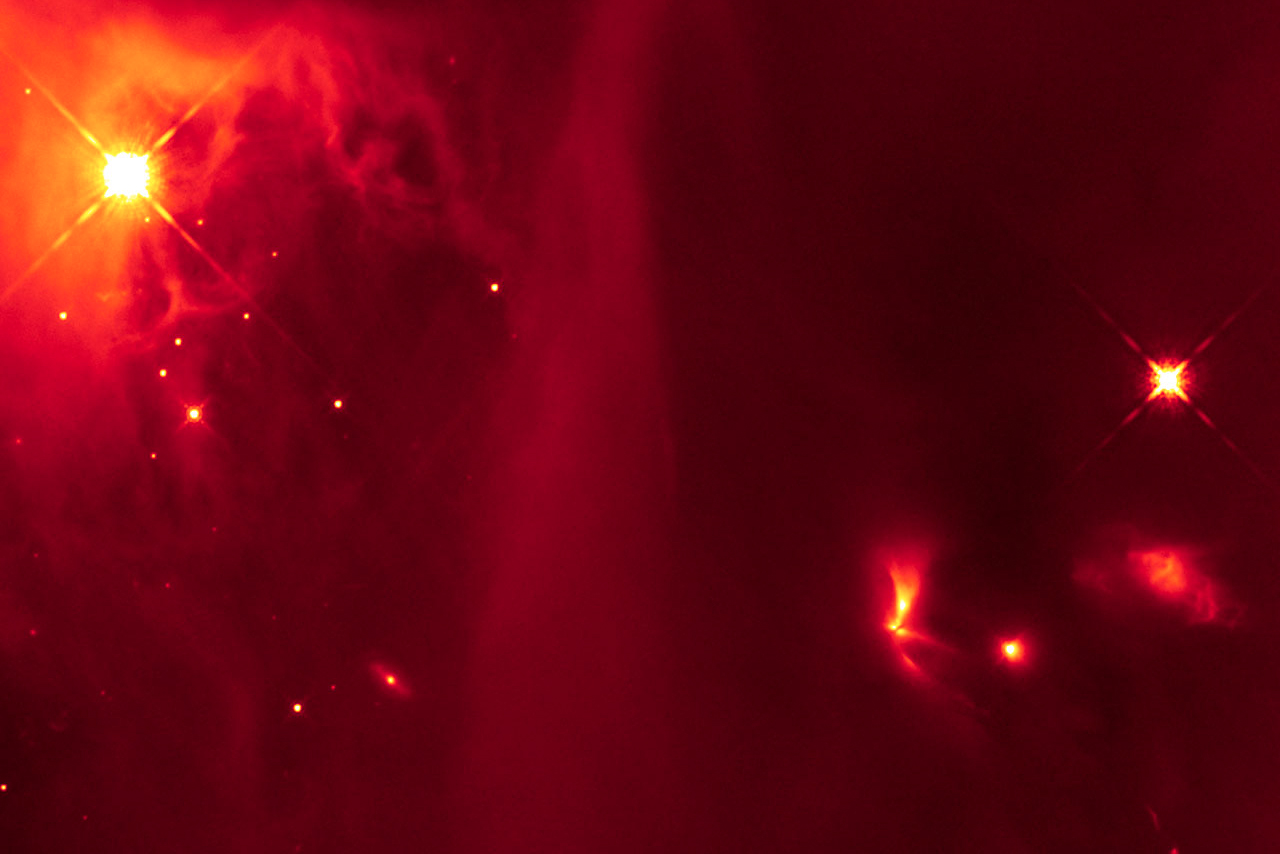
Radio surveys are the only way to probe these star-forming regions, since the dust grains emit radio transmissions and also do not block them. For years, Stahler has been attempting to get radio astronomers to examine molecular clouds in the hope of gathering information on the formation of young stars inside them. To this end, he approached Sarah Sadavoy – a member of the VANDAM team – and proposed a collaboration.

The two began their work together by conducting new observations of both single and binary stars within the dense core regions of the Perseus cloud. As Sadavoy explained in a Berkeley News press release, the duo were looking for clues as to whether young stars formed as individuals or in pairs:

“The idea that many stars form with a companion has been suggested before, but the question is: how many? Based on our simple model, we say that nearly all stars form with a companion. The Perseus cloud is generally considered a typical low-mass star-forming region, but our model needs to be checked in other clouds.”

Infrared image from the Hubble Space Telescope, showing a bright, fan-shaped object (lower right quadrant) thought to be a binary star that emits light pulses as the two stars interact. Credit: NASA/ESA/ J. Muzerolle (STScI)

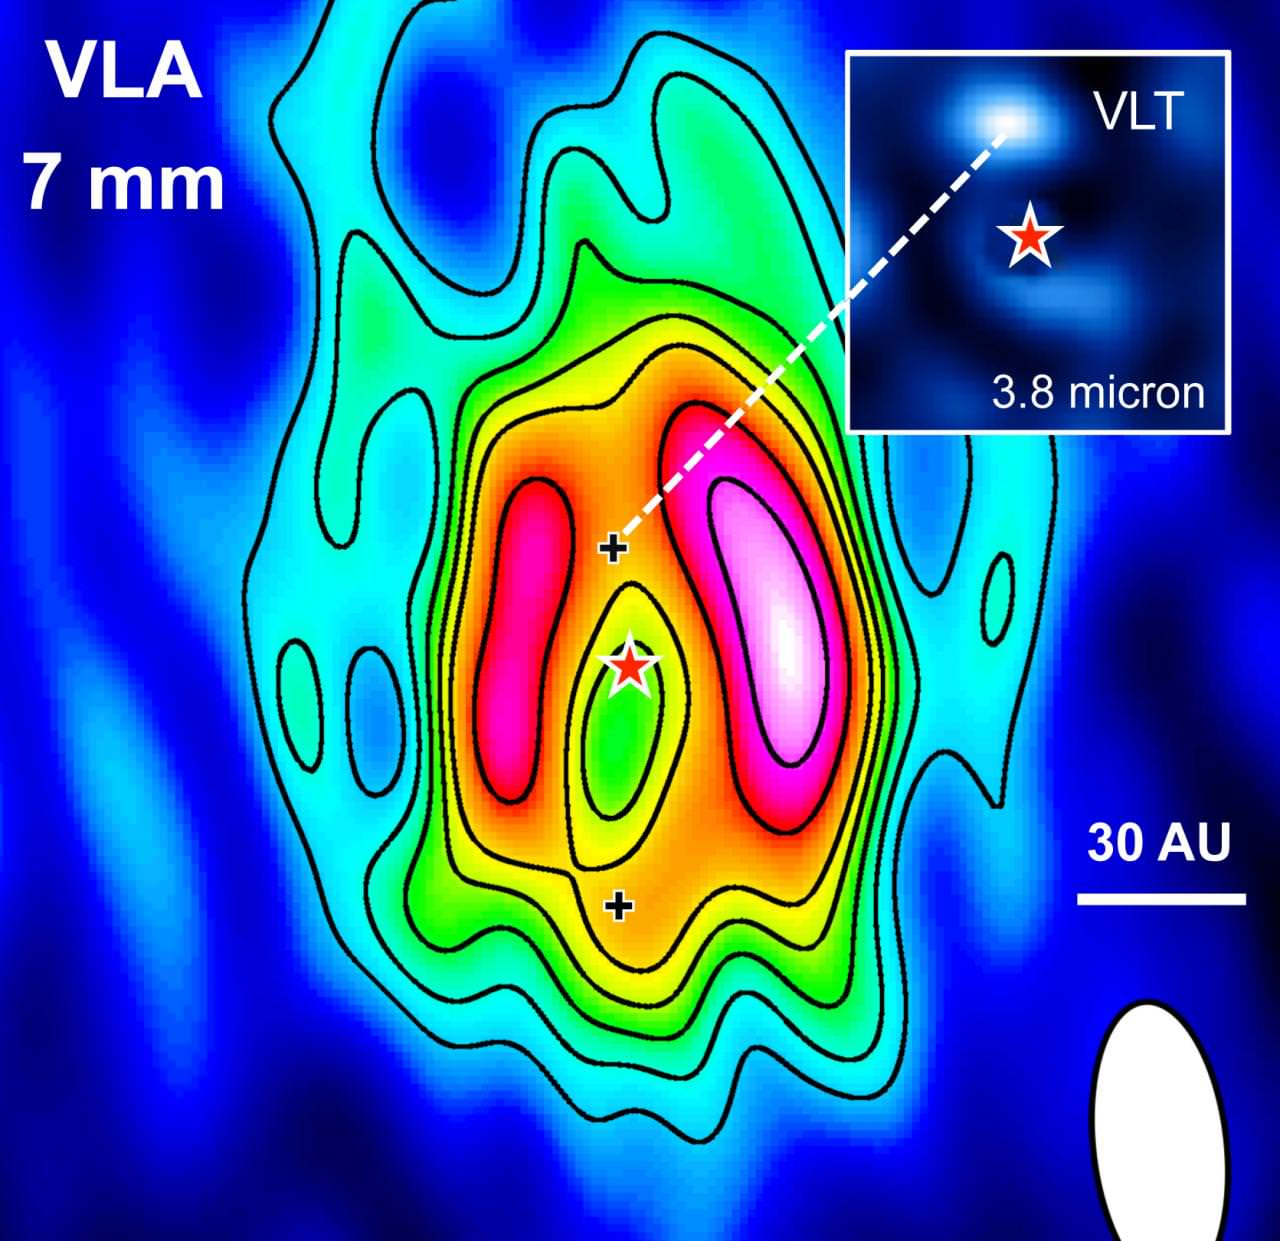
Their observations of the Perseus cloud revealed a series of Class 0 and Class I stars – those that are <500,000 old and 500,000 to 1 million years old, respectively – that were surrounded by egg-shaped cocoons. These observations were then combined with the results from VANDAM and other surveys of star forming regions – including the Gould Belt Survey and data gathered by SCUBA-2 instrument on the James Clerk Maxwell Telescope in Hawaii.

From this, they created a census of stars within the Perseus cloud, which included 55 young stars in 24 multiple-star systems (all but five of them binary) and 45 single-star systems. What they observed was that all of the widely separated binary systems – separated by more than 500 AU – were very young systems containing two Class 0 stars  that tended to be aligned with the long axis of their egg-shaped dense cores.

Meanwhile, the slightly older Class I binary stars were closer together (separated by about 200 AU) and did not have the same tendency as far as their alignment was concerned. From this, the study’s authors began mathematically modelling multiple scenarios to explain this distribution, and concluded that all stars with masses comparable to our Sun start off as wide Class 0 binaries. They further concluded that 60% of these split up over time while the rest shrink to form tight binaries.

“As the egg contracts, the densest part of the egg will be toward the middle, and that forms two concentrations of density along the middle axis,” said Stahler. “These centers of higher density at some point collapse in on themselves because of their self-gravity to form Class 0 stars. “Within our picture, single low-mass, sunlike stars are not primordial. They are the result of the breakup of binaries. ”

The two brightest stars of the Centaurus constellation, the binary star system of Alpha Centauri. Credit: Wikipedia Commons/Skatebiker

Findings of this nature have never before been seen or tested. They also imply that each dense core within a stellar nursery (i.e. the egg-shaped cocoons, which typically comprise a few solar masses) converts twice as much material into stars as was previously thought. As Stahler remarked:

“The key here is that no one looked before in a systematic way at the relation of real young stars to the clouds that spawn them. Our work is a step forward in understanding both how binaries form and also the role that binaries play in early stellar evolution. We now believe that most stars, which are quite similar to our own sun, form as binaries. I think we have the strongest evidence to date for such an assertion.”

This new data could also be the start of a new trend, where astronomers rely on radio telescopes to examine dense star-forming regions with the hopes of witnessing more in the way of stellar formations. With the recent upgrades to the VLA and the Atacama Large Millimeter/submillimeter Array (ALMA) in Chile, and the ongoing data provided by the SCUBA-2 survey in Hawaii, these studies may be coming sooner other than later.

Another interesting implication of the study has to do with something known as the “Nemesis hypothesis”. In the past, astronomers have conjectured that a companion star named “Nemesis” existed within our Solar System. This star was so-named because the theory held that it was responsible for kicking the asteroid which caused the extinction of the dinosaurs into Earth’s orbit. Alas, all attempts to find Nemesis ended in failure.

Artist’s impression of the binary star system of Sirius, a white dwarf star in orbit around Sirius (a white supergiant). Credit: NASA, ESA and G. Bacon (STScI)

As Steven Stahler indicated, these findings could be interpreted as a new take on the Nemesis theory:

“We are saying, yes, there probably was a Nemesis, a long time ago. We ran a series of statistical models to see if we could account for the relative populations of young single stars and binaries of all separations in the Perseus molecular cloud, and the only model that could reproduce the data was one in which all stars form initially as wide binaries. These systems then either shrink or break apart within a million years.”

So while their results do not point towards a star being around for the extinction of the dinosaurs, it is possible (and even highly plausible) that billions of years ago, the Solar planets orbited around two stars. One can only imagine what implications this could have for the early history of the Solar System and how it might have affected planetary formation. But that will be the subject of future studies, no doubt!

Further Reading: Berkeley News, arXiv

Stunning View of the Crab Nebula Just Got Five Times Better

Astronomers have produced a highly detailed image of the Crab Nebula, by combining data from five telescopes, spanning nearly the entire breadth of the electromagnetic spectrum. Credit: NASA, ESA, G. Dubner (IAFE, CONICET-University of Buenos Aires) et al.; A. Loll et al.; T. Temim et al.; F. Seward et al.; VLA/NRAO/AUI/NSF; Chandra/CXC; Spitzer/JPL-Caltech; XMM-Newton/ESA; and Hubble/STScI.

Images of the Crab Nebula are always a treat because it has such intriguing and varied structure. Also, just knowing that this stellar explosion was witnessed and recorded by people on Earth more than 900 years ago (with the supernova visible to the naked eye for about two years) gives this nebula added fascination.

A new image just might be the biggest Crab Nebula treat ever, as five different observatories combined forces to create an incredibly detailed view, with stunning details of the nebula’s interior region.

Data from the five telescopes span nearly the entire breadth of the electromagnetic spectrum, from radio waves seen by the Karl G. Jansky Very Large Array (VLA) to the powerful X-ray glow as seen by the orbiting Chandra X-ray Observatory. And, in between that range of wavelengths, the Hubble Space Telescope’s crisp visible-light view, and the infrared perspective of the Spitzer Space Telescope.

Astronomers have produced a highly detailed image of the Crab Nebula, by combining data from telescopes spanning nearly the entire breadth of the electromagnetic spectrum. This image combines data from five different telescopes: the VLA (radio) in red; Spitzer Space Telescope (infrared) in yellow; Hubble Space Telescope (visible) in green; XMM-Newton (ultraviolet) in blue; and Chandra X-ray Observatory (X-ray) in purple. Credit: NASA, ESA, G. Dubner (IAFE, CONICET-University of Buenos Aires) et al.; A. Loll et al.; T. Temim et al.; F. Seward et al.; VLA/NRAO/AUI/NSF; Chandra/CXC; Spitzer/JPL-Caltech; XMM-Newton/ESA; and Hubble/STScI.

The Crab is 6,500 light-years from Earth and spans about 10 light-years in diameter. The supernova that created it was first witnessed in 1054 A. D. At its center is a super-dense neutron star that is as massive as the Sun but with only the size of a small town. This pulsar rotates every 33 milliseconds, shooting out spinning lighthouse-like beams of radio waves and light. The pulsar can be seen as the bright dot at the center of the image.

Scientists say the nebula’s intricate shape is caused by a complex interplay of the pulsar, a fast-moving wind of particles coming from the pulsar, and material originally ejected by the supernova explosion and by the star itself before the explosion.

A new x-ray image of the Crab Nebula by the Chandra X-ray Observatory. Credit: X-ray: NASA/CXC/SAO.

For this new image, the VLA, Hubble, and Chandra observations all were made at nearly the same time in November of 2012. A team of scientists led by Gloria Dubner of the Institute of Astronomy and Physics (IAFE), the National Council of Scientific Research (CONICET), and the University of Buenos Aires in Argentina then made a thorough analysis of the newly revealed details in a quest to gain new insights into the complex physics of the object. They are reporting their findings in the Astrophysical Journal (see the pre-print here).

About the central region, the team writes, “The new HST NIR [near infrared] image of the central region shows the well-known elliptical torus around the pulsar, composed of a series of concentric narrow features of variable intensity and width… The comparison of the radio and the X-ray emission distributions in the central region suggests the existence of a double-jet system from the pulsar, one detected in X-rays and the other in radio. None of them starts at the pulsar itself but in its environs.”

“Comparing these new images, made at different wavelengths, is providing us with a wealth of new detail about the Crab Nebula. Though the Crab has been studied extensively for years, we still have much to learn about it,” Dubner said.

A multi-wavelength layout of the Crab Nebula. Credit: (Credit: X-ray: NASA/CXC/SAO; Optical: NASA/STScI; Infrared: NASA/JPL/Caltech; Radio: NSF/NRAO/VLA; Ultraviolet: ESA/XMM-Newton).

Read the team’s paper: Morphological properties of the Crab Nebula: a detailed multiwavelength study based on new VLA, HST, Chandra and XMM-Newton images
Sources: Chandra, Hubble

Take A Look Beneath Jupiter’s Clouds

This radio image of Jupiter was captured by the VLA in New Mexico. The three colors in the picture correspond to three different radio wavelengths: 2 cm in blue, 3 cm in gold, and 6 cm in red. Synchrotron radiation produces the pink glow around the planet. Image: Imke de Pater, Michael H. Wong (UC Berkeley), Robert J. Sault (Univ. Melbourne).

Jupiter’s Great Red Spot is easily one of the most iconic images in our Solar System, next to Saturn’s rings. The Great Red Spot and the cloud bands that surround it are easily seen with a backyard telescope. But much of what goes on behind the scenes on Jupiter has remained hidden.

When the Juno spacecraft arrives at Jupiter in about a month from now, we will be gifted some spectacular images from the cameras aboard that craft. To whet our appetites until then, astronomers using the Karl G. Jansky Very Large Array in New Mexico have created a detailed radio map of the gas giant. By using the ‘scope to peer 100 km past the cloud tops, the team has brought into view a mostly unexplored region of Jupiter’s atmosphere.

The team of researchers from UC Berkeley used the updated capabilities of the VLA to do this work. The VLA had its sensitivity improved by a factor of ten. “These Jupiter maps really show the power of the upgrades to the VLA,” said Bryan Butler, a member of the team and staff astronomer at the National Radio Astronomy Observatory in Socorro, New Mexico.

In the video below, two overlaid maps alternate back and forth. One is optical and the other is a radio image. Together, the two show some of the atmospheric activity that takes place under the cloud tops.

The team measured Jupiter’s radio emissions in wavelengths that pass through clouds. That allowed them to see 100 km (60 miles) deep into the atmosphere. This allowed them to not only determine the quantity and depth of ammonia in the atmosphere, but also to learn something about how Jupiter‘s internal heat source drives global circulation and cloud formation.

“We in essence created a three-dimensional picture of ammonia gas in Jupiter’s atmosphere, which reveals upward and downward motions within the turbulent atmosphere,” said principal author Imke de Pater, a UC Berkeley professor of astronomy.

These results will also help shed light on how other gas giants behave. Not just for Saturn, Uranus, and Neptune, but for all the gas giant exoplanets that have been discovered. de Pater said that the map bears a striking resemblance to visible-light images taken by amateur astronomers and the Hubble Space Telescope.

Two images of the Great Red Spot. The lower one is a Hubble optical image, showing the Spot and the familiar swirling cloud patterns. The upper image is a radio map of the same region, showing the movement of ammonia up to 90 km below the clouds. Credit: Radio image by Michael H. Wong, Imke de Pater (UC Berkeley), Robert J. Sault (Univ. Melbourne). (Optical image by NASA, ESA, A.A. Simon (GSFC), M.H. Wong (UC Berkeley), and G.S. Orton (JPL-Caltech) )

In the radio map, ammonia-rich gases are shown rising and forming into the upper cloud layers. The clouds are easily seen from Earth-bound telescopes. Ammonia-poor air is also shown sinking into the planet’s atmosphere. Hotspots, which appear bright in radio and thermal images of Jupiter, are regions of less ammonia that encircle the planet north of the equator. In between those hotspots, rich upwellings deliver ammonia from deeper in the atmosphere.

“With radio, we can peer through the clouds and see that those hotspots are interleaved with plumes of ammonia rising from deep in the planet, tracing the vertical undulations of an equatorial wave system,” said UC Berkeley research astronomer Michael Wong. Very nice.

“We now see high ammonia levels like those detected by Galileo from over 100 kilometers deep, where the pressure is about eight times Earth’s atmospheric pressure, all the way up to the cloud condensation levels,” de Pater said.

The Juno spacecraft isn't the first one to visit Jupiter. Galileo went there in the mid 90's, and Voyager 1 snapped a nice picture of the clouds on its mission in the '70s. Image: NASA
The Juno spacecraft isn’t the first one to visit Jupiter. Galileo went there in the mid 90’s, and Voyager 1 snapped a nice picture of the clouds on its mission. Image: NASA

This is fascinating stuff, and not just because it’s visually stunning. What this team is doing with the improved VLA dovetails nicely with what Juno will be doing when it gets set up in its orbit around Jupiter. One of Juno’s aims is to use microwaves to measure the water content in the atmosphere, in the same way that the VLA was used to measure ammonia.

In fact, the team will be pointing the VLA at Jupiter again, at the same time as Juno is detecting water. “Maps like ours can help put their data into the bigger picture of what’s happening in Jupiter’s atmosphere,” de Pater said.

The team was able to model the atmosphere by observing it over the entire frequency range between 4 and 18 gigahertz (1.7 – 7 centimeter wavelength), which enabled them to carefully model the atmosphere, according to David DeBoer, a research astronomer with UC Berkeley’s Radio Astronomy Laboratory.

“We now see fine structure in the 12 to 18 gigahertz band, much like we see in the visible, especially near the Great Red Spot, where we see a lot of little curly features,” Wong said. “Those trace really complex upwelling and downwelling motions there.”

The detailed observations the team obtained also help resolve a discrepancy in ammonia measurements in Jupiter’s atmosphere. In 1995, the Galileo probe measured ammonia at 4.5 times greater than the Sun, when it plunged through the atmosphere. VLA measurements prior to 2004 showed much less ammonia than that.

Study co-author Robert Sault, of the University of Melbourne in Australia, explained how this latest imaging solved that mystery. ““Jupiter’s rotation once every 10 hours usually blurs radio maps, because these maps take many hours to observe. But we have developed a technique to prevent this and so avoid confusing together the upwelling and downwelling ammonia flows, which had led to the earlier underestimate.”

Overall, it’s exciting times for studying Jupiter. The Juno mission promises to be as full of surprises as New Horizons was (we hope.)

Universe Today has covered the Juno mission, including an interview with the Principal Investigator, Scott Bolton.

The team’s paper is published in the journal Science, here.

Watch SETI-Seeking Radio Dishes Dance Across the Universe

A radio dish at Owens Valley Observatory in Owens Valley California. Credit and copyright: Credit and copyright: Harun Mehmedinovic and Gavin Heffernan.

Radio dishes always evoke wonder, as these giants search for invisible (to our eyes, anyway) radio signals from objects like distant quasars, pulsars, masers and more, including potential signals from extraterrestrials. This new timelapse from Harun Mehmedinovic and Gavin Heffernan of Sunchaser Pictures was shot at several different radio astronomy facilities — the Very Large Array (VLA) Observatory in New Mexico, Owens Valley Observatory in Owens Valley California, and Green Bank Observatory in West Virginia. All three of these facilities have been or are still being partly used by the SETI (Search for the Extraterrestrial Intelligence) program.

Watch the dishes dance in their search across the Universe!

The huge meteorite streaking across the sky above Very Large Array (2:40) is from the Aquarids meteor shower. The large radio telescope at Green Bank is where scientists first attempted to “listen” to presence of extraterrestrials in the galaxy. The Very Large Array was featured in the movie CONTACT (1997) while Owens Observatory was featured in THE ARRIVAL (1996).

This video was created for SkyGlowProject.com, a crowdfunded educational project that explores the effects and dangers of urban light pollution in contrast with some of the most incredible Dark Sky Preserves in North America.

The music is by Tom Boddy, and titled “Thoughtful Reflections.”

Thanks to Gavin Heffernan for sharing this video.

Screenshot from the DishDance timelapse. Credit and copyright: Harun Mehmedinovic and Gavin Heffernan.

SKYGLOW: DISHDANCE from Sunchaser Pictures on Vimeo.

Weekly Space Hangout – Oct. 16, 2015: Dr. Carolyn Porco and Cassini Update; Sexual Harassment in Astronomy and Academia

Host: Fraser Cain (@fcain)

Special Guest: Dr. Carolyn Porco is the leader of the Cassini Imaging Science team and the Director of the Cassini Imaging Central Laboratory for Operations (CICLOPS) at the Space Science Institute in Boulder, Colorado.

Guests:
Pamela Gay (cosmoquest.org / @cosmoquestx / @starstryder)
Morgan Rehnberg (cosmicchatter.org / @MorganRehnberg )
Kimberly Cartier (@AstroKimCartier )
Dave Dickinson (@astroguyz / www.astroguyz.com)
Nicole Gugliucci (cosmoquest.org / @noisyastronomer)
Alessondra Springmann (@sondy)
Rhys Taylor (G+: Rhys Taylor)
Continue reading “Weekly Space Hangout – Oct. 16, 2015: Dr. Carolyn Porco and Cassini Update; Sexual Harassment in Astronomy and Academia”

Have Astronomers Seen a Forming Planet in Action?

Image at 7 mm wavelength of the dusty disk around the star HD 169142 obtained with the Very Large Array (VLA) at 7 mm wavelength. The positions of the protoplanet candidates are marked with plus signs (+) (Osorio et al. 2014, ApJ, 791, L36). The insert in the upper right corner shows, at the same scale, the bright infrared source in the inner disk cavity, as observed with the Very Large Telescope (VLT) at 3.8 micron wavelength (Reggiani et al. 2014, ApJ, 792, L23).

Huge disks of dust and gas encircle many young stars. Some contain circular gaps — likely the result of forming planets carving out cavities along their orbital paths — that make the disks look more like ripples in a pond than flat pancakes.

But astronomers know only a few examples, including the archetypal disk surrounding Beta Pictoris, of this transitional stage between the original disk and the young planetary system. And they have never spotted a forming planet.

Two independent research teams think they’ve observed precisely this around the star HD 169142, a young star with a disk that extends up to 250 astronomical units (AU), roughly six times greater than the average distance from the Sun to Pluto.

Mayra Osorio from the Institute of Astrophysics of Andalusia in Spain and colleagues first explored HD 169142’s disk with the Very Large Array (VLA) in New Mexico. The 27 radio dishes configured in a Y-shape allowed the team to detect centimeter-sized dust grains. Then combining their results with infrared data, which traces the presence of microscopic dust, the group was able to see two gaps in the disk.

One gap is located between 0.7 and 20 AU, and the second larger gap is located between 30 and 70 AU. In our Solar System the first would begin at the orbit of Venus and end at the orbit of Uranus, while the second would begin at the orbit of Neptune, pass Pluto’s orbit, and extend beyond.

“This structure already suggested that the disk was being modified by two planets or sub-stellar objects, but, additionally, the radio data reveal the existence of a clump of material within the external gap, located approximately at the distance of Neptune’s orbit, which points to the existence of a forming planet,” said Mayra Osorio in a news release.

Maddalena Reggiani from the Institute for Astronomy in Zurich and colleagues then tried to search for infrared sources in the gaps using the Very Large Telescope. They found a bright signal in the inner gap, which likely corresponds to a forming planet or a young brown dwarf, an object that isn’t massive enough to kick start nuclear fusion.

The team was unable to confirm an object in the second gap, likely due to technical limitations. Any object with a mass less than 18 times Jupiter’s mass will remain hidden in the data.

Future observations will shed more light on the exotic system, hopefully allowing astronomers to better understand how planets first form around young stars.

Both papers have been published in the Astrophysical Journal Letters.

Galaxy Violence Revealed! Cosmic Crash Shows Cluster Crunch

Galaxy clusters MACS J0717+3745 colliding about five billion light-years away from Earth. This is a composite image of visible light from the Hubble Space Telescope (background), X-ray data from the Chandra X-Ray Observatory (blue) and radio waves from the Very Large Array (red).Credit: Van Weeren, et al.; Bill Saxton, NRAO/AUI/NSF; NASA

Shock waves! Fast-moving particles! Magnetic fields! This image has it all. Behold the merging galaxy clusters MACS J0717+3745 about five billion light-years from our planet.

That funny red thing you see in the center is new data from the Karl G. Jansky Very Large Array showing a spot where “shocks caused by the collisions are accelerating particles that then interact with magnetic fields and emit the radio waves,” officials at the National Radio Astronomical Observatory stated.

“The complex shape of this region is unique; we’ve never spotted anything like this before,” stated Reinout van Weeren, an Einstein Fellow at the Harvard-Smithsonian Center for Astrophysics. “The shape probably is the result of the multiple ongoing collisions.”

This is a composite image of new exposures from VLA and the Chandra X-Ray Observatory, with an older image from the Hubble Space Telescope. And if you take a second look, there’s also a black hole: “The straight, elongated radio-emitting object is a foreground galaxy whose central black hole is accelerating jets of particles in two directions,” NRAO added. “The red object at bottom-left is a radio galaxy that probably is falling into the cluster.”

Astronomers presented their findings at the American Astronomical Society meeting this week in Boston.

Source: NRAO

Supernova Sweeps Away Rubbish In New Composite Image

The supernova remnant G352.7-0.1 in a composite image with X-rays from the Chandra X-Ray Telescope (blue), radio waves from the Very Large Array (pink), infrared information from the Spitzer Space Telescope (orange) and optical data from the Digital Sky Survey (white). Credit: X-ray: NASA/CXC/Morehead State Univ/T.Pannuti et al.; Optical: DSS; Infrared: NASA/JPL-Caltech; Radio: NRAO/VLA/Argentinian Institute of Radioastronomy/G.Dubner

Shining 24,000 light-years from Earth is an expanding leftover of a supernova that is doing a great cleanup job in its neighborhood. As this new composite image from NASA reveals, G352.7-0.1 (G352 for short) is more efficient than expected, picking up debris equivalent to about 45 times the mass of the Sun.

“A recent study suggests that, surprisingly, the X-ray emission in G352 is dominated by the hotter (about 30 million degrees Celsius) debris from the explosion, rather than cooler (about 2 million degrees) emission from surrounding material that has been swept up by the expanding shock wave,” the Chandra X-Ray Observatory’s website stated.

“This is curious because astronomers estimate that G352 exploded about 2,200 years ago, and supernova remnants of this age usually produce X-rays that are dominated by swept-up material. Scientists are still trying to come up with an explanation for this behavior.”

More information about G352 is available in the Astrophysical Journal and also in preprint version on Arxiv.

Source: Chandra X-Ray Telescope

Black Hole Steals Gas From Trillions Of Stars

A composite image (X-ray and optical wavelengths) showing galaxy cluster RX J1532.9+3021 and the black hole at its center. Credit: X-ray: NASA/CXC/Stanford/J.Hlavacek-Larrondo et al, Optical: NASA/ESA/STScI/M.Postman & CLASH team

Got gas?  The black hole in galaxy cluster RX J1532.9+3021 is keeping it all for itself and stopping trillions of stars from coming to be, according to new research. You can see data above from NASA’s Chandra X-ray Observatory (purple) and the Hubble Space Telescope (yellow).

The drama is taking place about 3.9 billion light-years from Earth, showing an extreme phenomenon that has been noted in other galaxies on smaller scales, Chandra officials stated.

“The large amount of hot gas near the center of the cluster presents a puzzle,” a statement read. “Hot gas glowing with X-rays should cool, and the dense gas in the center of the cluster should cool the fastest. The pressure in this cool central gas is then expected to drop, causing gas further out to sink in towards the galaxy, forming trillions of stars along the way. However, astronomers have found no such evidence for this burst of stars forming at the center of this cluster.”

Black hole with disc and jets visualization courtesy of ESA

What’s blocking the stars (according to data from Chandra and the National Science Foundation’s Karl G. Jansky Very Large Array) could be supersonic jets blasting from the black hole and shoving the gas in the area away, forming cavities on either side of the galaxy. These cavities, by the way, are immense — at 100,000 light-years across each, this makes them about as wide as our home galaxy, the Milky Way.

The big question is where that power came from. Perhaps the black hole is “ultramassive” (10 billion times of the sun) and has ample mass to shoot out those jets without eating itself up and producing radiation. Or, the black hole could be smaller (a billion times that of the sun) but spinning quickly, which would allow it to send out those jets.

You can find more details in a November 2013 paper from The Astrophysical Journal (also available in a prepublished version on Arxiv.) The research was led by Julie Hlavacek-Larrondo from Stanford University.

Source: Chandra X-Ray Observatory