No “Big Rip” in our Future: Chandra Provides Insights Into Dark Energy

Galaxy cluster Abell 85, seen by Chandra, left, and a model of the growth of cosmic structure when the Universe was 0.9 billion, 3.2 billion and 13.7 billion years old (now). Credit: Chandra

[/caption]
When you throw a ball up into the air, you expect gravity will eventually slow the ball, and it will come back down again. But what if you threw a ball up into the air and instead of coming back down, it accelerated away from you? That’s basically what is happening with our universe: everything is accelerating away from everything else. This acceleration was discovered in 1998, and scientists believe “dark energy” is responsible, a form of repulsive gravity, and it composes a majority of the universe, about 72%. We don’t know what it is yet, but now, for the first time, astronomers have clearly seen the effects of dark energy. Using the Chandra X-ray Observatory, scientists have tracked how dark energy has stifled the growth of galaxy clusters. Combining this new data with previous studies, scientists have obtained the best clues yet about what dark energy is, confirming its existence. And there’s good news, too: the expanding Universe won’t rip itself apart.

Previous methods of dark energy research measured Type Ia supernovae. The new X-ray results provide a crucial independent test of dark energy, long sought by scientists, which depends on how gravity competes with accelerated expansion in the growth of cosmic structures.

“This result could be described as ‘arrested development of the universe’,” said Alexey Vikhlinin of the Smithsonian Astrophysical Observatory in Cambridge, Mass., who led the research. “Whatever is forcing the expansion of the universe to speed up is also forcing its development to slow down.”

Vikhlinin and his colleagues used Chandra to observe the hot gas in dozens of galaxy clusters, which are the largest collapsed objects in the universe. Some of these clusters are relatively close and others are more than halfway across the universe.

The results show the increase in mass of the galaxy clusters over time aligns with a universe dominated by dark energy. It is more difficult for objects like galaxy clusters to grow when space is stretched, as caused by dark energy. Vikhlinin and his team see this effect clearly in their data. The results are remarkably consistent with those from the distance measurements, revealing general relativity applies, as expected, on large scales.

Previously, it wasn’t known for sure if dark energy was a constant across space, with a strength that never changes with distance or time, or if it is a function of space itself and as space expands dark energy would expand and get stronger. In other words, it wasn’t known if Einstein’s theory of general relativity and his cosmological constant was correct or if the theory would have to be modified for large scales.

But the Chandra study strengthens the evidence that dark energy is the cosmological constant, and is not growing in strength with time, which would cause the Universe to eventually rip itself apart.

“Putting all of this data together gives us the strongest evidence yet that dark energy is the cosmological constant, or in other words, that ‘nothing weighs something’,” said Vikhlinin. “A lot more testing is needed, but so far Einstein’s theory is looking as good as ever.”

These results have consequences for predicting the ultimate fate of the universe. If dark energy is explained by the cosmological constant, the expansion of the universe will continue to accelerate, and everything will disappear from sight of the Milky Way and its gravitationally bound neighbor galaxy, Andromeda. This won’t happen soon, but Vikhlinin said, “Double the age of Universe from today, and you will see strong affect. An astronomer would say this may be a good time to fund cosmological research because further down the road there will be nothing to observe!”

Vikhlinin’s paper can be found here.

Source: Chandra Press Release, press conference

Possible Cryovolcanoes on Titan

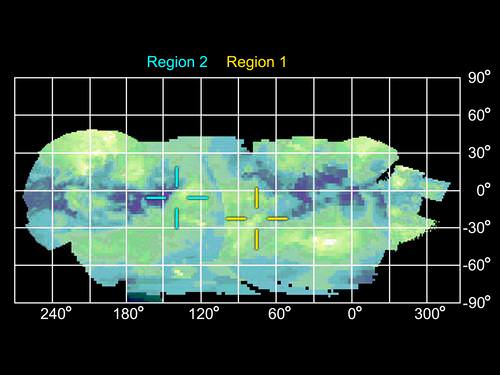
Infrared Map of Titan’s Active Regions. Credit: NASA/JPL

[/caption]
A cold volcano seems like an oxymoron, but active “cryovolcanoes” may actually be spewing a super-chilled liquid into the atmosphere of Saturn’s moon Titan. The beauty of Cassini’s long and now extended mission is the numerous flybys the spacecraft is able to take of several of Saturn’s most interesting moons. We reported yesterday how scientists have been able to see how Enceladus’ surface and its geysers are changing over time, and now data collected during several recent flybys of Titan show alternations in that moon’s surface as well. “Cassini data have raised the possibility that Titan’s surface is active,” said Jonathan Lunine, a Cassini interdisciplinary scientist from the Lunar and Planetary Laboratory, at the University of Arizona, Tucson . “This is based on evidence that changes have occurred on the surface of Titan, between flybys of Cassini, in regions where radar images suggest a kind of volcanism has taken place.”

Rather than erupting hot, molten rock, it is theorized that the cryovolcanoes of Titan would erupt volatiles such as water, ammonia and methane. Scientists have suspected cryovolcanoes might populate Titan, and the Cassini mission has collected data on several previous passes of the moon that suggest their existence. Imagery of the moon has included a suspect haze hovering over flow-like surface formations. Scientists point to these as signs of cryovolcanism there.

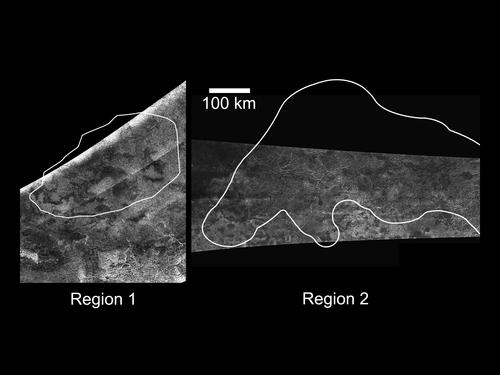
What led some Cassini scientists to believe that things are happening now were changes in brightness and reflectance detected at two separate and distinct regions of Titan. Reflectance is the ratio of light that radiates onto a surface to the amount reflected back. These changes were documented by Visible and Infrared Mapping Spectrometer data collected on Titan flybys from July 2004 to March 2006. In one of the two regions, the reflectance of the surface surged upward and remained higher than expected. In the other region, the reflectance shot up but then trended downward. There is also evidence that ammonia frost is present at one of the two changing sites. The ammonia was evident only at times when the region was inferred to be active. Watch a video of the changes.

“Ammonia is widely believed to be present only beneath the surface of Titan,” said Robert M. Nelson of JPL, a scientist for Cassini’s Visual and Infrared Mapping Spectrometer team. “The fact that we found it appearing at times when the surface brightened strongly suggests that material was being transported from Titan’s interior to its surface.”

Possible active Cryovolcanic Features on Titan.  Credit: NASA/JPL
Possible active Cryovolcanic Features on Titan. Credit: NASA/JPL

Some Cassini scientists indicate that such volcanism could release methane from Titan’s interior, which explains Titan’s seemingly continuous supply of fresh methane. Without replenishment, scientists say, Titan’s original atmospheric methane should have been exhausted long ago.

But other scientists aren’t certain that cryovolcanoes are responsible for the changes seen on Titan. Instead the changes might result from the transient appearances of ground “fogs” of ethane droplets very near Titan’s surface, driven by atmospheric rather than geophysical processes. Nelson has considered the ground fog option, stating, “There remains the possibility that the effect is caused by a local fog, but if so, we would expect it to change in size over time due to wind activity, which is not what we see.”

An alternative hypothesis to an active Titan suggests the Saturnian moon could be taking its landform evolution cues from a moon of Jupiter.

“Like Callisto, Titan may have formed as a relatively cold body, and may have never undergone enough tidal heating for volcanism to occur,” said Jeffrey Moore, a planetary geologist at the NASA Ames Research Center, Moffett Field, Calif. “The flow-like features we see on the surface may just be icy debris that has been lubricated by methane rain and transported downslope into sinuous piles like mudflows.”

But scientists will continue to analyze and collect more data in attempt to pinpoint exactly what is happening on Titan. Cassini’s next Titan flyby is scheduled for Dec. 21, when the spacecraft will come within 970 kilometers (603 miles) of its cloud-shrouded surface.

Source: JPL

Amazing Close-up Images Show Enceladus is Changing

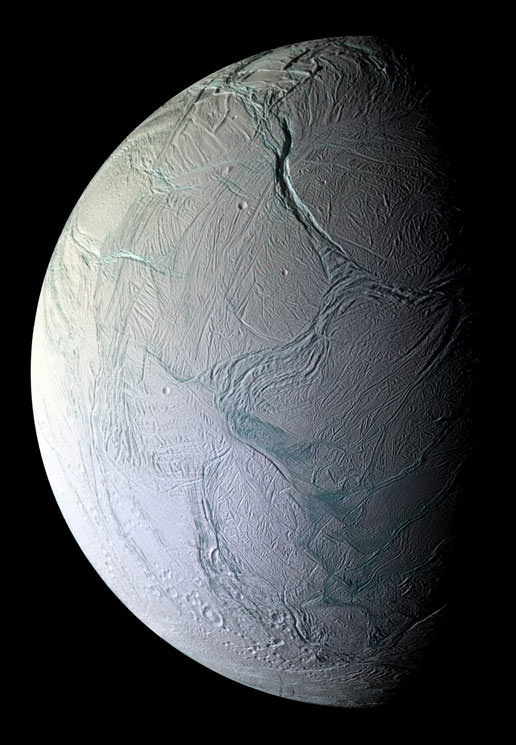
Cassini came within 25 kilometers (15.6 miles) of the surface of Enceladus on Oct. 5, 2008. Image credit: NASA/JPL/Space Science Institute

[/caption]
Saturn’s moon Enceladus not only has jets of water vapor spewing from vents on the southern hemisphere, but the moon’s surface in the same region shows evidence of changes over time, providing surprising indications of Earth-like tectonics. New high resolution images from the Cassini spacecraft’s recent flybys of Enceladus show close views of the moon’s distinctive “tiger stripe” fractures, yielding new insight into what may be happening inside the fractures. “Of all the geologic provinces in the Saturn system that Cassini has explored, none has been more thrilling or carries greater implications than the region at the southernmost portion of Enceladus,” said Carolyn Porco, Cassini imaging team leader.

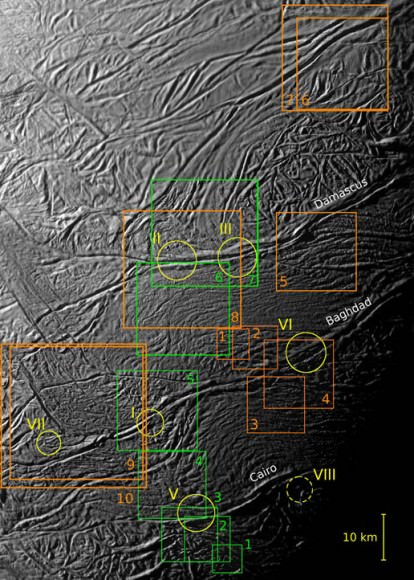
A special spacecraft maneuver dubbed “the skeet shoot” was employed to make smear-free imaging at close range possible. The ground track of the camera’s pointing was selected to cut swaths across three tiger stripes, or sulci, the prominent rifts through which jets of water vapor and ice particles are actively jetting. The full-resolution images are absolutely astounding. Take a look at the large images and movies here.

Cassini’s flybys on Aug. 11 and Oct. 31 of this year targeted Enceladus’ fractured southern region, and an Oct. 9 flyby took the spacecraft deep into the plume of water vapor and ice shooting out of the moon’s vents. Interestingly, the plume is not constant varies over time. Scientists think that condensation from the jets erupting from the surface may create ice plugs that close off old vents and force new vents to open. The opening and clogging of vents also corresponds with measurements indicating the plume varies from month to month and year to year. This movie shows the locations of the vents on a “spinning” Enceladus.

“We see no obvious distinguishing markings on the surface in the immediate vicinity of each jet source, which suggests that the vents may open and close and thus migrate up and down the fractures over time,” Porco said. “Over time, the particles that rain down onto the surface from the jets may form a continuous blanket of snow along a fracture.”

The varying cloud of vapor and particles extends into space and has a far-reaching effect on the entire Saturn system by supplying the ring system with fresh material and loading ionized gas from water vapor into Saturn’s magnetosphere.

Tiger stripes magnified.  Image credit: NASA/JPL/Space Science Institute
Tiger stripes magnified. Image credit: NASA/JPL/Space Science Institute

But most interesting is the evidence of movement of Enceladus’ surface, called “spreading.”

“Enceladus has Earth-like spreading of the icy crust, but with an exotic difference — the spreading is almost all in one direction, like a conveyor belt,” said Paul Helfenstein, Cassini imaging associate at Cornell University in Ithaca , N.Y. “Asymmetric spreading like this is unusual on Earth and not well understood.”

“Enceladus has asymmetric spreading on steroids,” Helfenstein added. “We are not certain about the geological mechanisms that control the spreading, but we see patterns of divergence and mountain-building similar to what we see on Earth, which suggests that subsurface heat and convection are involved.” This video demonstrates the observed tectonic spreading along tiger stripes in the South Polar Terrain of Enceladus.

The tiger stripes are analogous to the mid-ocean ridges on Earth’s seafloor where volcanic material wells up and creates new crust. Using Cassini-based digital maps of the south polar region of Enceladus, Helfenstein reconstructed a possible history of the tiger stripes by working backward in time and progressively snipping away older and older sections of the map. Each time he found that the remaining sections fit together like puzzle pieces.

With water vapor, organic compounds and excess heat emerging from Enceladus’ south polar terrain, scientists are intrigued by the possibility of a liquid-water-rich habitable zone beneath the moon’s south pole.

Cassini’s next flyby of Enceladus will be in November 2009.

The Cassini team presented their findings and recent images at the American Geophysical Union’s fall meeting in San Francisco.

Source: NASA, CICLOPS

“Clumpiness” of Mars Soil Clue to Climate Cycles

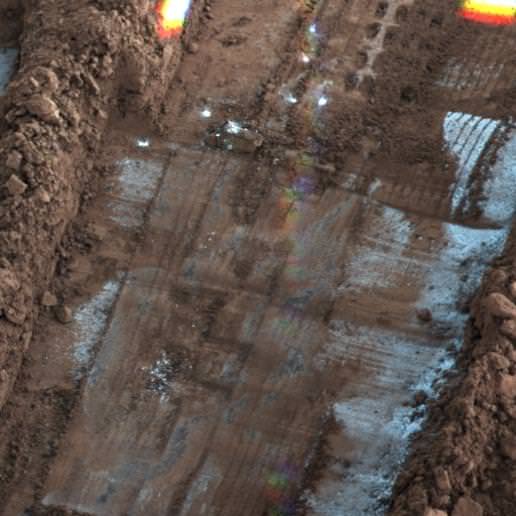
The Phoenix lander dug this trench in the Mars artic region. Image NASA/JPL-Caltech/University of Arizona/Texas A&M University

[/caption]
Scientists from the Phoenix Mars Lander mission say the lander uncovered clues that the Martian arctic soil has been warmer and wetter in the past, and right now Mars may just be in a dry cycle. The biggest clue is the “clumpiness” of the soil in the Mars arctic region that Phoenix encountered, making it difficult for the lander to dump samples into the “ovens” that analyzed the chemistry of the soil. While currently the soil is cold and dry, when long-term climate cycles make the site warmer, the soil may get moist enough to modify the chemistry, producing effects that persist through the colder times. “We have snowfall from the clouds and frost at the surface, with ice just a few inches below, and dry soil in between,” said Phoenix Principal Investigator Peter Smith of the University of Arizona , Tucson . “During a warmer climate several million years ago, the ice would have been deeper, but frost on the surface could have melted and wet the soil.”

With no large moon like Earth’s to stabilize it, Mars goes through known periodic cycles when its tilt becomes much greater than Earth’s. During those high-tilt periods, the sun rises higher in the sky above the Martian poles than it does now, and the arctic plain where Phoenix worked experiences warmer summers.

“The ice under the soil around Phoenix is not a sealed-off deposit left from some ancient ocean,” said Ray Arvidson of Washington University in St. Louis , lead scientist for the lander’s robotic arm. “It is in equilibrium with the environment, and the environment changes with the obliquity cycles on scales from hundreds of thousands of years to a few million years. There have probably been dozens of times in the past 10 million years when thin films of water were active in the soil, and probably there will be dozens more times in the next 10 million years.”

Cloddy texture of soil scooped up by Phoenix is one clue to effects of water. The mission’s microscopic examination of the soil shows individual particles characteristic of windblown dust and sand, but clods of the soil hold together more cohesively than expected for unaltered dust and sand. Arvidson said, “It’s not strongly cemented. It would break up in your hand, but the cloddiness tells us that something is taking the windblown material and mildly cementing it.”

That cementing effect could result from water molecules adhering to the surfaces of soil particles. Or it could be from water mobilizing and redepositing salts that Phoenix identified in the soil, such as magnesium perchlorate and calcium carbonate.

The Thermal and Electrical Conductivity Probe on Phoenix detected electrical-property changes consistent with accumulation of water molecules on surfaces of soil grains during daily cycles of water vapor moving through the soil, reported Aaron Zent of NASA Ames Research Center, Moffett Field, Calif., lead scientist for that probe.

“There’s exchange between the atmosphere and the subsurface ice,” Zent said. “A film of water molecules accumulates on the surfaces of mineral particles. It’s not enough right now to transform the chemistry, but the measurements are providing verification that these molecular films are occurring when you would expect them to, and this gives us more confidence in predicting the way they would behave in other parts of the obliquity cycles.”

Phoenix worked on Mars this year from May 25 until November 2.The Phoenix science team will be analyzing data and running comparison experiments for months to come. Today, they reported on some of their progress at a meeting of the American Geophysical Union in San Francisco.

Source: NASA

Groundwater May Have Played Important Role in Shaping Mars

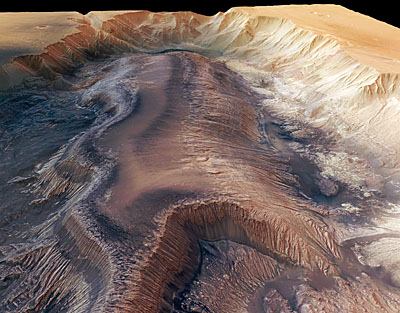
Herbes Chasma and LTDs. Credit: ESA

[/caption]

Scientists have been intrigued and puzzled by light-toned layered deposits on Mars since the Mariner spacecraft flybys in the early 1970s. Known as LTDs (Light Toned Deposits), they are Martian sediments that most closely resemble sediments on Earth and are some of the most mysterious features on Mars. Causes for their origin remain unknown, and different mechanisms, including volcanic processes, have been proposed for their formation. But recently data and images from Mars Express suggest that several LTDs were formed when large amounts of groundwater burst on to the surface. Scientists propose that groundwater had a greater role in shaping the Martian surface than previously believed, and may have sheltered primitive life forms as the planet started drying up.

LTDs were some of the first features seen on Mars, because they showed up even in the black and white images sent back by the first spacecraft to flyby Mars. But they are also some of the least understood features on the Red Planet, and have been highly debated. These deposits occur on a large scale in Arabia Terra, Chaotic Terrain and Valles Marineris, close to the Tharsis volcanic bulge.
Crommelin Crater LTDs. Credit: ESA
Now, based on Mars Express data, scientists propose that these sediments are actually younger than originally believed. Angelo Rossi and several colleagues report their findings in a paper published in September of this year in Geophysical Research. They have proposed that several LTDs may have been deposited by large-scale springs of groundwater that burst on to the surface, possibly at different times.

Analysis also indicates that ground water had a more wide-ranging and important role in Martian history than previously believed. Hydrated minerals, relatively young in age, have been found in the region.

Given that the deposits are relatively young in age, and associated with water, they may also have sheltered microbial life from the drier and harsher climate in more recent times on Mars, possibly eliminating the need for a stable atmosphere or a permanent water body.

Complimentary studies by the Mars Reconnaissance Orbiter also have indicated LTDs were formed by water.

Source: ESA

Where In the Universe #33

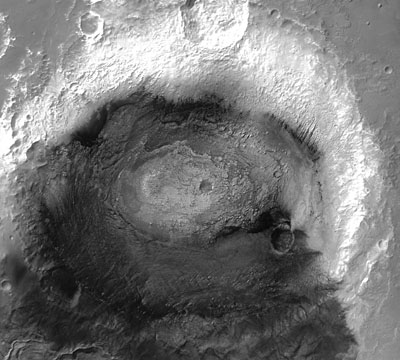
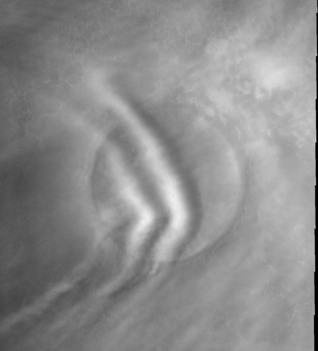
Here’s your image for this week’s “Where In The Universe” challenge. Take a look and see if you can name where in the Universe this image is from, and also guess what exactly this image is — there are a few different features here — just what are they? Give yourself extra points if you can name the spacecraft responsible for the image. The image will be posted today, but we won’t reveal the answer until tomorrow. Post your guess in the comment section, and then check back tomorrow and see how you did. Good luck!

UPDATE (12/12): The answer has now been posted below. If you haven’t made your guess yet, no peeking before you do!!

This is an image of springtime clouds over a crater on Mars, taken by the Mars Odyssey Themis (Thermal Emission Imaging System). Here’s the link to the THEMIS page for more information.

Thanks for being more discreet in adding your guesses in the comment section (no one put any links this time!) The readers don’t have to name their sources! Thanks for playing, and I hope you’ll play again next week!

HiRISE Wows Again, This Time in 3-D

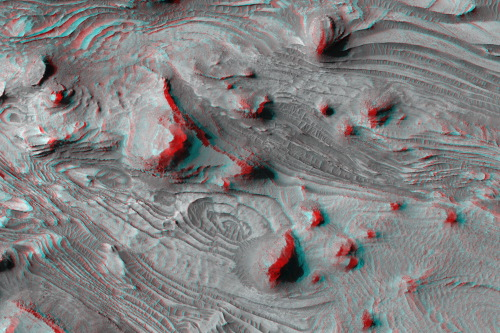
Arabia Terra in 3-D. Credit: NASA/JPL/UA

[/caption]
Grab your 3-D glasses and prepare to be amazed (and addicted!) The team from the remarkable HiRISE Camera on board the Mars Reconnaissance Orbiter has released a collection of 3-D images — 362 of ’em — of Mars surface. The incredible power of this camera can resolve features as small as one meter, or 40 inches, across, and in looking at these 3-D images, it’s almost like being there. Above is one of my favorites from this collection, Arabia Terra. “It’s really remarkable to see Martian rocks and features on the scale of a person in 3-D,” said Alfred McEwen of UA’s Lunar and Planetary Laboratory, HiRISE principal investigator. “The level of detail is just much, much greater than anything previously seen from orbit.”

How was the team able to create so many 3-D images? And how can you get or make a pair of 3-D glasses?

Usually, creating 3-D anaglyphs is a tedious and time-consuming process. But the HiRISE team was able to automate some of the software used in processing the images so two images of a stereo pair could be fed into the software “pipeline” and correlated automatically. So look for even more 3-D images in the future. But 362 should keep most of us busy, for awhile anyway!
Candor Chasma.  Credit: NASA/JPL/UA
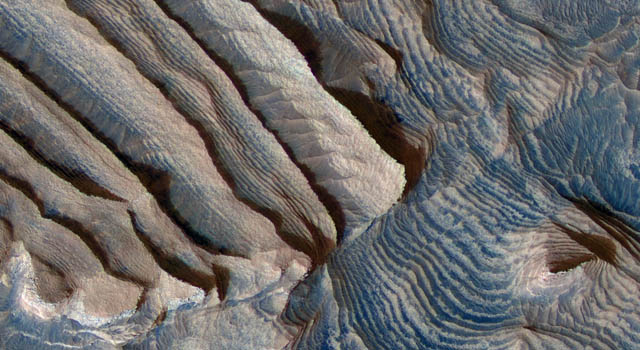
Here, spectacular layers are exposed on the floor of a large canyon in the Valles Marineris system called Candor Chasma which is about 2-and-a-half miles, or 4 kilometers deep. The canyon may once have been filled to its rim by sedimentary layers of sand and dust-sized particles, but these have since eroded, leaving patterns of elongated hills and layered terrain that has been turned and folded in many angles and directions.

If you don’t have a pair of 3-D glasses, here’s a link to a list of several sources of finding some, or you can even make your own. Sometimes, 3-D glasses can be found for free on cereal boxes, or in children’s books or other sources.

Find out how 3-D images are made, and learn how to make your own 3-D images here.

Becquerel Crater. Credit: NASA/JPL/UA

Here is a 3-D version of Becquerel Crater, and the layered terrain of which we wrote about last week, which was formed by cyclical climate change.

See the entire collection of HiRISE 3-D’s here.

Source: U of Arizona

“Leap Second” to be Added to World Clocks

The US Naval Observatory operates 70 cesium atomic clocks. Credit: USNO

If you ever feel like you need more time, here’s some great news: you’re actually going to get it. On December 31, 2008 a “leap second” will be added to the world’s clocks at 23 hours, 59 minutes and 59 seconds Coordinated Universal Time (UTC). This corresponds to 6:59:59 pm Eastern Standard Time, when the extra second will be inserted at the U.S. Naval Observatory’s Master Clock Facility in Washington, DC. This is the 24th leap second added to UTC, a uniform time-scale kept by atomic clocks around the world, since 1972. Coincidentally, Fraser and Pamela’s most recent episode of Astronomy Cast is about time, so if you want to know more about time and the atomic clocks used to provide precise timekeeping, check it out.

Historically, time was based on the mean rotation of the earth relative to celestial bodies and the second was defined in this reference frame. However, the invention of atomic clocks defined a much more precise “atomic time” scale and a second that is independent of the earth’s rotation. In 1970, an international agreement established two timescales: one based on the rotation of the earth and one based on atomic time.

Atomic clocks do not use radioactivity, but they use the exact frequency of the microwave spectral line emitted by atoms of the element cesium, in particular its isotope of atomic weight 133 (“Cs-133”). The integral of frequency is time, so this frequency, 9,192,631,770 hertz (Hz = cycles/second), and this provides the fundamental unit of time, which are measured by cesium clocks.

The problem is that the earth’s rotation is very gradually slowing down, which necessitates the periodic insertion of a “leap second” into the atomic timescale to keep the two within 1 second of each other. The International Earth Rotation and Reference Systems Service (IERS) is the organization which monitors the difference in the two timescales and calls for leap seconds to be inserted or removed when necessary.

Since 1972, leap seconds have been added at intervals varying from six months to seven years, with the last being inserted on December 31, 2005. The U.S. Naval Observatory is charged with the responsibility for the precise determination and dissemination of time for the Department of Defense and maintains its Master Clock. The U.S. Naval Observatory, together with the National Institute of Standards and Technology (NIST), determines time for the United States.

Source: US Naval Observatory

“Stairways” on Mars Lead to Clues on Cyclical, Moderate Climate

Rhythmic bedding in sedimentary bedrock within Becquerel crater on Mars is suggested by the patterns in this image from NASA's Mars Reconnaissance Orbiter. Image credit: Image credit: NASA/JPL-Caltech/University of Arizona

[/caption]
We see evidence on Mars’ surface of a violent past: massive volcanic eruptions, catastrophic floods, and a surface scarred with craters. But new images of rock formations on Mars resembling stairs suggest Mars at one time had a regular pattern of predictable and even moderate climate cycles persisting for millions of years. Three-dimensional images from the HiRISE camera on the Mars Reconnaissance Orbiter show patterns in thick stacks of sedimentary rock layers, formed by a cyclical climate that is likely tied to the wobble of Mars on its axis.

Combining several images of the rock formations from different perspectives, scientists were able to produce three dimensional images, as well as a dramatic flyby movie of the layered sediments. Based on a pattern of layers within layers found at an area called Becquerel crater, the scientists propose that each layer was formed over a period of about 100,000 years and that these layers were produced by cyclical climate changes. The outcrops have been eroded into mounds on the floors of the craters, with many of the layered deposits showing a stair-stepped shape. Each layer has exactly the same thickness.

Sequences of cyclic sedimentary rock layers exposed in an unnamed crater in Arabia Terra, Mars. (Credit, both images: Topography, Caltech; HiRISE Images, NASA/JPL/University of Arizona)

Every 10 of the “staircase” layers are bundled into a larger unit, which the team, led by Kevin Lewis of the California Institute of Technology, calculates was laid down over a million-year period, and Becquerel contains 10 of these bundles. One million years is the same duration as the periodic variations in Mars’ tilt, suggesting that climate variations induced by the tilt produced the layering. Each bundle, then, represents climate processes as the planet tilted. This tilt periodically cooled the equatorial region and warmed the poles as they received more sunlight.

“Due to the scale of the layers, small variations in Mars’s orbit are the best candidate for the implied climate changes,” said Kevin Lewis of the California Institute of Technology, who led the study. “These are the very same changes that have been shown to set the pacing of ice ages on the Earth and can also lead to cyclic layering of sediments.”

This image shows sedimentary-rock layering in which a series of layers are all approximately the same thickness. Image credit: NASA/JPL-Caltech/University of Arizona

The tilt of Earth on its axis varies between 22.1 and 24.5 degrees over a 41,000-year period. The tilt itself is responsible for seasonal variation in climate, because the portion of the Earth that is tipped toward the sun–and that receives more sunlight hours during a day–gradually changes throughout the year. During phases of lower obliquity, polar regions are less subject to seasonal variations, leading to periods of glaciation.

Mars’s tilt varies by tens of degrees over a 100,000-year cycle, producing even more dramatic variation. When the obliquity is low, the poles are the coldest places on the planet, while the sun is located near the equator all the time. This could cause volatiles in the atmosphere, like water and carbon dioxide, to migrate poleward, where they’d be locked up as ice.

“It’s easy to be fooled without knowing the topography and measuring the layers in three dimensions,” said Alfred McEwen of the University of Arizona, Tucson, principal investigator for the camera and a co-author of the paper. “With the stereo information, it is clear there’s a repeating pattern to these layers.”

Sources: JPL, Caltech

Future Missions to Mars Will be Joint NASA/ESA Efforts

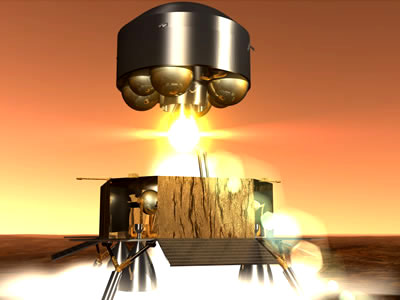
Artist's view of ESA's Mars Sample Return (MSR) ascent module lifting off from Mars' surface with the Martian soil samples. Credits: ESA

[/caption]
Future missions to Mars, including a sample return mission will be joint endeavors between NASA and the European Space Agency (ESA). NASA’s associate administrator for space science Ed Weiler revealed in Thursday’s Mars Science Laboratory press conference that the two space agencies agreed this week, based on initial discussions last July, to work together on future Mars missions. “This delay (of MSL) also means an opportunity of in the future having one Mars program for all the Earth,” said Weiler.

“We have now gotten approval that in the future, NASA and ESA are going to work together to come up with a European-U.S. Mars architecture,” Weiler said. “That is, missions won’t be NASA missions, they won’t be ESA missions, they will be joint missions. We need to work together. We’ll never, ever do a sample return mission unless we work together. We both have the same goals scientifically, we want to get our science communities together and start laying out a plan. We’ve committed to working together to reaching those goals.”

A robotic mission to collect soil and rock samples and return them to Earth for analysis would likely cost between $6 billion and $8 billion and not be feasible until the 2020s.

While many of the current missions are international efforts, with scientists from several countries contributing instruments and working together on research, this agreement would seemingly mean the two space agencies would share costs equally and encourage even more scientific collaboration. This is a logical next step for not only Mars exploration, but all future exploration of space.

For years, an international group of scientists, called the International Mars Exploration Working Group has been working together to form long term science goals and long range strategy for Mars exploration.

NASA has listed a sample return mission as “future goal” for years, and ESA has a Mars sample return mission planned as part of its Aurora exploration program, with such a mission slated for the 2020-2022 time frame.