New Cosmological Theory Goes Inflation-Free

This image, the best map ever of the Universe, shows the oldest light in the universe. This glow, left over from the beginning of the cosmos called the cosmic microwave background, shows tiny changes in temperature represented by color. Credit: ESA and the Planck Collaboration.

The Cosmic Microwave Background (CMB) radiation is one of the greatest discoveries of modern cosmology. Astrophysicist George Smoot once likened its existence to “seeing the face of God.” In recent years, however, scientists have begun to question some of the attributes of the CMB. Peculiar patterns have emerged in the images taken by satellites such as WMAP and Planck – and they aren’t going away. Now, in a paper published in the December 1 issue of The Astronomical Journal, one scientist argues that the existence of these patterns may not only imply new physics, but also a revolution in our understanding of the entire Universe.

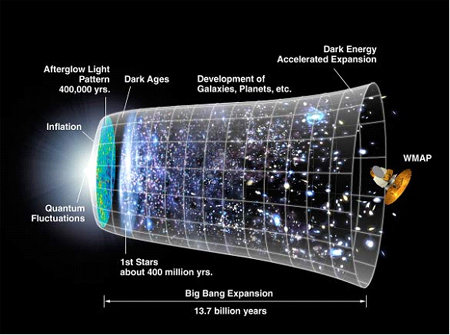
Let’s recap. Thanks to a blistering ambient temperature, the early Universe was blanketed in a haze for its first 380,000 years of life. During this time, photons relentlessly bombarded the protons and electrons created in the Big Bang, preventing them from combining to form stable atoms. All of this scattering also caused the photons’ energy to manifest as a diffuse glow. The CMB that cosmologists see today is the relic of this glow, now stretched to longer, microwave wavelengths due to the expansion of the Universe.

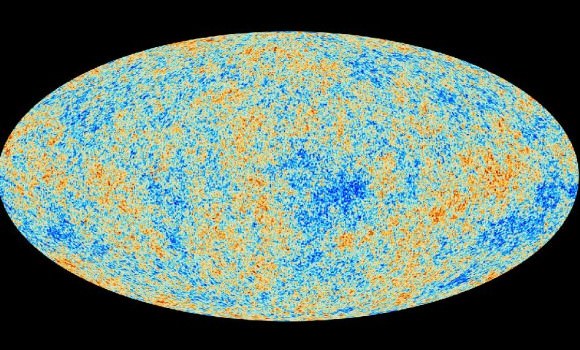
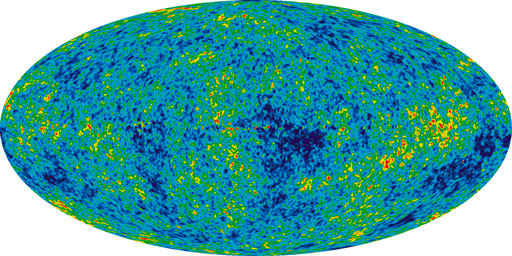
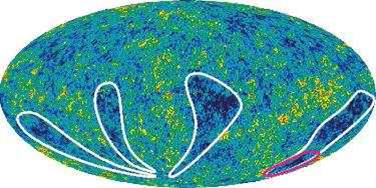
As any fan of the WMAP and Planck images will tell you, the hallmarks of the CMB are the so-called anisotropies, small regions of overdensity and underdensity that give the picture its characteristic mottled appearance. These hot and cold spots are thought to be the result of tiny quantum fluctuations born at the beginning of the Universe and magnified exponentially during inflation.

Temperature and polarization around hot and cold spots (Credit: NASA / WMAP Science Team)

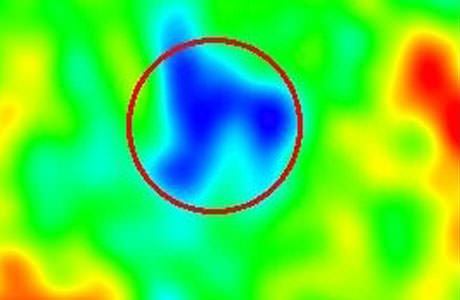
Given the type of inflation that cosmologists believe occurred in the very early Universe, the distribution of these anisotropies in the CMB should be random, on the order of a Gaussian field. But both WMAP and Planck have confirmed the existence of certain oddities in the fog: a large “cold spot,” strange alignments in polarity known as quadrupoles and octupoles, and, of course, Stephen Hawking’s initials.

In his new paper, Fulvio Melia of the University of Arizona argues that these types of patterns (Dr. Hawking’s signature notwithstanding) reveal a problem with the standard inflationary picture, or so-called ΛCDM cosmology. According to his calculations, inflation should have left a much more random assortment of anisotropies than the one that scientists see in the WMAP and Planck data. In fact, the probability of these particular anomalies lining up the way they do in the CMB images is only about 0.005% for a ΛCDM Universe.

Melia posits that the anomalous patterns in the CMB can be better explained by a new type of cosmology in which no inflation occurred. He calls this model the R(h)=ct Universe, where c is the speed of light, t is the age of the cosmos, and R(h) is the Hubble radius – the distance beyond which light will never reach Earth. (This equation makes intuitive sense: Light, traveling at light speed (c) for 13.7 billion years (t), should travel an equivalent number of light-years. In fact, current estimates of the Hubble radius put its value at about 13.4 billion light-years, which is remarkably close to the more tightly constrained value of the Universe’s age.)

R(h)=ct holds true for both the standard cosmological scenario and Melia’s model, with one crucial difference: in ΛCDM cosmology, this equation only works for the current age of the Universe. That is, at any time in the distant past or future, the Universe would have obeyed a different law. Scientists explain this odd coincidence by positing that the Universe first underwent inflation, then decelerated, and finally accelerated again to its present rate.

Melia hopes that his model, a Universe that requires no inflation, will provide an alternative explanation that does not rely on such fine-tuning. He calculates that, in a R(h)=ct Universe, the probability of seeing the types of strange patterns that have been observed in the CMB by WMAP and Planck is 7–10%, compared with a figure 1000 times lower for the standard model.

So, could this new way of looking at the cosmos be a death knell for ΛCDM? Probably not. Melia himself cites a few less earth-shattering explanations for the anomalous signals in the CMB, including foreground noise, statistical biases, and instrumental errors. Incidentally, the Planck satellite is scheduled to release its latest image of the CMB this week at a conference in Italy. If these new results show the same patterns of polarity that previous observations did, cosmologists will have to look into each possible explanation, including Melia’s theory, more intensively.

When Did the First Stars Form?

When Did the First Stars Form?

Shortly after the Big Bang, the Universe had cooled to the point that the first stars could form out of the primordial hydrogen. How long did it take, and what did these first stars like?

Hydrogen soup. Doesn’t that sound delicious? Perhaps not for humans, but certainly for the first stars!

Early in the Universe, in a spectacular show of stellar soupification, clouds of hydrogen atoms gathered together. They combined with one another. The collected mass got bigger and bigger, and after a time, ignition. The first stars were alive!

Well, alive in the sense that they were burning – not that they had feelings or knew what was going on, or had opinions, or were beginning to write would what would eventually become the first Onion article or anything.

But where did all that gas come from, and can we spot the evidence of those long-ago stars today? As you know, the Big Bang got our Universe off to a speedy start of expansion. It then took 400,000 years for us to see any light at all. Protons and electrons and other small particles were floating around, but it was far too hot for them to interact.

Once the power of the Big Bang finally faded, those protons and electrons paired up and created hydrogen. This is called, rather uninventively, “recombination”. I’d rather just call it hydrogen soup. We’ve got energy. But what is the secret ingredient that sparked these stars? It was just that soup clumping together over time.

A map of the faint microwave radiation left over after the big bang shows superclusters (red circles) and supervoids (blue circles). Credit: B. Granett, M. Neyrinck, I. Szapudi

We can’t say to the minute when the first stars formed, but we have a pretty good idea. The Wilkinson Microwave Anisotropy Probe, aka WMAP examined what happened when these clouds of hydrogen molecules got together, creating tiny temperature differences of only a millionth of a degree.

Over time, gravity began to yank matter from spots of lower density into the higher-density regions, making the clumps even bigger. Fantastically bigger. So big that about 200 million years after the clumps were formed, it was possible for these hydrogen molecules to ram into each other at very high speeds.

This process is called nuclear fusion. On Earth, it’s a way to produce energy. Same goes for a star. With enough nuclear reactions happening, the cloud of gas compresses and creates a glow. And these stars weren’t tiny – they were monsters! NASA says the first stars were 30 to 300 times as massive as the sun, shining millions of times brighter.

The supernova that produced the Crab Nebula was detected by naked-eye observers around the world in 1054 A.D. This composite image uses data from NASA’s Great Observatories, Chandra, Hubble, and Spitzer, to show that a superdense neutron star is energizing the expanding Nebula by spewing out magnetic fields and a blizzard of extremely high-energy particles. The Chandra X-ray image is shown in light blue, the Hubble Space Telescope optical images are in green and dark blue, and the Spitzer Space Telescope’s infrared image is in red. The size of the X-ray image is smaller than the others because ultrahigh-energy X-ray emitting electrons radiate away their energy more quickly than the lower-energy electrons emitting optical and infrared light. The neutron star is the bright white dot in the center of the image.
The supernova that produced the Crab Nebula was detected by naked-eye observers around the world in 1054 A.D. This composite image uses data from NASA’s Great Observatories, Chandra, Hubble, and Spitzer.

But this flashy behavior came at a price, because in only a few million years, the stars grew unstable and exploded into supernovae. These stars weren’t only exploding. They were also altering the soup around them. They were big emitters of ultraviolet light. It’s a very energetic wavelength, best known for causing skin cancer.

So, this UV light struck the hydrogen surrounding the stars. This split the atoms apart into electrons and protons again, leaving quite the mess in space. But it’s through this process that we can learn more about these earliest stars.The stars are long gone, but like a criminal fleeing the scene, they left a pile of evidence behind for their existence. Splitting these atoms was their evidence. This re-ionization is one key piece of understanding how these stars came to be.

So it was an action-packed time for the universe, with the Big Bang, then the emergence of soup and then the first stars. It’s quite an exciting start for our galactic history.

What do you think the first stars looked like?

And if you like what you see, come check out our Patreon page and find out how you can get these videos early while helping us bring you more great content!

How Old is the Universe?

How Old is the Universe?

The Universe is vast bubble of space and time, expanding in volume. Run the clock backward and you get to a point where everything was compacted into a microscopic singularity of incomprehensible density. In a fraction of a second, it began expanding in volume, and it’s still continuing to do so today.

So how old is the Universe? How long has it been expanding for? How do we know? For a good long while, Astronomers assumed the Earth, and therefore the Universe was timeless. That it had always been here, and always would be.

In the 18th century, geologists started to gather evidence that maybe the Earth hadn’t been around forever. Perhaps it was only millions or billions of years old. Maybe the Sun too, or even… the Universe. Maybe there was a time when there was nothing? Then, suddenly, pop… Universe.

It’s the science of thermodynamics that gave us our first insight. Over vast lengths of time, everything moves towards entropy, or maximum disorder. Just like a hot coffee cools down, all temperatures want to average out. And if the Universe was infinite in age, everything should be the same temperature. There should be no stars, planets, or us.

The brilliant Belgian priest and astronomer, George Lemaitre, proposed that the Universe must be either expanding or contracting. At some point, he theorized, the Universe would have been an infinitesimal point – he called it the primeval atom. And it was Edwin Hubble, in 1929 who observed that distant galaxies are moving away from us in all directions, confirming Lemaitre’s theories. Our Universe is clearly expanding.

Which means that if you run the clock backwards, and it was smaller in the distant past. And if you go back far enough, there’s a moment in time when the Universe began. Which means it has an age. The next challenge… figuring out the Universe’s birthdate.

Time line of the Universe (Credit: NASA/WMAP Science Team)

In 1958, the astronomer Allan Sandage used the expansion rate of the Universe, otherwise known as the Hubble Constant, to calculate how long it had probably been expanding. He came up with a figure of approximately 20 billion years. A more accurate estimation for the age of the Universe came with the discovery of the Cosmic Microwave Background Radiation; the afterglow of the Big Bang that we see in every direction we look.

Approximately 380,000 years after the Big Bang, our Universe had cooled to the point that protons and electrons could come together to form hydrogen atoms. At this point, it was a balmy 3000 Kelvin. Using this and by observing the background radiation, and how far the wavelengths of light have been stretched out by the expansion, astronomers were able to calculate how long it has been expanding for.

Initial estimates put the age of the Universe between 13 and 14 billion years old. But recent missions, like NASA’s WMAP mission and the European Planck Observatory have fine tuned that estimate with incredible accuracy. We now know the Universe is 13.8242 billion years, plus or minus a few million years.

We don’t know where it came from, or what caused it to come into being, but we know exactly how our Universe is. That’s a good start.

Astronomy Without A Telescope – One Crowded Nanosecond

Labelled version of the Planck space observatory's all-sky survey. Credit: ESA.

[/caption]

Remember how you could once pick up a book about the first three minutes after the Big Bang and be amazed by the level of detail that observation and theory could provide regarding those early moments of the universe. These days the focus is more on what happened between 1×10-36 and 1×10-32 of the first second as we try to marry theory with more detailed observations of the cosmic microwave background.

About 380,000 years after the Big Bang, the early universe became cool and diffuse enough for light to move unimpeded, which it proceeded to do – carrying with it information about the ‘surface of last scattering’. Before this time photons were being continually absorbed and re-emitted (i.e. scattered) by the hot dense plasma of the earlier universe – and never really got going anywhere as light rays.

But quite suddenly, the universe got a lot less crowded when it cooled enough for electrons to combine with nuclei to form the first atoms. So this first burst of light, as the universe became suddenly transparent to radiation, contained photons emitted in that fairly singular moment – since the circumstances to enable such a universal burst of energy only happened once.

With the expansion of the universe over a further 13.6 and a bit billion years, lots of these photons probably crashed into something long ago, but enough are still left over to fill the sky with a signature energy burst that might have once been powerful gamma rays but has now been stretched right out into microwave. Nonetheless, it still contains that same ‘surface of last scattering’ information.

Observations tell us that, at a certain level, the cosmic microwave background is remarkably isotropic. This led to the cosmic inflation theory, where we think there was a very early exponential expansion of the microscopic universe at around 1×10-36 of the first second – which explains why everything appears so evenly spread out.

However, a close look at the cosmic microwave background (CMB) does show a tiny bit of lumpiness – or anisotropy – as demonstrated in data collected by the aptly-named Wilkinson Microwave Anisotropy Probe (WMAP).

Really, the most remarkable thing about the CMB is its large scale isotropy and finding some fine grain anisotropies is perhaps not that surprising. However, it is data and it gives theorists something from which to build mathematical models about the contents of the early universe.

The apparent quadrupole moment anomalies in the cosmic microwave background might result from irregularities in the early universe - including density fluctuations, dynamic movement (vorticity) or even gravity waves. However, a degree of uncertainty and 'noise' from foreground light sources is apparent in the data, making firm conclusions difficult to draw. Credit: University of Chicago.

Some theorists speak of CMB quadrupole moment anomalies. The quadrupole idea is essentially an expression of energy density distribution within a spherical volume – which might scatter light up-down or back-forward (or variations from those four ‘polar’ directions). A degree of variable deflection from the surface of last scattering then hints at anisotropies in the spherical volume that represents the early universe.

For example, say it was filled with mini black holes (MBHs)? Scardigli et al (see below) mathematically investigated three scenarios, where just prior to cosmic inflation at 1×10-36 seconds: 1) the tiny primeval universe was filled with a collection of MBHs; 2) the same MBHs immediately evaporated, creating multiple point sources of Hawking radiation; or 3) there were no MBHs, in accordance with conventional theory.

When they ran the math, scenario 1 best fits with WMAP observations of anomalous quadrupole anisotropies. So, hey – why not? A tiny proto-universe filled with mini black holes. It’s another option to test when some higher resolution CMB data comes in from Planck or other future missions to come. And in the meantime, it’s material for an astronomy writer desperate for a story.

Further reading: Scardigli, F., Gruber,C. and Chen (2010) Black hole remnants in the early universe.

Cosmological Constant

Seven Year Microwave Sky (Credit: NASA/WMAP Science Team)

[/caption]
The cosmological constant, symbol Λ (Greek capital lambda), was ‘invented’ by Einstein, not long after he published his theory of general relativity (GR). It appears on the left-hand side of the Einstein field equations.

Einstein added this term because he – along with all other astronomers and physicists of the time – thought the universe was static (the cosmological constant can make a universe filled with mass-energy static, neither expanding nor contracting). However, he very quickly realized that this wouldn’t work, because such a universe would be unstable … and quickly turn into one either expanding or contracting! Not long afterwards, Hubble (actually Vesto Slipher) discovered that the universe is, in fact, expanding, so the need for a cosmological constant went away.

Until 1998.

In that year, two teams of astronomers independently announced that distant Type Ia supernovae did not have the apparent luminosity they should, in a universe composed almost entirely of mass-energy in the form of baryons (ordinary matter) and cold dark matter.

Dark Energy had been discovered: dark energy is a form of mass-energy that has a constant density throughout the universe, and perhaps throughout time as well; counter-intuitively, it causes the expansion of the universe to accelerate (i.e. it acts kinda like anti-gravity). The most natural form of dark energy is the cosmological constant.

A great deal of research has gone into trying to discover if dark energy is, in fact, just the cosmological constant, or if it is quintessence, or something else. So far, results from observations of the CMB (by WMAP, mainly), of BAO (baryon acoustic oscillations, by extensive surveys of galaxies), and of high-redshift supernovae (by many teams) are consistent with dark energy being the cosmological constant.

So if the cosmological constant is (a) mass-energy (density), it can be expressed as kilograms (per cubic meter), can’t it? Yes, and the best estimate today is 7.3 x 10⁻²⁷ kg m 3.

Ned Wright’s Cosmology Tutorial (UCLA) and Sean Carroll’s Cosmology Primer (California Institute of Technology) between them cover not only the cosmological constant, but also cosmology! NASA’s What Is A Cosmological Constant? is a great one-page intro.

Universe Today has many, many stories featuring the cosmological constant! Here are a few to whet your appetite: Universe to WMAP: LCDM Rules, OK?, Einstein’s Cosmological Constant Predicts Dark Energy, and No “Big Rip” in our Future: Chandra Provides Insights Into Dark Energy.

There are many Astronomy Cast episodes which include discussion of the cosmological constant … these are among the best: The Big Bang and Cosmic Microwave Background, The Important Numbers in the Universe, and the March 18th, 2009 Questions Show.

Sources:
http://map.gsfc.nasa.gov/universe/uni_accel.html
http://super.colorado.edu/~michaele/Lambda/lambda.html
http://en.wikipedia.org/wiki/Cosmological_constant

Seven-Year WMAP Results: No, They’re NOT Anomalies

CMB cool fingers, cold spots I and II (red; credit: NASA/WMAP science team)

Since the day the first Wilkinson Microwave Anisotropy Probe (WMAP) data were released, in 2003, all manner of cosmic microwave background (CMB) anomalies have been reported; there’s been the cold spot that might be a window into a parallel universe, the “Axis of Evil”, pawprints of local interstellar neutral hydrogen, and much, much more.

But do the WMAP data really, truly, absolutely contain evidence of anomalies, things that just do not fit within the six-parameters-and-a-model the WMAP team recently reported?

In a word, no.

Seven Year Microwave Sky (Credit: NASA/WMAP Science Team)

Every second year since 2003 the WMAP science team has published a set of papers on their analyses of the cumulative data, and their findings (with the mission due to end later this year, their next set will, sadly, be their last). With time and experience – not to mention inputs from the thousands of other researchers who have picked over the data – the team has not only amassed a lot more data, but has also come to understand how WMAP operates far better. As a consequence, not only are the published results – such as limits on the nature of dark energy, and the number of different kinds of neutrinos – more stringent and robust, but the team has also become very au fait with the various anomalies reported.

For the first time, the team has examined these anomalies, in detail, and has concluded that the answer to the question, in their words, “are there potential deviations from ?CDM within the context of the allowed parameter ranges of the existing WMAP observations?” is “no”.

The reported anomalies the team examined are many – two prominent cold spots, strength of the quadrupole, lack of large angular scale CMB power, alignment of the quadrupole and octupole components, hemispherical or dipole power asymmetry, to name but a handful – but the reasons for the apparent anomalies are few.

“Human eyes and brains are excellent at detecting visual patterns, but poor at assessing probabilities. Features seen in the WMAP maps, such as the large Cold Spot I near the Galactic center region, can stand out as unusual. However, the likelihood of such features can not be discerned by visual inspection of our particular realization of the universe,” they write, and “Monte Carlo simulations are an invaluable way to determine the expected deviations within the ?CDM model. Claims of anomalies without Monte Carlo simulations are necessarily weak claims”.

Stephen Hawking’s initials in the CMB (Credit: NASA/WMAP Science Team)

An amusing example: Stephen Hawking’s initials (“SH”) can be clearly seen in the WMAP sky map. “The “S” and “H” are in roughly the same font size and style, and both letters are aligned neatly along a line of fixed Galactic latitude,” the team says; “A calculation would show that the probability of this particular occurrence is vanishingly small. Yet, there is no case to made for a non-standard cosmology despite this extraordinarily low probability event,” they dryly note.

Many of the reports of WMAP CMB anomalies would likely make for good teaching material, as they illustrate well the many traps that you can so easily fall into when doing after-the-fact (a posteriori) statistical analyses. Or, as the team puts it in regard to the Stephen Hawking initials: “It is clear that the combined selection of looking for initials, these particular initials, and their alignment and location are all a posteriori choices. For a rich data set, as is the case with WMAP, there are a lot of data and a lot of ways of analyzing the data.”

And what happens when you have a lot of data? Low probability events are guaranteed to occur! “For example, it is not unexpected to find a 2? feature when analyzing a rich data set in a number of different ways. However, to assess whether a particular 2? feature is interesting, one is often tempted to narrow in on it to isolate its behavior. That process involves a posteriori choices that amplify the apparent significance of the feature.”

So, does the team conclude that all this anomaly hunting is a waste of effort? Absolutely not! I’ll quote from the team’s own conclusion: “The search for oddities in the data is essential for testing the model. The success of the model makes these searches even more important. A detection of any highly significant a posteriori feature could become a serious challenge for the model. The less significant features discussed in this paper provided the motivation for considering alternative models and developing new analysis of WMAP (and soon Planck) data. The oddities have triggered proposed new observations that can further test the models. It is often difficult to assess the statistical claims. It may well be that an oddity could be found that motivates a new theory, which then could be tested as a hypothesis against ?CDM. The data support these comparisons. Of course, other cosmological measurements must also play a role in testing new hypotheses. No CMB anomaly reported to date has caused the scientific community to adopt a new standard model of cosmology, but claimed anomalies have been used to provoke thought and to search for improved theories.”

Primary source: Seven-Year Wilkinson Microwave Anisotropy Probe (WMAP) Observations: Are There Cosmic Microwave Background Anomalies? (arXiv:1001.4758). The five other Seven-Year WMAP papers are: Seven-Year Wilkinson Microwave Anisotropy Probe (WMAP) Observations: Cosmological Interpretation (arXiv:1001.4538), Seven-Year Wilkinson Microwave Anisotropy Probe (WMAP) Observations: Planets and Celestial Calibration Sources (arXiv:1001.4731), Seven-Year Wilkinson Microwave Anisotropy Probe (WMAP) Observations: Sky Maps, Systematic Errors, and Basic Results (arXiv:1001.4744), Seven-Year Wilkinson Microwave Anisotropy Probe (WMAP) Observations: Power Spectra and WMAP-Derived Parameters (arXiv:1001.4635), and Seven-Year Wilkinson Microwave Anisotropy Probe (WMAP) Observations: Galactic Foreground Emission (arXiv:1001.4555). Also check out the official WMAP website.

Universe to WMAP: ΛCDM Rules, OK?

Temperature and polarization around hot and cold spots (Credit: NASA / WMAP Science Team)

[/caption]
The Wilkinson Microwave Anisotropy Probe (WMAP) science team has finished analyzing seven full years’ of data from the little probe that could, and once again it seems we can sum up the universe in six parameters and a model.

Using the seven-year WMAP data, together with recent results on the large-scale distribution of galaxies, and an updated estimate of the Hubble constant, the present-day age of the universe is 13.75 (plus-or-minus 0.11) billion years, dark energy comprises 72.8% (+/- 1.5%) of the universe’s mass-energy, baryons 4.56% (+/- 0.16%), non-baryonic matter (CDM) 22.7% (+/- 1.4%), and the redshift of reionization is 10.4 (+/- 1.2).

In addition, the team report several new cosmological constraints – primordial abundance of helium (this rules out various alternative, ‘cold big bang’ models), and an estimate of a parameter which describes a feature of density fluctuations in the very early universe sufficiently precisely to rule out a whole class of inflation models (the Harrison-Zel’dovich-Peebles spectrum), to take just two – as well as tighter limits on many others (number of neutrino species, mass of the neutrino, parity violations, axion dark matter, …).

The best eye-candy from the team’s six papers are the stacked temperature and polarization maps for hot and cold spots; if these spots are due to sound waves in matter frozen in when radiation (photons) and baryons parted company – the cosmic microwave background (CMB) encodes all the details of this separation – then there should be nicely circular rings, of rather exact sizes, around the spots. Further, the polarization directions should switch from radial to tangential, from the center out (for cold spots; vice versa for hot spots).

And that’s just what the team found!

Concerning Dark Energy. Since the Five-Year WMAP results were published, several independent studies with direct relevance to cosmology have been published. The WMAP team took those from observations of the baryon acoustic oscillations (BAO) in the distribution of galaxies; of Cepheids, supernovae, and a water maser in local galaxies; of time-delay in a lensed quasar system; and of high redshift supernovae, and combined them to reduce the nooks and crannies in parameter space in which non-cosmological constant varieties of dark energy could be hiding. At least some alternative kinds of dark energy may still be possible, but for now Λ, the cosmological constant, rules.

Concerning Inflation. Very, very, very early in the life of the universe – so the theory of cosmic inflation goes – there was a period of dramatic expansion, and the tiny quantum fluctuations before inflation became the giant cosmic structures we see today. “Inflation predicts that the statistical distribution of primordial fluctuations is nearly a Gaussian distribution with random phases. Measuring deviations from a Gaussian distribution,” the team reports, “is a powerful test of inflation, as how precisely the distribution is (non-) Gaussian depends on the detailed physics of inflation.” While the limits on non-Gaussianity (as it is called), from analysis of the WMAP data, only weakly constrain various models of inflation, they do leave almost nowhere for cosmological models without inflation to hide.

Concerning ‘cosmic shadows’ (the Sunyaev-Zel’dovich (SZ) effect). While many researchers have looked for cosmic shadows in WMAP data before – perhaps the best known to the general public is the 2006 Lieu, Mittaz, and Zhang paper (the SZ effect: hot electrons in the plasma which pervades rich clusters of galaxies interact with CMB photons, via inverse Compton scattering) – the WMAP team’s recent analysis is their first to investigate this effect. They detect the SZ effect directly in the nearest rich cluster (Coma; Virgo is behind the Milky Way foreground), and also statistically by correlation with the location of some 700 relatively nearby rich clusters. While the WMAP team’s finding is consistent with data from x-ray observations, it is inconsistent with theoretical models. Back to the drawing board for astrophysicists studying galaxy clusters.

Seven Year Microwave Sky (Credit: NASA/WMAP Science Team)

I’ll wrap up by quoting Komatsu et al. “The standard ΛCDM cosmological model continues to be an exquisite fit to the existing data.”

Primary source: Seven-Year Wilkinson Microwave Anisotropy Probe (WMAP) Observations: Cosmological Interpretation (arXiv:1001.4738). The five other Seven-Year WMAP papers are: Seven-Year Wilkinson Microwave Anisotropy Probe (WMAP) Observations: Are There Cosmic Microwave Background Anomalies? (arXiv:1001.4758), Seven-Year Wilkinson Microwave Anisotropy Probe (WMAP) Observations: Planets and Celestial Calibration Sources (arXiv:1001.4731), Seven-Year Wilkinson Microwave Anisotropy Probe (WMAP) Observations: Sky Maps, Systematic Errors, and Basic Results (arXiv:1001.4744), Seven-Year Wilkinson Microwave Anisotropy Probe (WMAP) Observations: Power Spectra and WMAP-Derived Parameters (arXiv:1001.4635), and Seven-Year Wilkinson Microwave Anisotropy Probe (WMAP) Observations: Galactic Foreground Emission (arXiv:1001.4555). Also check out the official WMAP website.

What! No Parallel Universe? Cosmic Cold Spot Just Data Artifact

Region in space detected by WMAP cooler than its surroundings. But not really. Rudnick/NRAO/AUI/NSF, NASA.

Rats! Another perplexing space mystery solved by science. New analysis of the famous “cold spot” in the cosmic microwave background reveals, and confirms, actually, that the spot is just an artifact of the statistical methods used to find it. That means there is no supervoid lurking in the CMB, and no parallel universe lying just beyond the edge of our own. What fun is that?

Back in 2004, astronomers studying data from the Wilkinson Microwave Anisotropy Probe (WMAP) found a region of the cosmic microwave background in the southern hemisphere in the direction of the constellation of Eridanus that was significantly colder than the rest by about 70 microkelvin. The probability of finding something like that was extremely low. If the Universe really is homogeneous and isotropic, then all points in space ought to experience the same physical development, and appear the same. This just wasn’t supposed to be there.

Some astronomers suggested the spot could be a supervoid, a remnant of an early phase transition in the universe. Others theorized it was a window into a parallel universe.

Well, it turns out, it wasn’t there.

Ray Zhang and Dragan Huterer at the University of Michigan in Ann Arbor say that the cold spot is simply an artifact of the statistical method–called Spherical Mexican Hat Wavelets–used to analyze the WMAP data. Use a different method of analysis and the cold spot disappears (or at least is no colder than expected).

“We trace this apparent discrepancy to the fact that WMAP cold spot’s temperature profile just happens to favor the particular profile given by the wavelet,” the duo says in their paper. “We find no compelling evidence for the anomalously cold spot in WMAP at scales between 2 and 8 degrees.”

This confirms another paper from 2008 also by Huterer along with colleague Kendrick Smith from the University of Cambridge who showed that the huge void could be considered as a statistical fluke because it had stars both in front of and behind it.

And in fact, one of the earlier papers suggesting the cold spot by Lawrence Rudnick from the University of Minnesota does indeed say that statistical uncertainties have not been accounted for.

Oh well. Now, on to the next cosmological mysteries like dark matter and dark energy!

Zhang and Huterer’s paper.

Huterer and Smith’s paper (2008)

Rudnick’s paper 2007

Original paper “finding” the cold spot

Sources: Technology Review Blog, Science