Many of the moons and planets across the Universe are in resonance with each other and their star. What causes this resonance, and how can it help us understand the history of planetary formation and migration?
If you would like to join the Weekly Space Hangout Crew, visit their site here and sign up. They’re a great team who can help you join our online discussions!
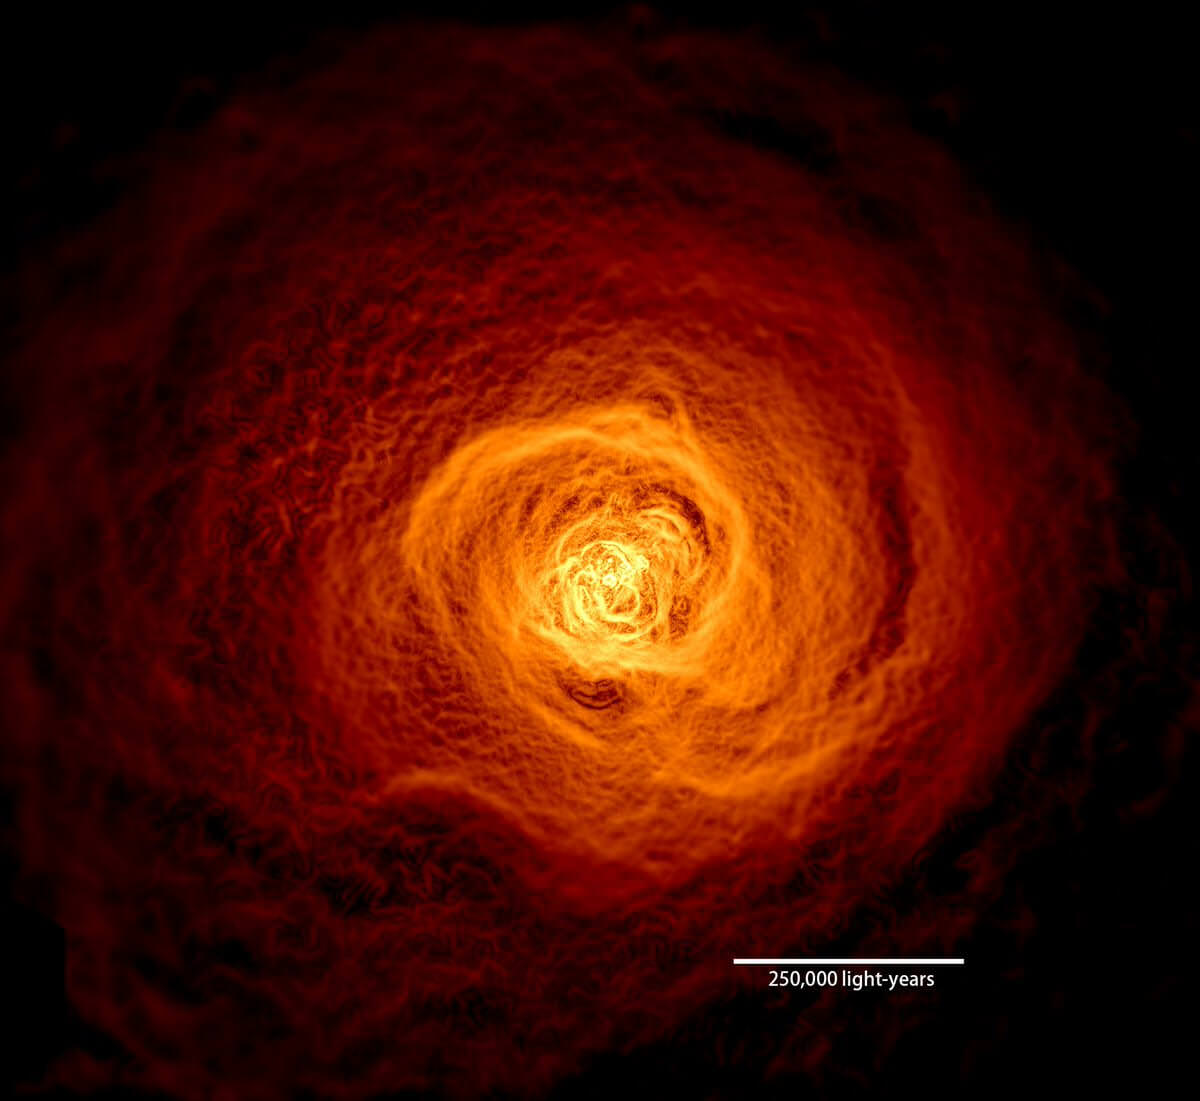
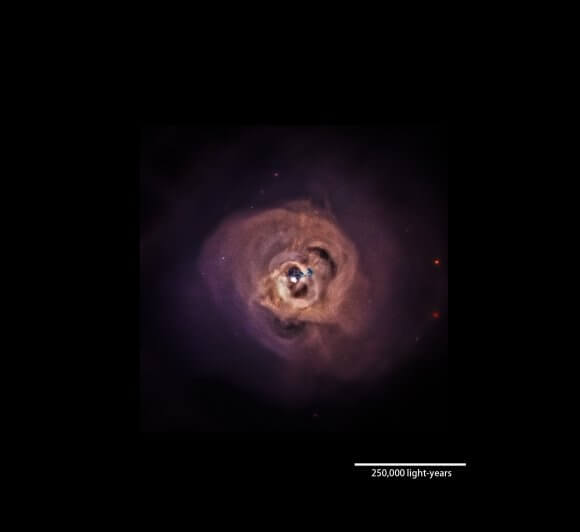
NASA has discovered a wave of hot gas larger than the Milky Way rolling through the Perseus galaxy cluster. This X-ray image is the result of 16 days of observing with the Chandra X-ray Observatory. The image was filtered to make details easier to see.Credit: NASA's Goddard Space Flight Center/Stephen Walker et al.
NASA has discovered a wave of hot gas larger than the Milky Way rolling through the Perseus galaxy cluster. This X-ray image is the result of 16 days of observing with the Chandra X-ray Observatory. The image was filtered to make details easier to see. Credits: NASA’s Goddard Space Flight Center/Stephen Walker et al.
An international team of scientists has discovered an enormous wave of hot gas rolling its way through the Perseus galaxy cluster. The wave is a giant version of what’s called a Kelvin-Helmholtz wave. They’re created when two fluids intersect at different velocities: for example, when wind blows over water.
“The wave we’ve identified is associated with the flyby of a smaller cluster, which shows that the merger activity that produced these giant structures is still ongoing.” – Stephen Walker, NASA’s Goddard Space Flight Center.
“Perseus is one of the most massive nearby clusters and the brightest one in X-rays, so Chandra data provide us with unparalleled detail,” said lead scientist Stephen Walker at NASA’s Goddard Space Flight Center in Greenbelt, Maryland. “The wave we’ve identified is associated with the flyby of a smaller cluster, which shows that the merger activity that produced these giant structures is still ongoing.”
The Perseus galaxy cluster, also known as Abell 426, is 240 million light years away, and is about 11 million light years across. It’s one of the most massive objects we know of, and it’s named after the Perseus constellation, which appears in the same part of the sky.
Galaxy clusters are the largest gravitationally-bound objects in the Universe. Most of the observable matter in galaxy clusters is gas. But the gas is super hot—tens of millions of degrees hot—which means it emits x-rays.
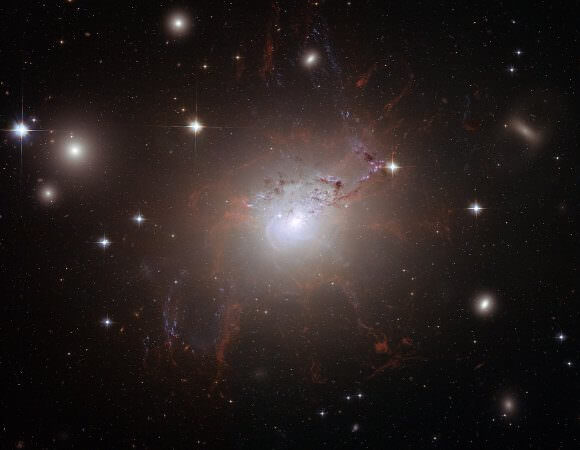
X-Ray observations of Perseus have revealed several features and structures in the gas structure of the cluster. Some of them are bubble-like features caused by the super-massive black hole (SMBH) in NGC 1275, the Perseus cluster’s central galaxy. Another of these features is known as “the bay.” The bay is a concave feature which couldn’t have been formed by the SMBH.
This Hubble image shows NGC 1275, the Super-Massive Black Hole at the center of the Perseus cluster. NGC 1275 could not have been responsible for the “bay” feature found in Perseus. Image: By NASA, ESA, and the Hubble Heritage (STScI/AURA)-ESA/Hubble Collaboration – http://hubblesite.org/newscenter/archive/releases/2008/28/image/a/, Public Domain, https://commons.wikimedia.org/w/index.php?curid=4634173
The bay is a puzzle because it doesn’t produce any emissions, which would be expected of something formed by a SMBH. The bay also doesn’t conform to models of how gas should behave in this situation.
The lead scientist behind the study is Stephen Walker at NASA’s Goddard Space Flight Center. Walker turned to the Chandra X-ray Observatory to help solve this puzzle. Existing Chandra images of the Perseus cluster were filtered in order to highlight the edges of structures, and to make any subtle details more visible.
These filtered and processed images were then compared to computer simulations of galaxy clusters merging. John ZuHone, an astrophysicist at the Harvard-Smithsonian Center for Astrophysics, has created an online catalog of these simulations.
“Galaxy cluster mergers represent the latest stage of structure formation in the cosmos.” -John ZuHone, Harvard-Smithsonian Center for Astrophysics.
“Galaxy cluster mergers represent the latest stage of structure formation in the cosmos. Hydrodynamic simulations of merging clusters allow us to produce features in the hot gas and tune physical parameters, such as the magnetic field. Then we can attempt to match the detailed characteristics of the structures we observe in X-rays.” -John ZuHone, Harvard-Smithsonian Center for Astrophysics.
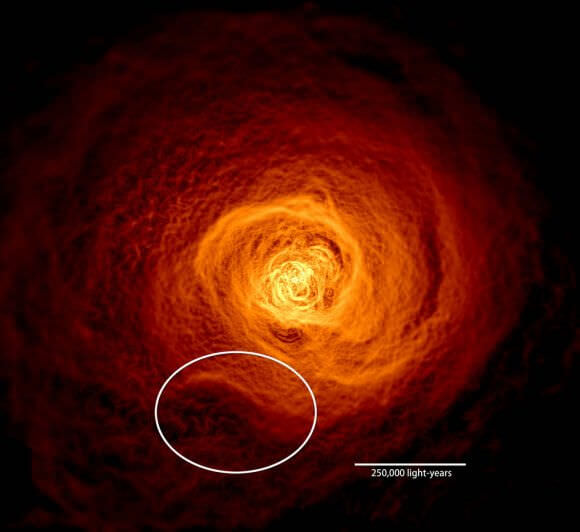
This alternate image of the Perseus galaxy cluster shows the wave at the 7 o’clock position. Image: NASA’s Goddard Space Flight Center/Stephen Walker et al.
One of the simulations matched what astronomers were seeing in Perseus. In it, a large cluster like Perseus had settled itself into two regions: a colder region of gas around 30 million degrees Celsius, and a hotter region of gas at almost 100 million degrees Celsius. In this model, a cluster smaller than Perseus, but about a thousand times more massive than the Milky Way passes close to Perseus, missing its center by about 650,000 light years.
That happened about 2.5 billion years ago, and it set off a chain of events still playing itself out.
The near miss caused a gravitational disturbance that created an expanding spiral of the colder gas. An enormous wave of gas has formed at the edge of the spiral of colder gas, where it intersects with the hotter gas. This is the Kelvin-Helmholtz wave seen in the images.
“We think the bay feature we see in Perseus is part of a Kelvin-Helmholtz wave, perhaps the largest one yet identified, that formed in much the same way as the simulation shows,” Walker said. “We have also identified similar features in two other galaxy clusters, Centaurus and Abell 1795.”
The study provided another benefit besides just spotting an impossibly enormous wave. It allowed the team to measure the magnetic properties of the Perseus cluster. The researchers discovered that the strength of the magnetic field in the cluster affected the size of the wave of gas. It the field is too strong, the waves don’t form at all, and if the magnetic field is too weak, then the waves would be even larger.
According to the team, there is no other known way to measure the magnetic field.
11 March 2011: The wave from a tsunami crashes over a street in Miyako City, Japan Credit: REUTERS/Mainichi Shimbun
For people living in oceanfront communities, the prospect of a tsunami is a frightening one. Much like earthquakes, volcanoes, hurricanes and tornadoes, tsunamis are one of the most destructive natural forces on the planet. And much like these other phenomena, they require the right conditions to happen and are more common in some areas of the world than others.
Knowing how and when a tsunami will strike has therefore a subject of great interest for scientists over the ages. But for anyone who has lived in certain parts of the world where “tsunami zones” are common – namely Japan and the South Pacific – it is a matter of survival.
Definition: Numerous terms are used in the English language to describe large waves created by the displacement of water, with varying degrees of accuracy. The term tsunami, for example, is literally translated from Japanese to mean “harbor wave”. There are only a few other languages that have an equivalent native word, though similar meanings can be found in Indonesia, Sri Lanka, and the Indian Subcontinent.
The term tidal wave has also been used, which is derived from the most common appearance of a tsunami – an extraordinarily high tidal bore. However, in recent years, the term “tidal wave” has fallen out of favor with the scientific community because tsunami actually have nothing to do with tides, which are produced by the gravitational pull of the moon and sun rather than the displacement of water.
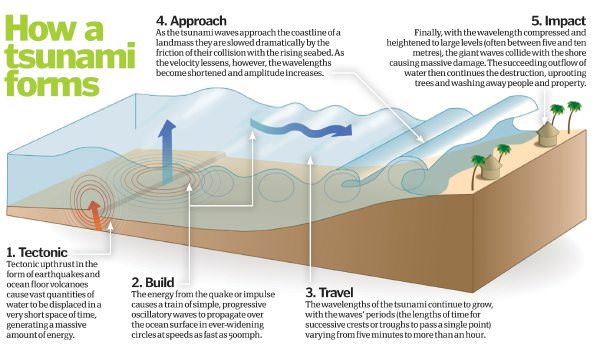
Tsunamis initiate when an earthquake causes the seabed to rupture, which leads to a rapid decrease in sea surface height directly above it. Credit: howitworksdaily.com
The term seismic sea wave also is used to refer to the phenomenon, due to the fact that the waves most often are generated by seismic activity such as earthquakes. However, like “tsunami,” “seismic sea wave” is not a completely accurate term, as forces other than earthquakes – including underwater landslides, volcanic eruptions, underwater explosions, land or ice slumping into the ocean, meteorite impacts, or even sudden changes in weather – can generate such waves by displacing water.
Causes: The principal cause of a tsunami is the displacement of a substantial volume of water or perturbation of the sea. This is usually the result of earthquakes, landslides, volcanic eruptions, glacier calvings, or more rarely by meteorites and nuclear tests. The waves formed in this way are then sustained by gravity.
Tectonic earthquakes trigger tsunamis when the sea floor abruptly deforms and vertically displaces the water above. More specifically, a tsunami can be generated when thrust faults associated with convergent or destructive plate boundaries move abruptly and displace water.
Tsunamis have a small amplitude (wave height) offshore, and a very long wavelength (often hundreds of kilometers long), and only grow in height when they reach shallower water. Once there, the wavelength shortens as the wave encounters resistance, thus increasing the amplitude increases and causing the wave to rears up in a massive tidal bore.
In the 1950s, it was discovered that tsunamis larger than what had previously been believed possible could be caused by giant submarine landslides. These rapidly displace large water volumes, as energy transfers to the water at a rate faster than the water can absorb. Their existence was confirmed in 1958, when a giant landslide in Lituya Bay, Alaska, caused the highest wave ever recorded (524 meters/1700 feet).
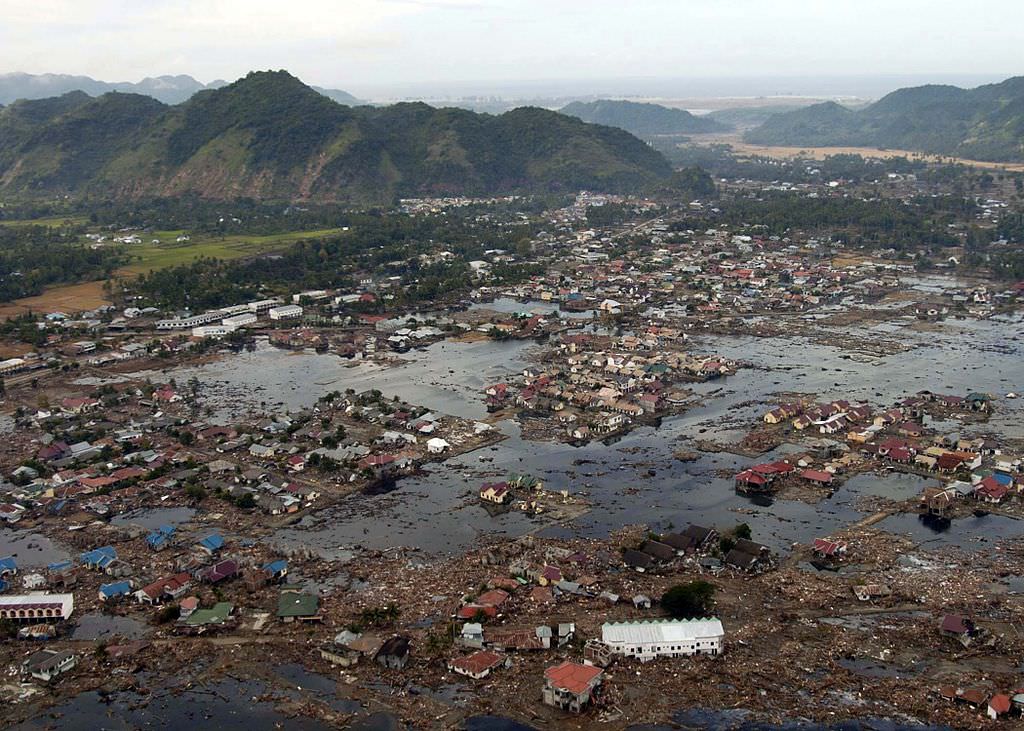
A village near the coast of Sumatra that was devastated by the Tsunami that struck South-East Asia in 2004. Credit: US Navy/Public Domain
In general, landslides generate displacements mainly in the shallower parts of the coastline, such as in closed bays and lakes. But an open oceanic landslide large enough to cause a tsunami across an ocean has not yet happened since the advent of modern seismology, and only rarely in human history.
Meteorological phenomena, such tropical cyclones, can generate a storm surge that will cause sea levels to rise, often in coastal regions. These are what is known as meteotsunamis, which are tsunamis triggered by sudden changes in weather. When such tsunamis reach shore, they rear up in shallows and surge laterally, just like earthquake-generated tsunamis.
Tsunamis can also be triggered by external factors, such as meteors or human intervention. For instance, when a meteor of significant strikes a region of the ocean, the resulting impact is enough to displace high volumes of water, thus triggering a tsunami. There has also been much speculation since World War II of how a nuclear detonations have trigger a tsunami, but all attempts at research (especially in the Pacific) have yielded poor results.
Characteristics and Effects: Tsunamis can travel at well over 800 kilometers per hour (500 mph), but as they approach the coast, wave shoaling compresses the wave and its speed decreases to below 80 kilometers per hour (50 mph). A tsunami in the deep ocean has a much larger wavelength of up to 200 kilometers (120 mi), but diminishes to less than 20 kilometers (12 mi) when it reaches shallow water.
When the tsunami’s wave peak reaches the shore, the resulting temporary rise in sea level is termed run up. Run up is measured in metres above a reference sea level. A large tsunami may feature multiple waves arriving over a period of hours, with significant time between the wave crests.
Tsunamis cause damage by two mechanisms. First, there is the smashing force of a wall of water traveling at high speed, while the second is the destructive power of a large volume of water draining off the land and carrying a large amount of debris with it.
It is often difficult for people to recognize a tsunami in the open ocean because the waves are much smaller further out at sea than they are close to shore. As with earthquakes, several attempts have been made to set up scales of tsunami intensity or magnitude to allow comparison between different events.
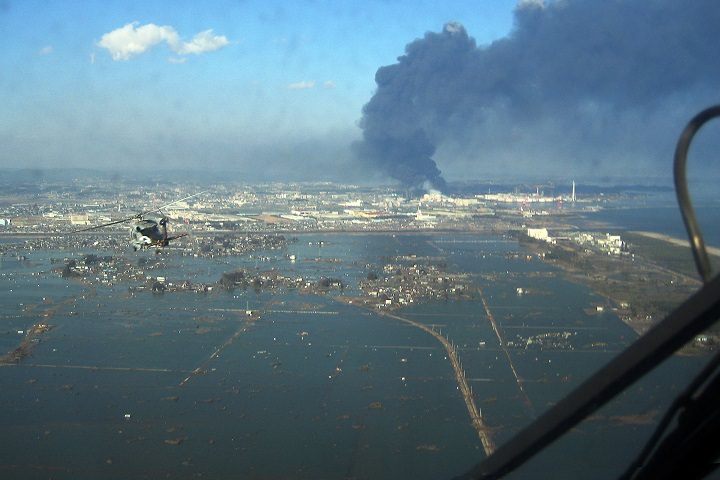
Ships try to extinguish a blaze at oil refinery tanks in Ichihara, Chiba Prefecture, after the tsunami that struck in March, 2011. Credit: EPA
The first scales used routinely to measure the intensity of tsunami were the Sieberg-Ambraseys scale, used in the Mediterranean Sea and the Imamura-Iida intensity scale, used in the Pacific Ocean. This latter scale was modified by Soloviev to become the Soloviev-Imamura tsunami intensity scale, which is used in the global tsunami catalogs compiled by the NGDC/NOAA and the Novosibirsk Tsunami Laboratory as the main parameter for the size of the tsunami.
In 2013, following the intensively studied tsunamis in 2004 and 2011, a new 12 point scale was proposed, known as the Integrated Tsunami Intensity Scale (ITIS-2012). This scale was intended to match as closely as possible to the modified ESI2007 and EMS earthquake intensity scales.
Tsunamis throughout History: Japan and the Pacific Ocean may have the longest recorded history of tsunamis, but they are an often underestimated hazard in the Mediterranean Sea region and Europe in general. In his History of the Peloponnesian War (426 BCE), Greek historian Thucydides offered what could be considered the first recorded speculation about the causes of tsunamis – where he argued that earthquakes at sea were the reason for them.
An aerial view of tsunami damage in Tohoku. Credit: US Navy
After the tsunami of 365 CE devastated Alexandria, Roman historian Ammianus Marcellinus described the typical sequence of a tsunami. His descriptions included an earthquake and the sudden retreat of the sea, followed by a gigantic wave.
More modern examples include the 1755 Lisbon earthquake and tsunami (which was caused by activity in the Azores–Gibraltar Transform Fault); the 1783 Calabrian earthquakes, which caused several ten thousand deaths; and the 1908 Messina earthquake and tsunami – which caused 123,000 deaths in Sicily and Calabria and is considered one of the most deadly natural disasters in modern European history.
But by far, the 2004 Indian Ocean earthquake and tsunami was the most devastating of its kind in modern times, killing around 230,000 people and laying waste to communities throughout Indonesia, Thailand, and Southern Asia.
In 2010, an earthquake triggered a tsunami which devastated several coastal towns in south-central Chile, damaged the port at Talcahuano and caused 4334 confirmed fatalities. The earthquake also generated a blackout that affected 93 percent of the Chilean population.
In 2011, an earthquake off the Pacific coast of Tohoku led to a tsunami that struck Japan and led to 5,891 deaths, 6,152 injuries, and 2,584 people to be declared missing across twenty prefectures. The tsunami also caused meltdowns at three reactors in the Fukushima Daiichi Nuclear Power Plant complex.
Tsunamis are a force of nature, without a doubt. And knowing when, where, and how severely they will strike is intrinsic to ensuring that we can limit the damage they do cause.
Universe Today has articles on about tsunamis and causes of tsunamis.
Light is tricky stuff, and it took scientists hundreds of years to puzzle out what this stuff is. But they poked and prodded at it with many clever experiments to try to measure its speed, motion and interaction with the rest of the Universe. For example, the Fizeau Experiment, which ran light through moving water to see if that caused a difference. Continue reading “Astronomy Cast Ep. 369: The Fizeau Experiment”
Waves move through a medium, like water or air. So it seemed logical to search for a medium that light waves move through. The Michelson-Morley Experiment attempted to search for this medium, known as the “luminiferous aether”. The experiment gave a negative result, and helped set the stage for the theory of General Relativity. Continue reading “Astronomy Cast Ep. 368: Searching for the Aether Wind: the Michelson–Morley Experiment”
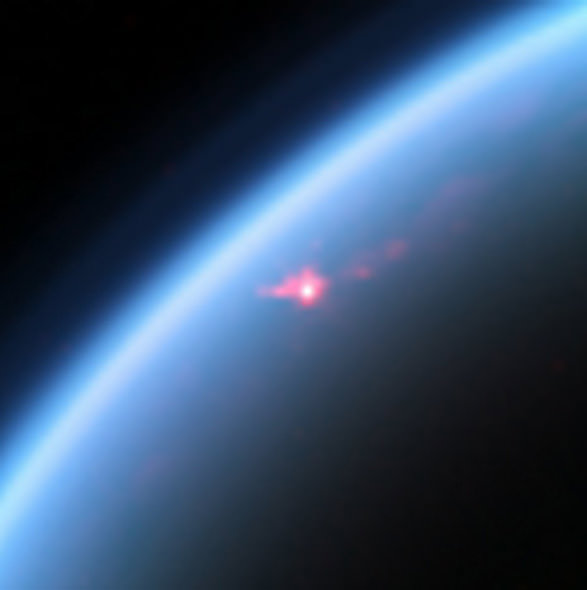
Cassini VIMS image of specular reflections in one of Titan's lakes from a flyby on July 24, 2012 (NASA/JPL-Caltech/SSI/Jason W. Barnes et al.)
It’s no surprise that Titan’s north polar region is covered with vast lakes and seas of liquid methane — these have been imaged many times by Cassini during its ten years in orbit around Saturn. What is surprising though is just how incredibly smooth the surfaces of these lakes have been found to be.
One would think that such large expanses of surface liquid — some of Titan’s seas are as big the Great Lakes — would exhibit at least a little surface action on a world with an atmosphere as dense as Titan’s. But repeated radar imaging has shown their surfaces to be “as smooth as the paint on a car.” Over the past several years scientists have puzzled over this anomaly but now they may have truly seen the light — that is, reflected light from what could actually be waves on Titan!
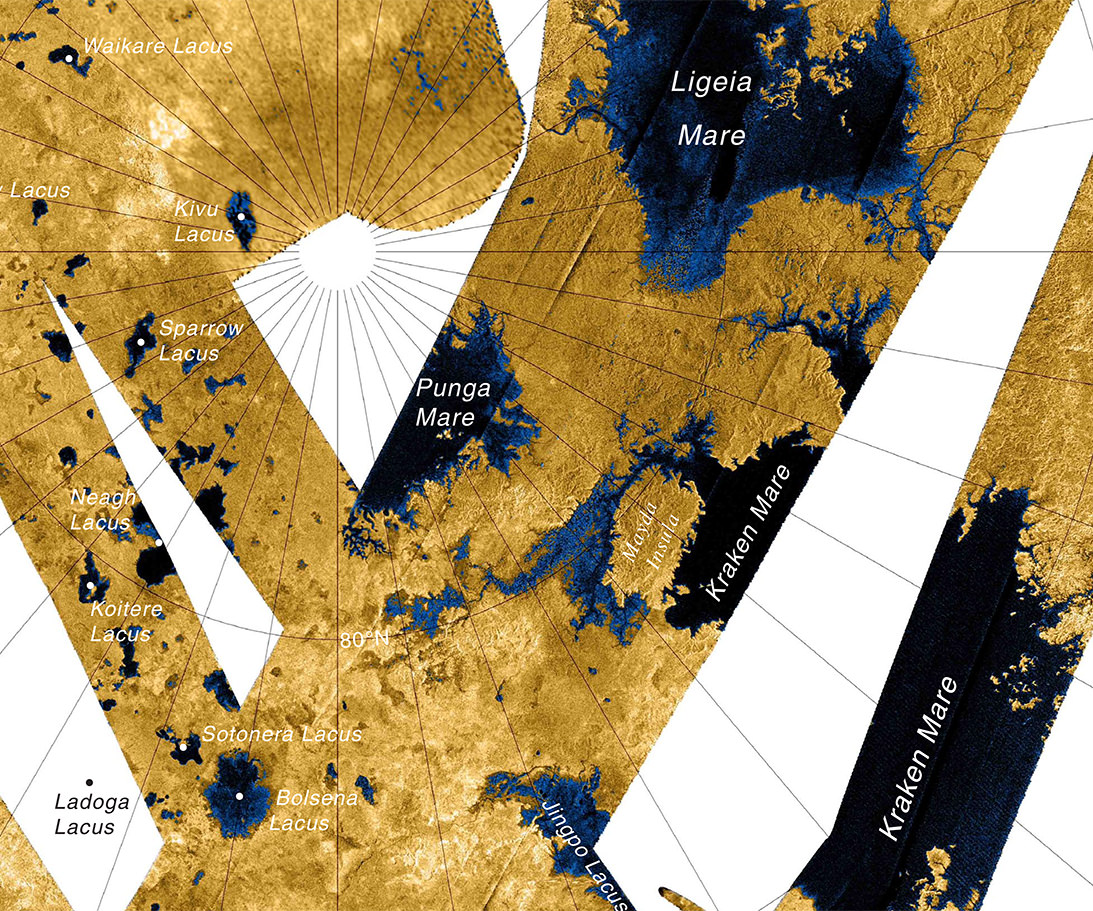
Using data acquired during flybys of Titan in 2012 and 2013, planetary scientist Jason Barnes from the University of Idaho and a team of researchers from several other institutions including JPL, Cornell, and MIT, have identified what might be waves in the surface of Punga Mare, one of Titan’s biggest lakes.
For a sense of scale, Lake Victoria, the largest lake in Africa, could fit lengthwise across Titan’s 380-km (236-mile) -wide Punga Mare.
Variations in specular highlights in four pixels observed in the surface of Punga Mare by Cassini’s VIMS (Visible and Infrared Mapping Spectrometer) have been interpreted by the team as being the result of waves — or, perhaps more accurately, ripples, seeing as that they are estimated to be a mere 2 centimeters in height.
Still, based on what’s been observed thus far on Titan, that’s downright choppy.
If the Cassini observations interpreted by Barnes et al. are indicative of waves in Punga Mare, they could also explain previous specular variations seen in other bodies of liquid, like the smaller Kivu Lacus (top image).
Map of Titan’s northern “Land o’ Lakes” made from Cassini high-resolution radar imaging (NASA/JPL/USGS)
“If correct this discovery represents the first sea-surface waves known outside of Earth.”
– Jason W. Barnes et al.
Then again, wave action isn’t the only possible answer. Similar varied specular highlights could also be caused by a wet surface — like a methane mud flat. Further observations will be needed to rule out other possibilities and obtain a more accurate “surf forecast” for Titan.
Two white dwarfs similar to those in the system SDSS J065133.338+284423.37 spiral together in this illustration from NASA. Credit: D. Berry/NASA GSFC
Locked in a spiraling orbital embrace, the super-dense remains of two dead stars are giving astronomers the evidence needed to confirm one of Einstein’s predictions about the Universe.
A binary system located about 3,000 light-years away, SDSS J065133.338+284423.37 (J0651 for short) contains two white dwarfs orbiting each other rapidly — once every 12.75 minutes. The system was discovered in April 2011, and since then astronomers have had their eyes — and four separate telescopes in locations around the world — on it to see if gravitational effects first predicted by Einstein could be seen.
According to Einstein, space-time is a structure in itself, in which all cosmic objects — planets, stars, galaxies — reside. Every object with mass puts a “dent” in this structure in all dimensions; the more massive an object, the “deeper” the dent. Light energy travels in a straight line, but when it encounters these dents it can dip in and veer off-course, an effect we see from Earth as gravitational lensing.
Einstein also predicted that exceptionally massive, rapidly rotating objects — such as a white dwarf binary pair — would create outwardly-expanding ripples in space-time that would ultimately “steal” kinetic energy from the objects themselves. These gravitational waves would be very subtle, yet in theory, observable.
What researchers led by a team at The University of Texas at Austin have found is optical evidence of gravitational waves slowing down the stars in J0651. Originally observed in 2011 eclipsing each other (as seen from Earth) once every six minutes, the stars now eclipse six seconds sooner. This equates to a predicted orbital period reduction of about 0.25 milliseconds each year.*
“These compact stars are orbiting each other so closely that we have been able to observe the usually negligible influence of gravitational waves using a relatively simple camera on a 75-year-old telescope in just 13 months,” said study lead author J.J. Hermes, a graduate student at The University of Texas at Austin.
Based on these measurements, by April 2013 the stars will be eclipsing each other 20 seconds sooner than first observed. Eventually they will merge together entirely.
Although this isn’t “direct” observation of gravitational waves, it is evidence inferred by their predicted effects… akin to watching a floating lantern in a dark pond at night moving up and down and deducing that there are waves present.
“It’s exciting to confirm predictions Einstein made nearly a century ago by watching two stars bobbing in the wake caused by their sheer mass,” said Hermes.
As of early last year NASA and ESA had a proposed mission called LISA (Laser Interferometer Space Antenna) that would have put a series of 3 detectors into space 5 million km apart, connected by lasers. This arrangement of precision-positioned spacecraft could have detected any passing gravitational waves in the local space-time neighborhood, making direct observation possible. Sadly this mission was canceled due to FY2012 budget cuts for NASA, but ESA is moving ahead with developments for its own gravitational wave mission, called eLISA/NGO — the first “pathfinder” portion of which is slated to launch in 2014.
The study was submitted to Astrophysical Journal Letters on August 24. Read more on the McDonald Observatory news release here.
Inset image: simulation of binary black holes causing gravitational waves – C. Reisswig, L. Rezzolla (AEI); Scientific visualization – M. Koppitz (AEI & Zuse Institute Berlin)
*The difference in the eclipse time is noted as six seconds even though the orbital period decay of the two stars is only .25 milliseconds/year because of a pile-up effect of all the eclipses observed since April 2011. The measurements made by the research team takes into consideration the phase change in the J0651 system, which experiences a piling effect — similar to an out-of-sync watch — that increases relative to time^2 and is therefore a larger and easier number to detect and work with. Once that was measured, the actual orbital period decay could be figured out.
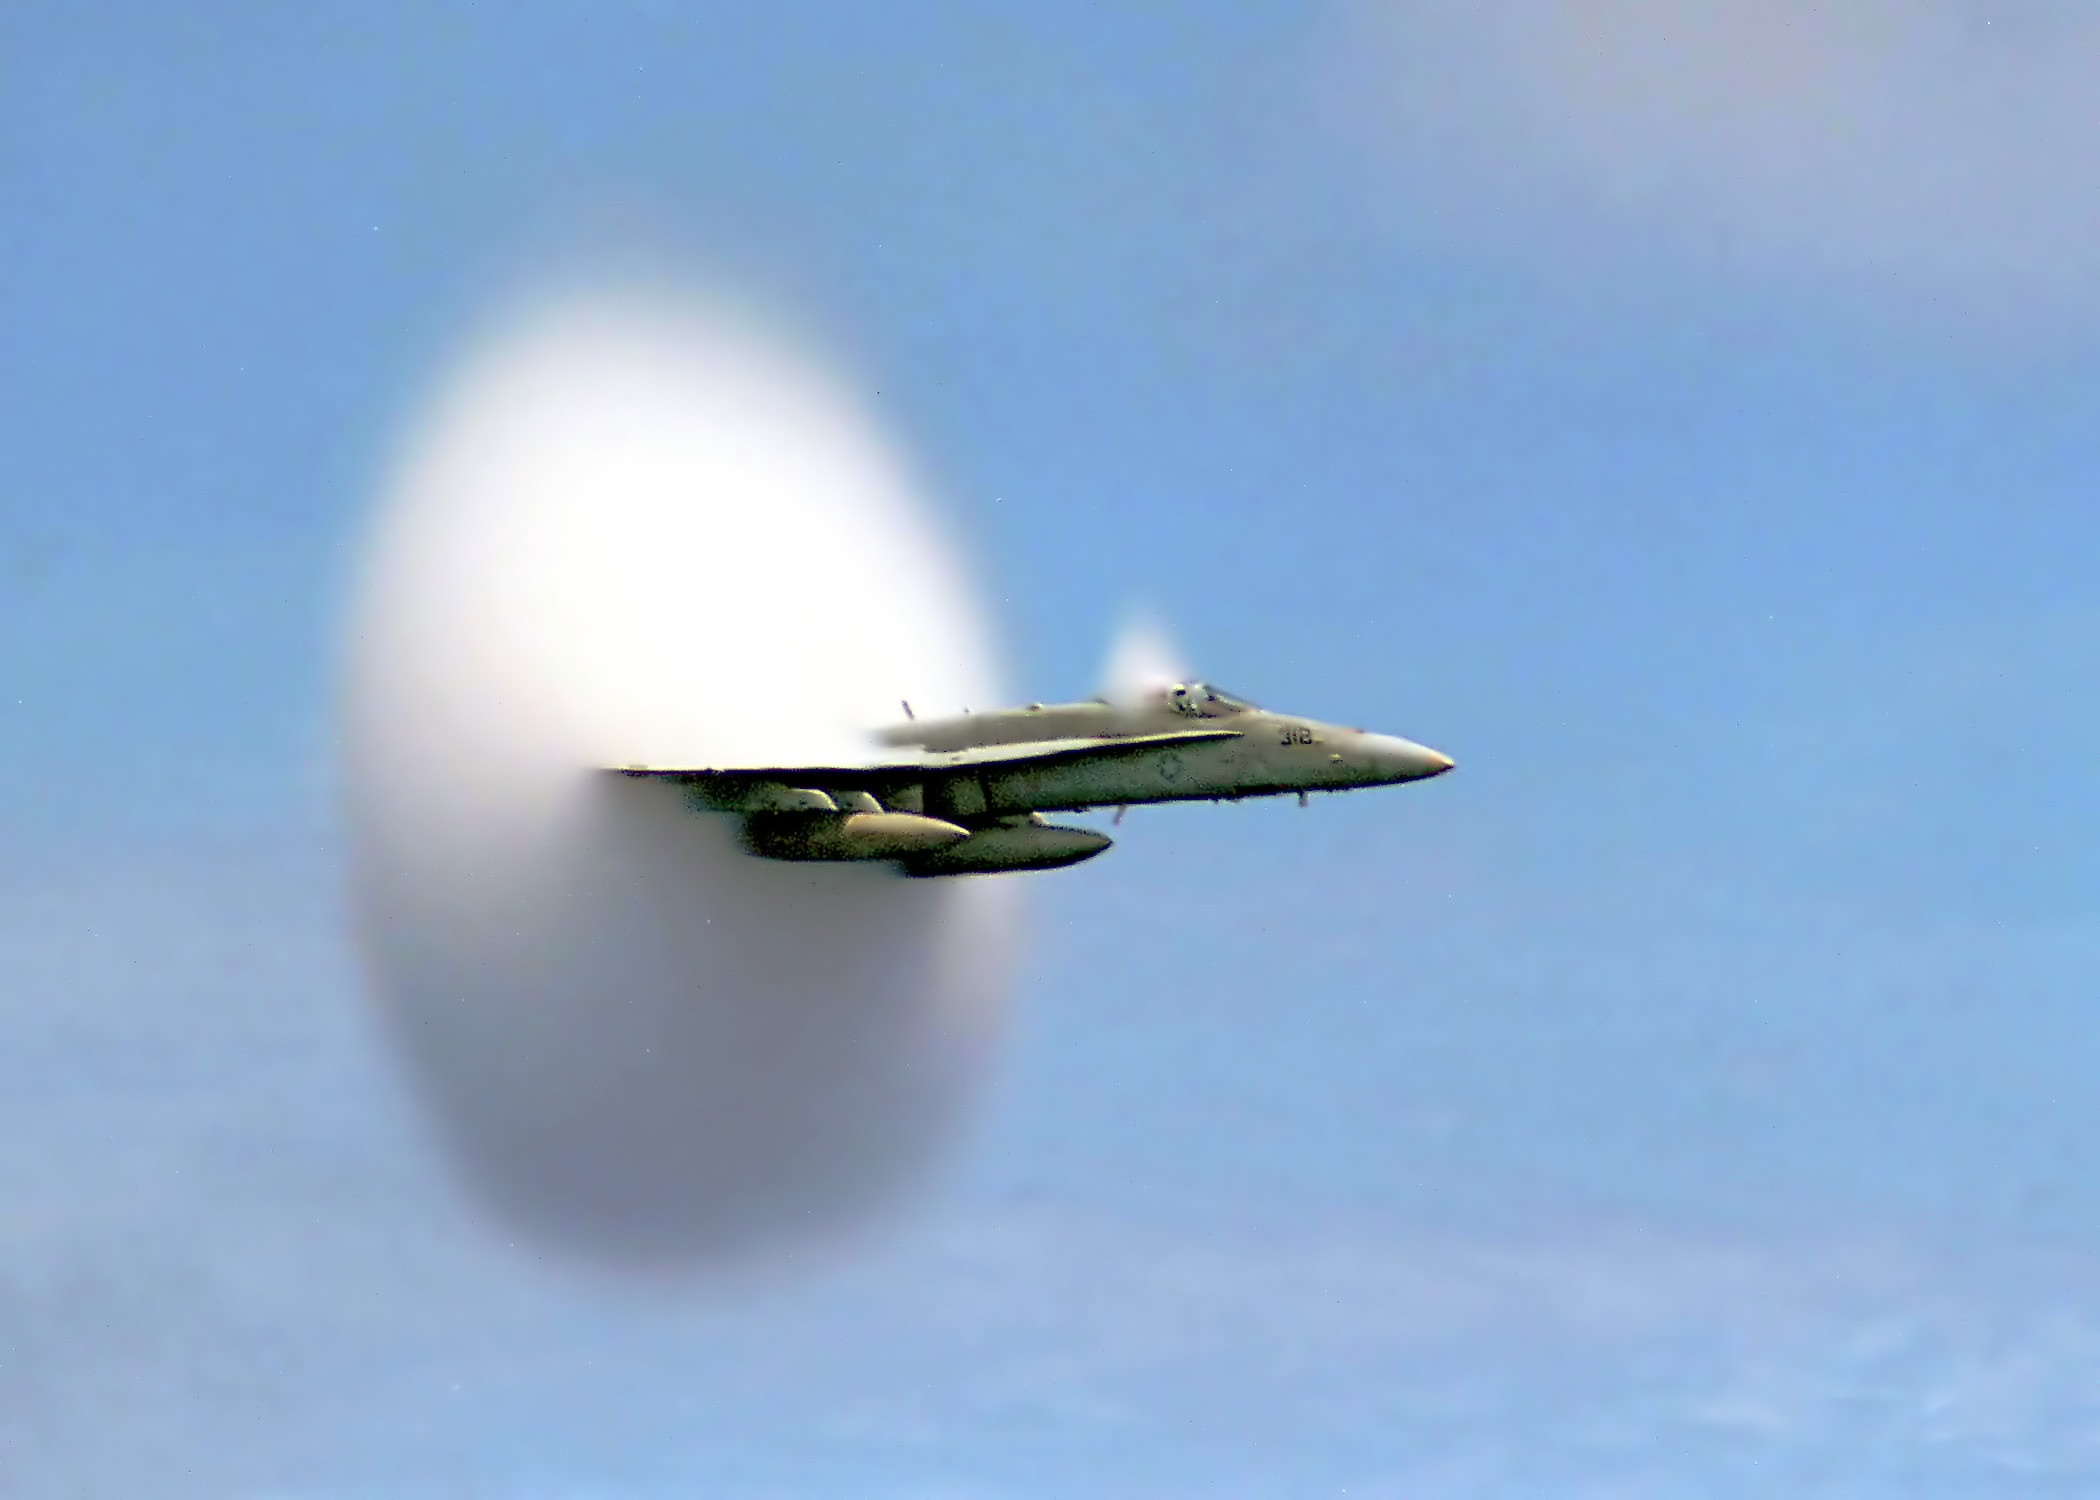
[/caption]Light and sound are both waves. However, the former can travel through a vacuum while the latter cannot. So what is sound and how does it propagate as a wave?
Sound is actually a pressure wave. When an object vibrates, it creates a mechanical disturbance in the medium in which it is directly adjacent to. Usually, the medium is air. The medium then carries the disturbance in the form of oscillating and propagating pressure waves.
The frequency of the waves are dependent on the frequency of the vibrating source. If the frequency of the vibrating source is high, then the sound wave will also have a high frequency. The sounds that we hear, from the voice of the person right next to you, to the music coming from your iPod earphones, to the crashing noise of shattered glass, all come from a vibrating source.
As the sound waves propagate through a medium, the pressure at a localized region in the medium alternates between compressions and rarefactions (or decompressions). Thus, if at one instant, a region in the medium experiences compression, the regions adjacent to it along the line of propagation are expected to be experiencing rarefactions.
Then as time progresses, the region in question undergoes a rarefaction while those adjacent to it undergo compressions. Therefore, if no medium exists, then the compressions and rarefactions cannot occur.
Now, how does one hear sounds? Remember how a source has to vibrate to produce a sound wave, and how a vibrating medium (e.g. air) has to exist to allow the sound wave to propagate? In the same manner, the receiver of the sound has to have something that can vibrate in order to ‘interpret’ the sound carried by the vibrating medium.
In the case of our ears, our eardrums serve as the receivers. When the vibrating air reaches our eardrums, it causes our eardrums to vibrate as well. The eardrums then transmit these vibrations to tiny bones in the middle ear, and so on until they reach the inner ear where the oscillating pressures are converted into electrical signals and sent to the brain.
Our ears are sensitive to vibrations between 20 to 20,000 Hz. Normally, frequencies that are higher or lower than the range provided cannot be processed by our auditory system. Young kids however, are able to hear slightly higher frequencies. That means, the range over which we are sensitive to diminishes as we grow older.
We have some articles in Universe Today that are related to sound. Here are two of them:
Hypersonic
Supersonic
Speed of sound references, brought to you by NASA. Here are the links: