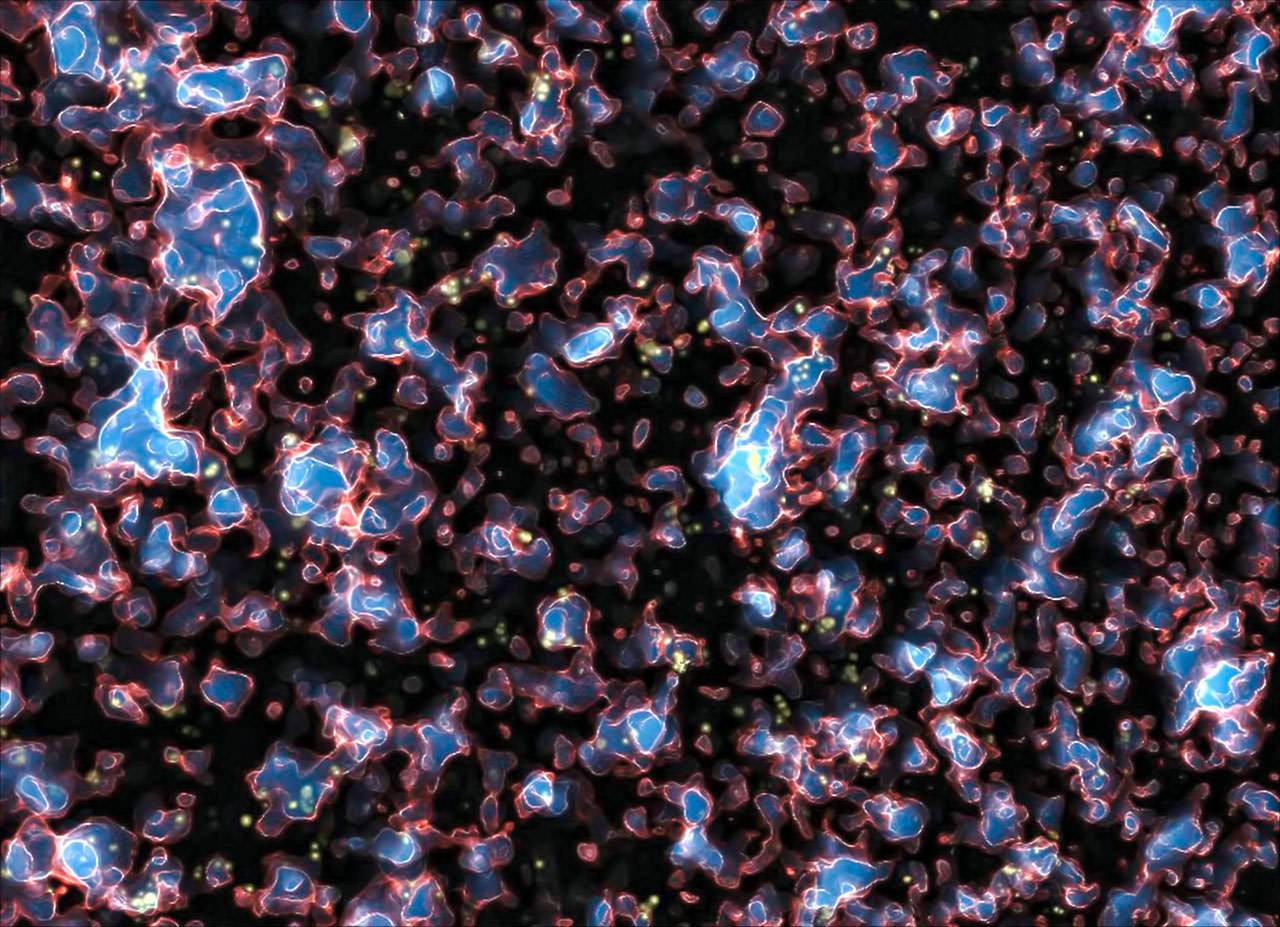
A simulation of galaxies during the era of deionization in the early Universe. Credit: M. Alvarez, R. Kaehler, and T. AbelCredit: M. Alvarez, R. Kaehler, and T. Abel
In the beginning, there was chaos.
Hot, dense, and packed with energetic particles, the early Universe was a turbulent, bustling place. It wasn’t until about 300,000 years after the Big Bang that the nascent cosmic soup had cooled enough for atoms to form and light to travel freely. This landmark event, known as recombination, gave rise to the famous cosmic microwave background (CMB), a signature glow that pervades the entire sky.
Now, a new analysis of this glow suggests the presence of a pronounced bruise in the background — evidence that, sometime around recombination, a parallel universe may have bumped into our own.
Although they are often the stuff of science fiction, parallel universes play a large part in our understanding of the cosmos. According to the theory of eternal inflation, bubble universes apart from our own are theorized to be constantly forming, driven by the energy inherent to space itself.
Like soap bubbles, bubble universes that grow too close to one another can and do stick together, if only for a moment. Such temporary mergers could make it possible for one universe to deposit some of its material into the other, leaving a kind of fingerprint at the point of collision.
Ranga-Ram Chary, a cosmologist at the California Institute of Technology, believes that the CMB is the perfect place to look for such a fingerprint.
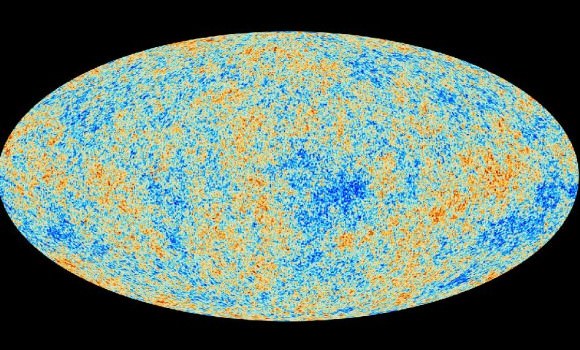
The cosmic microwave background (CMB), a pervasive glow made of light from the Universe’s infancy, as seen by the Planck satellite in 2013. Tiny deviations in average temperature are represented by color. Credit: ESA and the Planck Collaboration.
After careful analysis of the spectrum of the CMB, Chary found a signal that was about 4500x brighter than it should have been, based on the number of protons and electrons scientists believe existed in the very early Universe. Indeed, this particular signal — an emission line that arose from the formation of atoms during the era of recombination — is more consistent with a Universe whose ratio of matter particles to photons is about 65x greater than our own.
There is a 30% chance that this mysterious signal is just noise, and not really a signal at all; however, it is also possible that it is real, and exists because a parallel universe dumped some of its matter particles into our own Universe.
After all, if additional protons and electrons had been added to our Universe during recombination, more atoms would have formed. More photons would have been emitted during their formation. And the signature line that arose from all of these emissions would be greatly enhanced.
Chary himself is wisely skeptical.
“Unusual claims like evidence for alternate Universes require a very high burden of proof,” he writes.
Indeed, the signature that Chary has isolated may instead be a consequence of incoming light from distant galaxies, or even from clouds of dust surrounding our own galaxy.
If the Sun, Earth and Moon are lined up, shouldn’t we get a lunar and solar eclipse every month? Clearly, we don’t, but why not?
Coincidences happen all the time. Right, Universe? One of the most amazing is that Moon and the Sun appear to be almost exactly the same size in the sky and they’re both the size of your pinky fingernail held at arm’s length. These coincidences just keep piling up. Thanks Universe?
There are two kinds of eclipses: solar and lunar. Well, there’s a third kind, but we’d best not think about that.
A solar eclipse occurs when the Moon passes in between the Earth and Sun, casting a shadow down on the surface of our planet. If you’re in the path of the shadow, the Moon destroys the Sun. No, wait, I mean the Moon blocks the Sun briefly.
A lunar eclipse happens when the Moon passes through the Earth’s shadow. We see one limb of the Moon darken until the entire thing is in shadow.
You’ve got the Sun, Earth and Moon all in a line. Where they’re like this, it’s a solar eclipse, and when they’re like this, it’s a lunar eclipse.
If the Moon takes about a month to orbit the Earth, shouldn’t we get an eclipse every two weeks? First a solar eclipse, and then two weeks later, lunar eclipse, back and forth? And occasionally a total one of the heart? But we don’t get them every month, in fact, it can take months and months between eclipses of any kind.
If the Sun, Earth and Moon were truly lined up perfect, this would be the case. But the reality is that they’re not lined up. The Moon is actually on an inclined plane to the Earth.
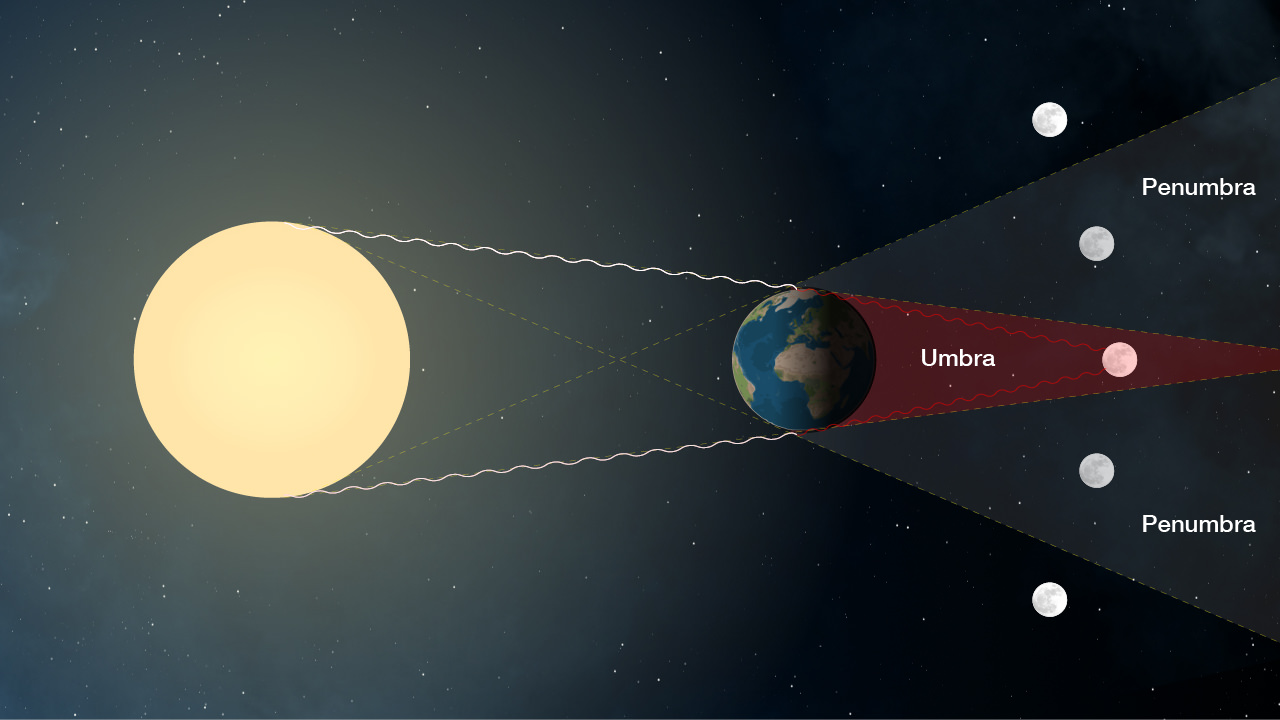
The geometry that creates a total lunar eclipse. Credit: NASA
Imagine the Solar System is a flat disk, like a DVD. You kids still know what those are, right? This is the plane of the ecliptic, and all of the planets are arranged in that disk.
But the Moon is on another disk, which is inclined at an angle of 5.14 degrees. So, if you follow the orbit of the Moon as it goes around the Earth, sometimes it’s above the plane of the ecliptic and sometimes it’s below. So the shadow cast by the Moon misses the Earth, or the shadow cast by the Earth misses the Moon.
But other times, the Sun, Moon and Earth are aligned, and we get eclipses. In fact, eclipses tend to come in pairs, with a solar eclipse followed by a lunar eclipse, because everything is nicely aligned.
Wondering why the Moon turns red during a lunar eclipse? It’s the same reason we see red sunsets here on Earth – the atmosphere filters out the green to violet range of the spectrum, letting the red light pass through.
Lunar Eclipse from New Jersey 12-21-2010. Credit: Robert Vanderbei
The Earth’s atmosphere refracts the sunlight so that it’s bent slightly, and can illuminate the Moon during the greatest eclipse. It’s an eerie sight, and well worth hanging around outside to watch it happen. We just had recently had a total lunar eclipse, did you get a chance to see it? Wasn’t it awesome?
Don’t forget about the total solar eclipse that’s going to be happening in August, 2017. It’s going to cross the United States from Oregon to Tennessee and should be perfect viewing for millions of people in North America. We’ve already got our road trip planned out.
Are you planning to see the 2017 eclipse? Tell us your plans in the comments below.
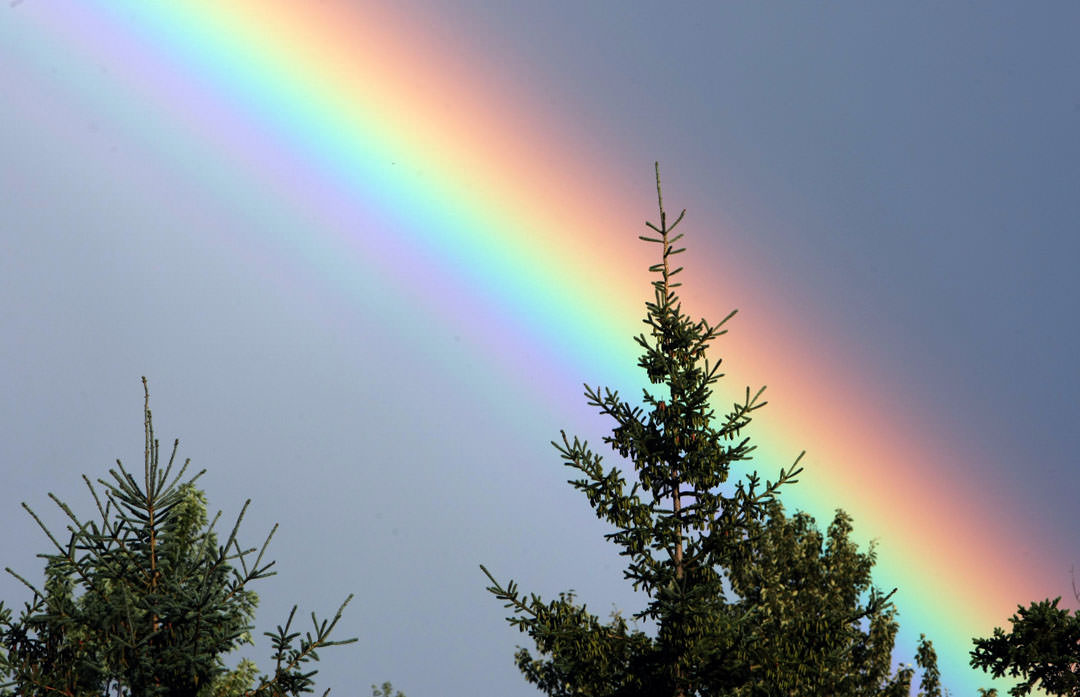
A colorful piece of rainbow begs the question - why Roy G. Biv? Credit: Bob King
Children often ask simple questions that make you wonder if you really understand your subject. An young acquaintance of mine named Collin wondered why the colors of the rainbow were always in the same order — red, orange, yellow, green, blue, indigo, violet. Why don’t they get mixed up?
The familiar sequence is captured in the famous Roy G. Biv acronym, which describes the sequence of rainbow colors beginning with red, which has the longest wavelength, and ending in violet, the shortest. Wavelength — the distance between two successive wave crests — and frequency, the number of waves of light that pass a given point every second, determine the color of light.
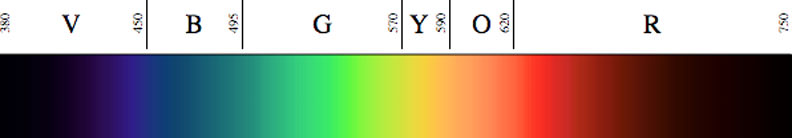
The familiar colors of the rainbow spectrum with wavelengths shown in nanometers. Credit: NASA
The cone cells in our retinas respond to wavelengths of light between 650 nanometers (red) to 400 (violet). A nanometer is equal to one-billionth of a meter. Considering that a human hair is 80,000-100,000 nanometers wide, visible light waves are tiny things indeed.
So why Roy G. Biv and not Rob G. Ivy? When light passes through a vacuum it does so in a straight line without deviation at its top speed of 186,000 miles a second (300,000 km/sec). At this speed, the fastest known in the universe as described in Einstein’s Special Theory of Relativity, light traveling from the computer screen to your eyes takes only about 1/1,000,000,000 of second. Damn fast.
But when we look beyond the screen to the big, wide universe, light seems to slow to a crawl, taking all of 4.4 hours just to reach Pluto and 25,000 years to fly by the black hole at the center of the Milky Way galaxy. Isn’t there something faster? Einstein would answer with an emphatic “No!”
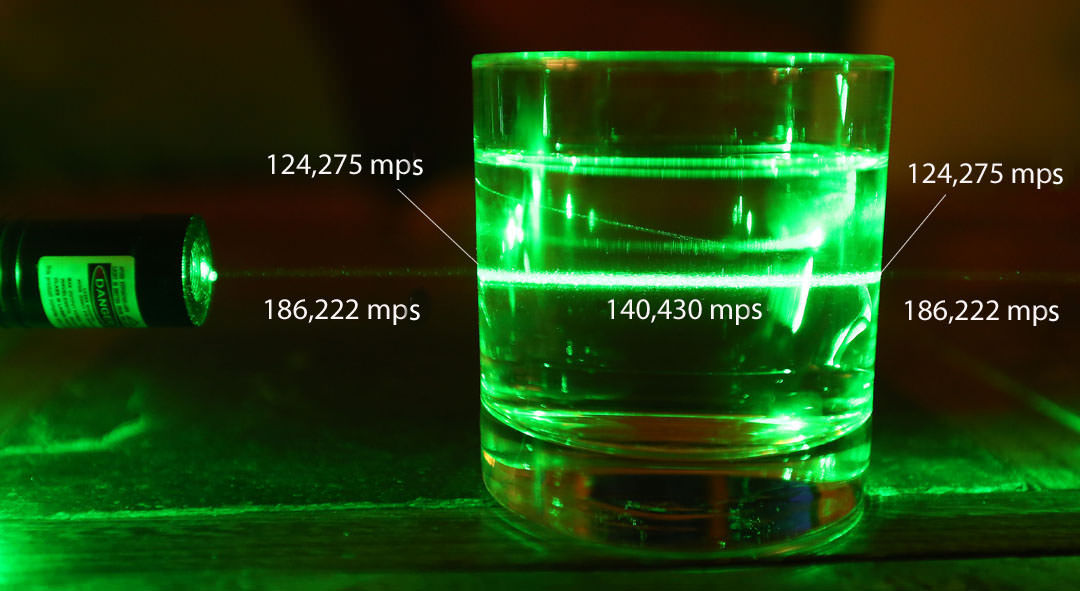
A laser beam (left) shining through a glass of water demonstrates how many times light changes speed — from 186,222 miles per second (mps) in air to 124,275 mps through the glass. It speeds up again to 140,430 mps in water, slows down when passing through the other side of the glass and then speeds up again when leaving the glass for the air. Credit: Bob King
One of light’s most interesting properties is that it changes speed depending on the medium through which it travels. While a beam’s velocity through the air is nearly the same as in a vacuum, “thicker” mediums slow it down considerably. One of the most familiar is water. When light crosses from air into water, say a raindrop, its speed drops to 140,430 miles a second (226,000 km/sec). Glass retards light rays to 124,275 miles/second, while the carbon atoms that make up diamond crunch its speed down to just 77,670 miles/second.
Why light slows down is a bit complicated but so interesting, let’s take a moment to describe the process. Light entering water immediately gets absorbed by atoms of oxygen and hydrogen, causing their electrons to vibrate momentarily before it’s re-emitting as light. Free again, the beam now travels on until it slams into more atoms, gets their electrons vibrating and gets reemitted again. And again. And again.
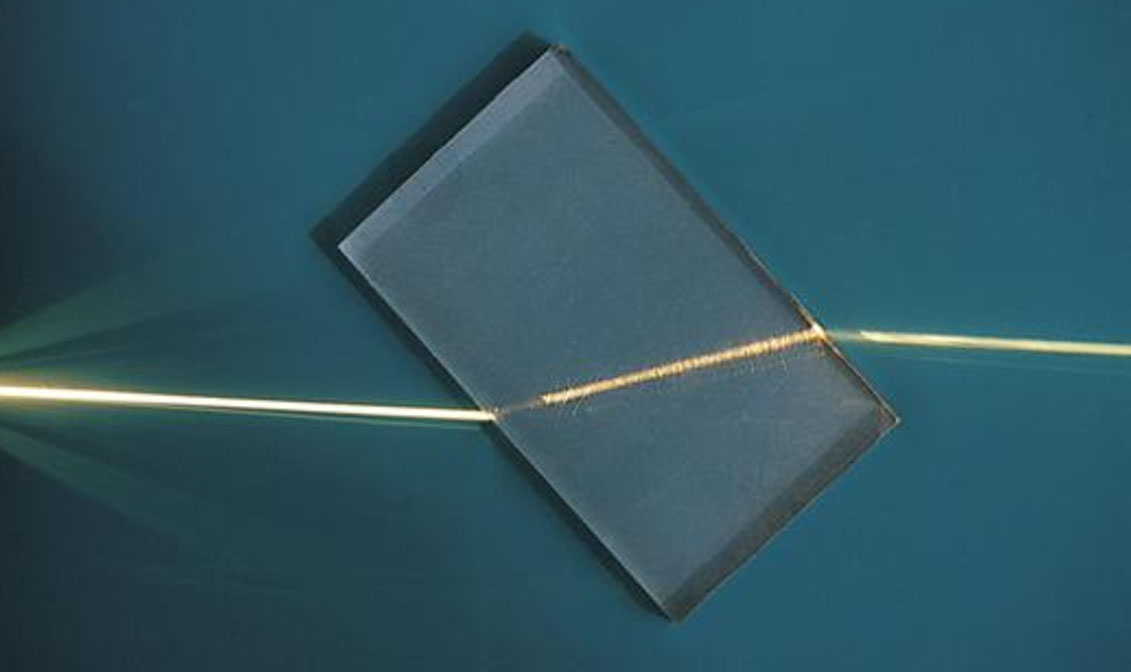
A ray of light refracted by a plastic block. Notice that the light bends twice – once when it enters (moving from air to plastic) and again when it exits (plastic to air). The beam slows down on entering and then speeds up again when it exits.
Like an assembly line, the cycle of absorption and reemission continues until the ray exits the drop. Even though every photon (or wave – your choice) of light travels at the vacuum speed of light in the voids between atoms, the minute time delays during the absorption and reemission process add up to cause the net speed of the light beam to slow down. When it finally leaves the drop, it resumes its normal speed through the airy air.
Light rays get bent or refracted when they move from one medium to another. We’ve all seen the “broken pencil” effect when light travels from air into water.
Let’s return now to rainbows. When light passes from one medium to another and its speed drops, it also gets bent or refracted. Plop a pencil in a glass half filled with water and and you’ll see what I mean.
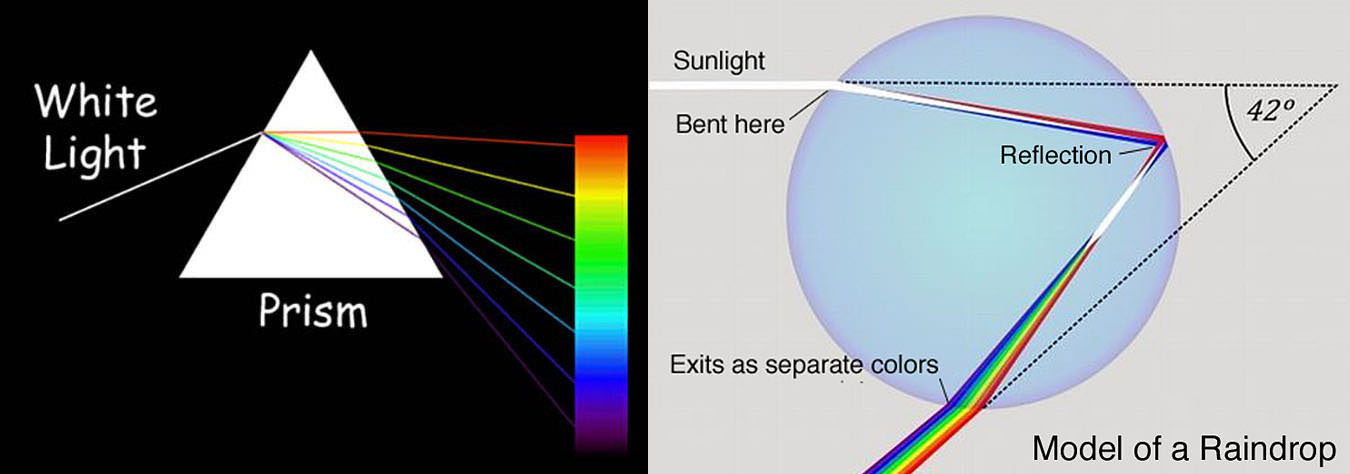
Up to this point, we’ve been talking about white light only, but as we all learned in elementary science, Sir Isaac Newton conducted experiments with prisms in the late 1600s and discovered that white light is comprised of all the colors of the rainbow. It’s no surprise that each of those colors travels at a slightly different speed through a water droplet. Red light interacts only weakly with the electrons of the atoms and is refracted and slowed the least. Shorter wavelength violet light interacts more strongly with the electrons and suffers a greater degree of refraction and slowdown.
Isaac Newton used a prism to separate light into its familiar array of colors. Like a prism, a raindrop refracts incoming sunlight, spreading it into an arc of rainbow colors with a radius of 42. The colors spread out when light enter the drop and then spread out more when they leave and speed up. Left: NASA image, right, public domain with annotations by the author
Rainbows form when billions of water droplets act like miniature prisms and refract sunlight. Violet (the most refracted) shows up at the bottom or inner edge of the arc. Orange and yellow are refracted a bit less than violet and take up the middle of the rainbow. Red light, least affected by refraction, appears along the arc’s outer edge.
Rainbows are often double. The secondary bow results from light reflecting a second time inside the raindrop. When it emerges, the colors are reversed (red on the bottom instead of top), but the order of colors is preserved. Credit: Bob King
Because their speeds through water (and other media) are a set property of light, and since speed determines how much each is bent as they cross from air to water, they always fall in line as Roy G. Biv. Or the reverse order if the light beam reflects twice inside the raindrop before exiting, but the relation of color to color is always preserved. Nature doesn’t and can’t randomly mix up the scheme. As Scotty from Star Trek would say: “You can’t change the laws of physics!”
So to answer Collin’s original question, the colors of light always stay in the same order because each travels at a different speed when refracted at an angle through a raindrop or prism.
Light of different colors have both different wavelengths (distance between successive wave crests) and frequencies. In this diagram, red light has a longer wavelength and more “stretched out” waves compared to purple light of higher frequency. Credit: NASA
Not only does light change its speed when it enters a new medium, its wavelength changes, but its frequency remains the same. While wavelength may be a useful way to describe the colors of light in a single medium (air, for instance), it doesn’t work when light transitions from one medium to another. For that we rely on its frequency or how many waves of colored light pass a set point per second.
Higher frequency violet light crams in 790 trillion waves per second (cycles per second) vs. 390 trillion for red. Interestingly, the higher the frequency, the more energy a particular flavor of light carries, one reason why UV will give you a sunburn and red light won’t.
When a ray of sunlight enters a raindrop, the distance between each successive crest of the light wave decreases, shortening the beam’s wavelength. That might make you think that that its color must get “bluer” as it passes through a raindrop. It doesn’t because the frequency remains the same.
We measure frequency by dividing the number of wave crests passing a point per unit time. The extra time light takes to travel through the drop neatly cancels the shortening of wavelength caused by the ray’s drop in speed, preserving the beam’s frequency and thus color. Click HERE for a further explanation.
Why prisms/raindrops bend and separate light
Before we wrap up, there remains an unanswered question tickling in the back of our minds. Why does light bend in the first place when it shines through water or glass? Why not just go straight through? Well, light does pass straight through if it’s perpendicular to the medium. Only if it arrives at an angle from the side will it get bent. It’s similar to watching an incoming ocean wave bend around a cliff. For a nice visual explanation, I recommend the excellent, short video above.
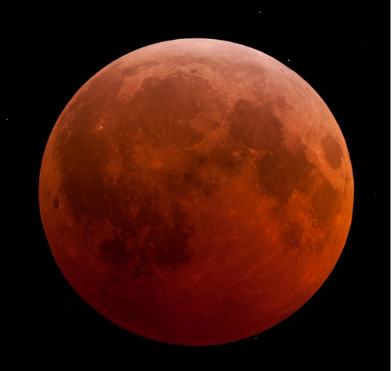
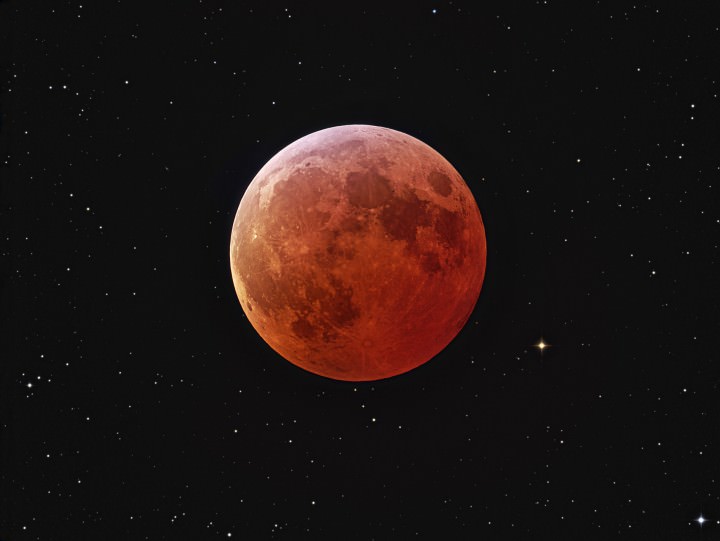
Composite picture of a dark red Moon during a total lunar eclipse. Credit: NASA/ Johannes Schedler (Panther Observatory)
On most evenings, the Moon will appear as a bright yellow or white color in the night sky. But on occasion, the Moon can turn a beautiful and dramatic red, coppery color. Naturally, there are a number of superstitions associated with this stellar event. But to modern astronomers, a Red Moon is just another fascinating phenomenon that has a scientific explanation.
Since the earliest days of recorded history, the Moon has been believed to have a powerful influence over human and animal behavior. To the Romans, staring at a full Moon was thought to drive a person crazy – hence the term “lunatic”. Farmers in the past would plant their crops “by the moon”, which meant sowing their seeds in accordance with the Moon’s phases in the hopes of getting a better harvest.
So naturally, when the Moon turned red, people became wary. According to various Biblical passages, a Blood Moon was thought to be a bad omen. But of course, the Moon turns red on a semi-regular basis, and the world has yet to drown in fire. So what really accounts for a “Red Moon?” What causes Earth’s only satellite to turn the color of blood?
Ordinarily, the Moon appears as it does because it is reflecting light from the Sun. But on occasion, it will darken and acquire either a golden, copper, or even rusty-red color.
There are few situations that can cause a red Moon. The most common way to see the Moon turn red is when the Moon is low in the sky, just after moonrise or before it’s about to set below the horizon. Just like the Sun, light from the Moon has to pass through a larger amount of atmosphere when it’s down near the horizon, compared to when it’s overhead.
The Earth’s atmosphere can scatter sunlight, and since moonlight is just scattered sunlight, it can scatter that too. Red light can pass through the atmosphere and not get scattered much, while light at the blue end of the spectrum is more easily scattered. When you see a red moon, you’re seeing the red light that wasn’t scattered, but the blue and green light have been scattered away. That’s why the Moon looks red.
The second reason for a red Moon is if there’s some kind of particle in the air. A forest fire or volcanic eruption can fill the air with tiny particles that partially obscure light from the Sun and Moon. Once again, these particles tend to scatter blue and green light away, while permitting red light to pass through more easily. When you see a red moon, high up in the sky, it’s probably because there’s a large amount of dust in the air.
Depiction of the Sun’s rays turning the Moon red. Image Credit: NASA/Mars Exploration
A third – and dramatic – way to get a red Moon is during a lunar eclipse. This happens when the Moon is full and passes into Earth’s shadow (also known as the umbra), which darkens it. At that point, the Moon is no longer being illuminated by the Sun. However, the red light passing through the Earth’s atmosphere does reach the Moon, and is thus reflected off of it.
For those observing from the ground, the change in color will again be most apparent when the Moon appears low in the night sky, just after moonrise or before it’s about to set below the horizon. Once again, this is because our heavy atmosphere will scatter away the blue/green light and let the red light go straight through.
The reddish light projected on the Moon is much dimmer than the full white sunlight the Moon typically reflects back to us. That’s because the light is indirect and because the red-colored wavelengths are only a part of what makes up the white light from the sun that the Moon usually receives.
In other words, when you see a red Moon, you’re seeing the result of blue and green light that has been scattered away, and the red light remaining.
Path of the Moon through Earth’s umbral and penumbral shadows during the Total Lunar Eclipse of April 15, 2014. Image Credit: NASA/Eclipse Website
And that’s the various ways how we get a Red Moon in the night sky. Needless to say, our ancient forebears were a little nervous about this celestial phenomenon occurrence.
For example, Revelations 6:12/13 says that a Red Moon is a sign of the apocalypse: “When he opened the sixth seal, I looked, and behold, there was a great earthquake, and the sun became black as sackcloth, the full moon became like blood, and the stars of the sky fell to the earth as the fig tree sheds its winter fruit when shaken by a gale.”
But rest assured that if you see one, it’s not the end of the world. The Sun and Moon will rise again. And be sure to check out this Weekly Space Hangout, where the April 4th eclipse is discussed:
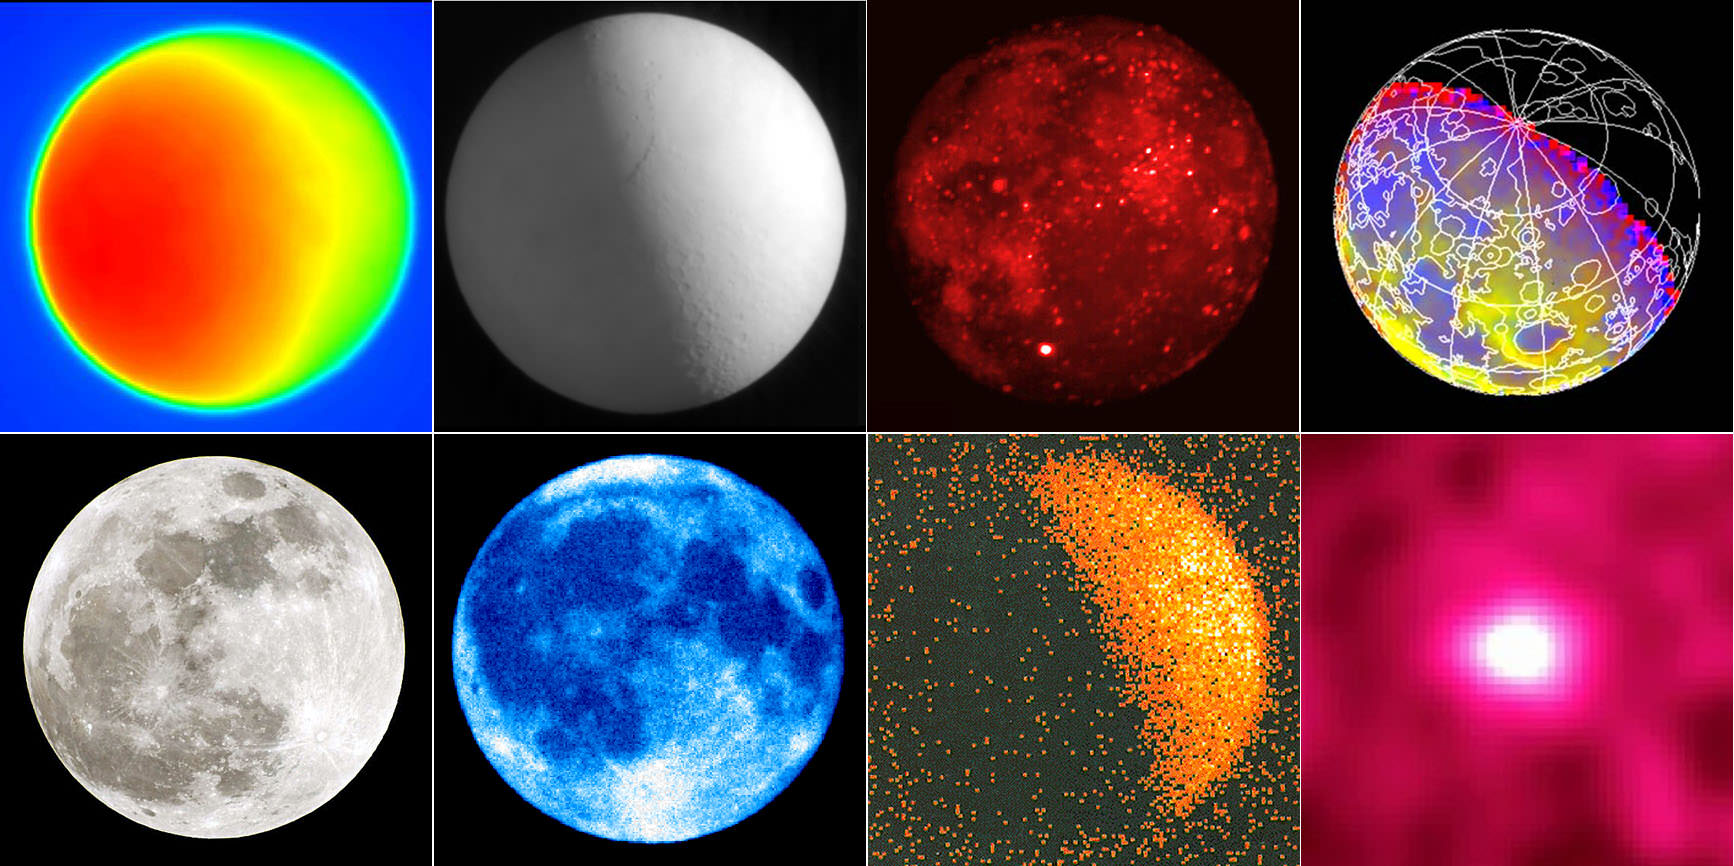
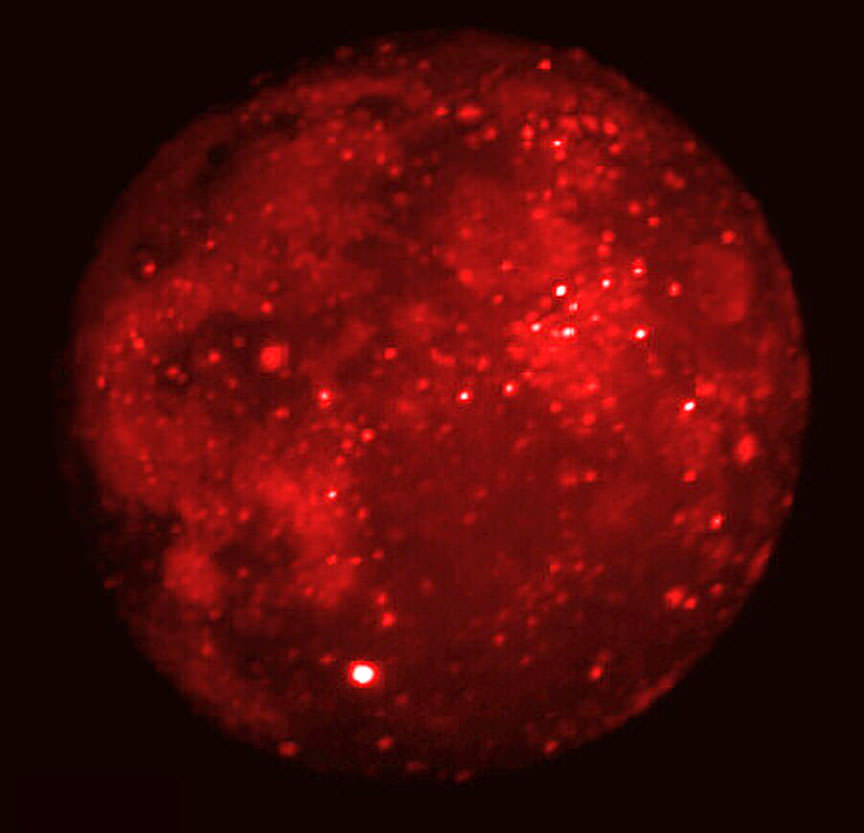
We see the Moon differently depending upon the wavelength in which we view it. Top row from left:
“By the Light of the Silvery Moon” goes the song. But the color and appearance of the Moon depends upon the particular set of eyes we use to see it. Human vision is restricted to a narrow slice of the electromagnetic spectrum called visible light.
With colors ranging from sumptuous violet to blazing red and everything in between, the diversity of the visible spectrum provides enough hues for any crayon color a child might imagine. But as expansive as the visual world’s palette is, it’s not nearly enough to please astronomers’ retinal appetites.
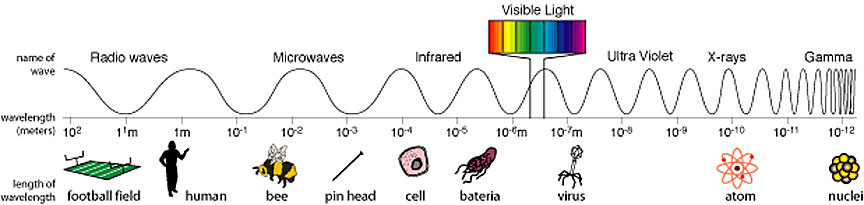
Visible light is a sliver of light’s full range of “colors” which span from kilometers-long, low-energy radio waves (left) to short wavelength, energetic gamma rays. It’s all light, with each color determined by wavelength. Familiar objects along the bottom reference light wave sizes. Visible light waves are about one-millionth of a meter wide. Credit: NASA
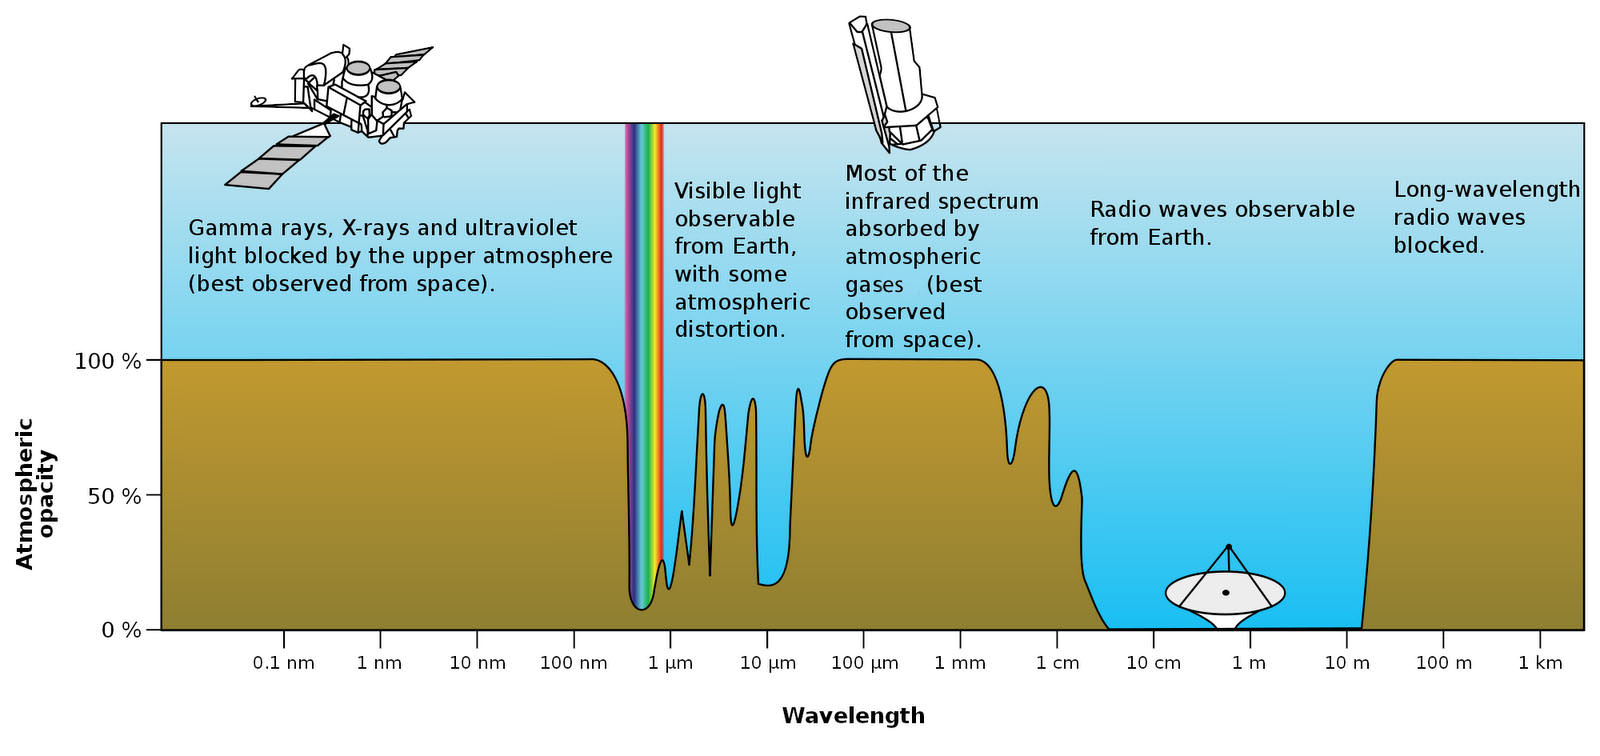
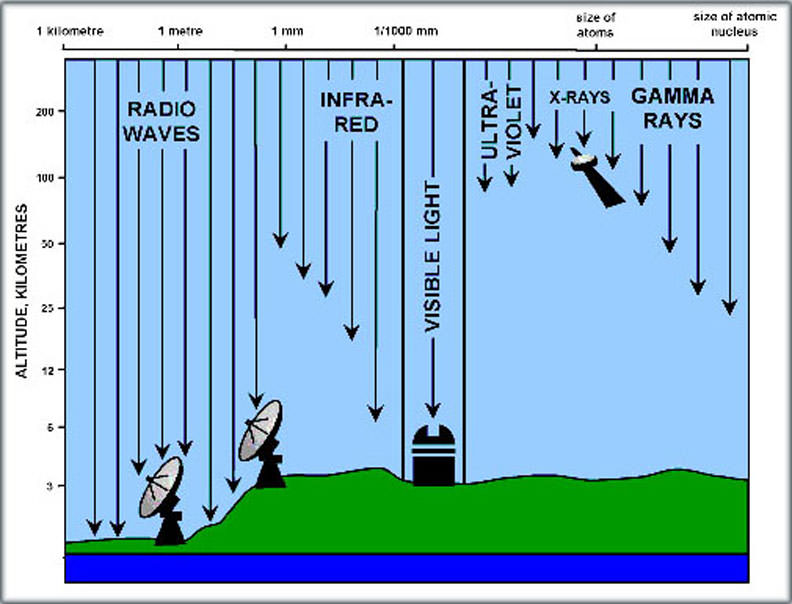
Since the discovery of infrared light by William Herschel in 1800 we’ve been unshuttering one electromagnetic window after another. We build telescopes, great parabolic dishes and other specialized instruments to extend the range of human sight. Not even the atmosphere gets in our way. It allows only visible light, a small amount of infrared and ultraviolet and selective slices of the radio spectrum to pass through to the ground. X-rays, gamma rays and much else is absorbed and completely invisible.
Earth’s atmosphere blocks a good portion of light’s diversity from reaching the ground, the reason we launch rockets and orbiting telescopes into space. Large professional telescopes are often built on mountain tops above much of the denser, lower atmosphere. This expands the viewing “window” into the infrared. Credit: NASA
To peer into these rarified realms, we’ve lofting air balloons and then rockets and telescopes into orbit or simply dreamed up the appropriate instrument to detect them. Karl Jansky’s homebuilt radio telescope cupped the first radio waves from the Milky Way in the early 1930s; by the 1940s sounding rockets shot to the edge of space detected the high-frequency sizzle of X-rays. Each color of light, even the invisible “colors”, show us a new face on a familiar astronomical object or reveal things otherwise invisible to our eyes.
So what new things can we learn about the Moon with our contemporary color vision?
Radio Moon
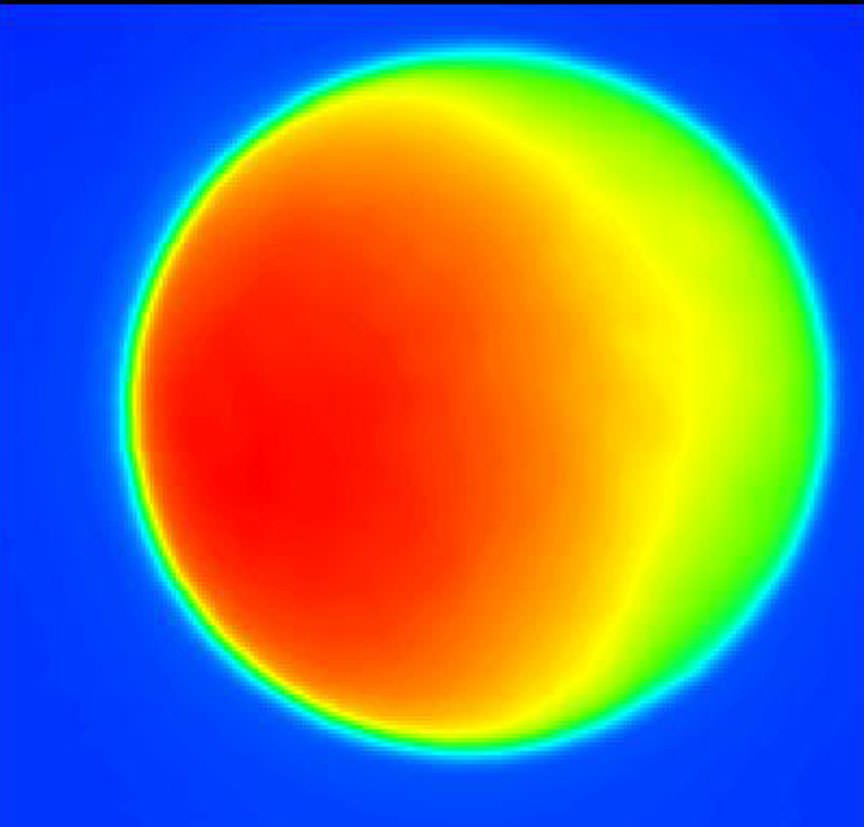
Radio: Made using NRAO’s 140-ft telescope in Green Bank, West Virginia. Blues and greens represent colder areas of the moon and reds are warmer regions. The left half of Moon was facing the Sun at the time of the observation. The sunlit Moon appear brighter than the shadowed portion because it radiates more heat (infrared light) and radio waves.
Submillimeter Moon
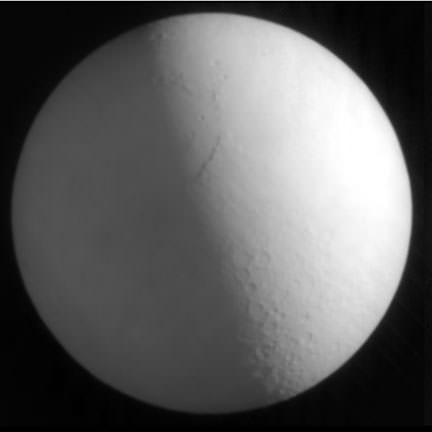
Submillimeter: Taken using the SCUBA camera on the James Clerk Maxwell Telescope in Hawaii. Submillimeter radiation lies between far infrared and microwaves. The Moon appears brighter on one side because it’s being heated by Sun in that direction. The glow comes from submillimeter light radiated by the Moon itself. No matter the phase in visual light, both the submillimeter and radio images always appear full because the Moon radiates at least some light at these wavelengths whether the Sun strikes it or not.
Mid-infrared Moon
Mid-infrared: This image of the Full Moon was taken by the Spirit-III instrument on the Midcourse Space Experiment (MSX) at totality during a 1996 lunar eclipse. Once again, we see the Moon emitting light with the brightest areas the warmest and coolest regions darkest. Many craters look like bright dots speckling the lunar disk, but the most prominent is brilliant Tycho near the bottom. Research shows that young, rock-rich surfaces, such as recent impact craters, should heat up and glow more brightly in infrared than older, dust-covered regions and craters. Tycho is one of the Moon’s youngest craters with an age of just 109 million years.
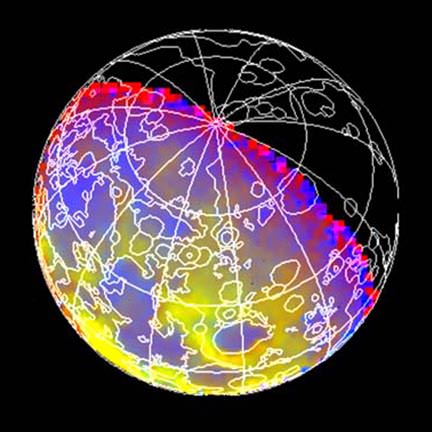
Near-infrared Moon
Near-infrared: This color-coded picture was snapped just beyond the visible deep red by NASA’s Galileo spacecraft during its 1992 Earth-Moon flyby en route to Jupiter. It shows absorptions due to different minerals in the Moon’s crust. Blue areas indicate areas richer in iron-bearing silicate materials that contain the minerals pyroxene and olivine. Yellow indicates less absorption due to different mineral mixes.
Visible light Moon
Visible light: Unlike the other wavelengths we’ve explored so far, we see the Moon not by the light it radiates but by the light it reflects from the Sun.
The iron-rich composition of the lavas that formed the lunar “seas” give them a darker color compared to the ancient lunar highlands, which are composed mostly of a lighter volcanic rock called anorthosite.
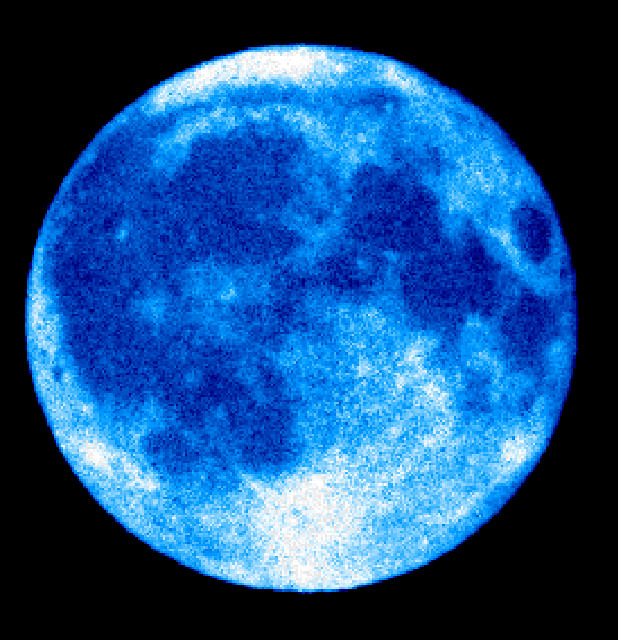
UV Moon
Ultraviolet: Similar to the view in visible light but with a lower resolution. The brightest areas probably correspond to regions where the most recent resurfacing due to impacts has occurred. Once again, the bright rayed crater Tycho stands out in this regard. The photo was made with the Ultraviolet Imaging Telescope flown aboard the Space Shuttle Endeavour in March 1995.
X-ray Moon
X-ray: The Moon, being a relatively peaceful and inactive celestial body, emits very little x-ray light, a form of radiation normally associated with highly energetic and explosive phenomena like black holes. This image was made by the orbiting ROSAT Observatory on June 29, 1990 and shows a bright hemisphere lit by oxygen, magnesium, aluminum and silicon atoms fluorescing in x-rays emitted by the Sun. The speckled sky records the “noise” of distant background X-ray sources, while the dark half of the Moon has a hint of illumination from Earth’s outermost atmosphere or geocorona that envelops the ROSAT observatory.
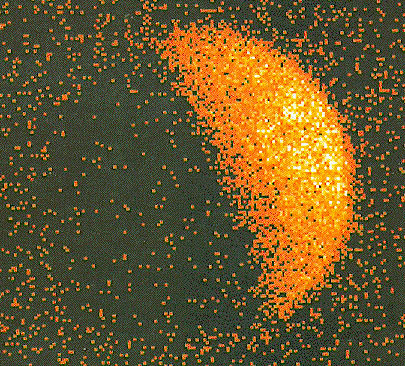
Gamma ray Moon
Gamma rays: Perhaps the most amazing image of all. If you could see the sky in gamma rays the Moon would be far brighter than the Sun as this dazzling image attempts to show. It was taken by the Energetic Gamma Ray Experiment Telescope (EGRET). High-energy particles (mostly protons) from deep space called cosmic rays constantly bombard the Moon’s surface, stimulating the atoms in its crust to emit gamma rays. These create a unique high-energy form of “moonglow”.
Astronomy in the 21st century is like having a complete piano keyboard on which to play compared to barely an octave a century ago. The Moon is more fascinating than ever for it.
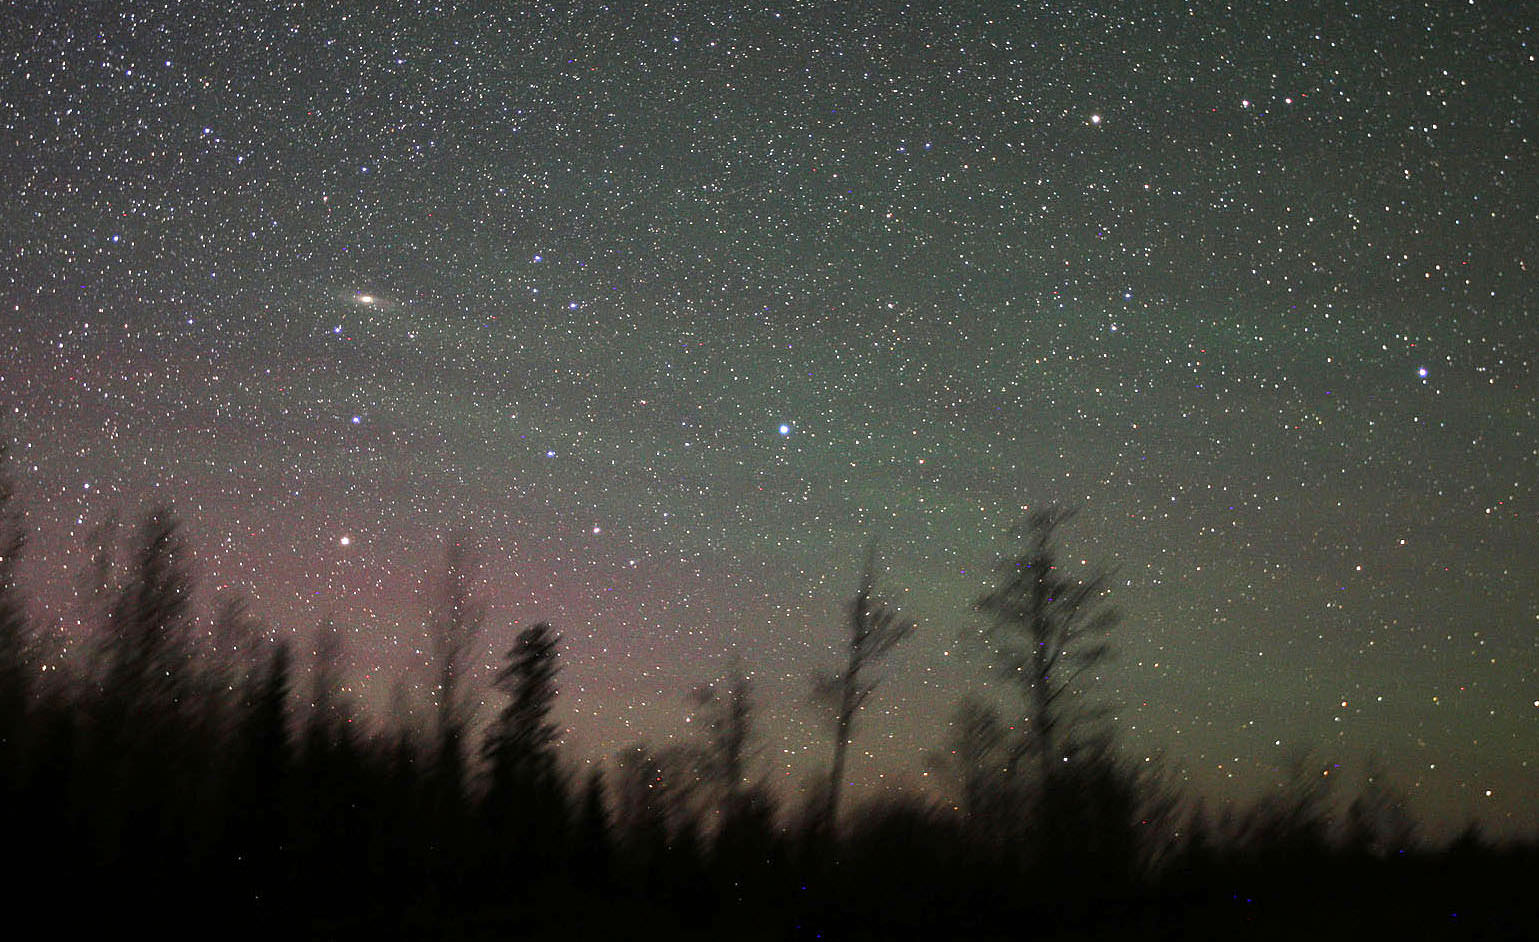
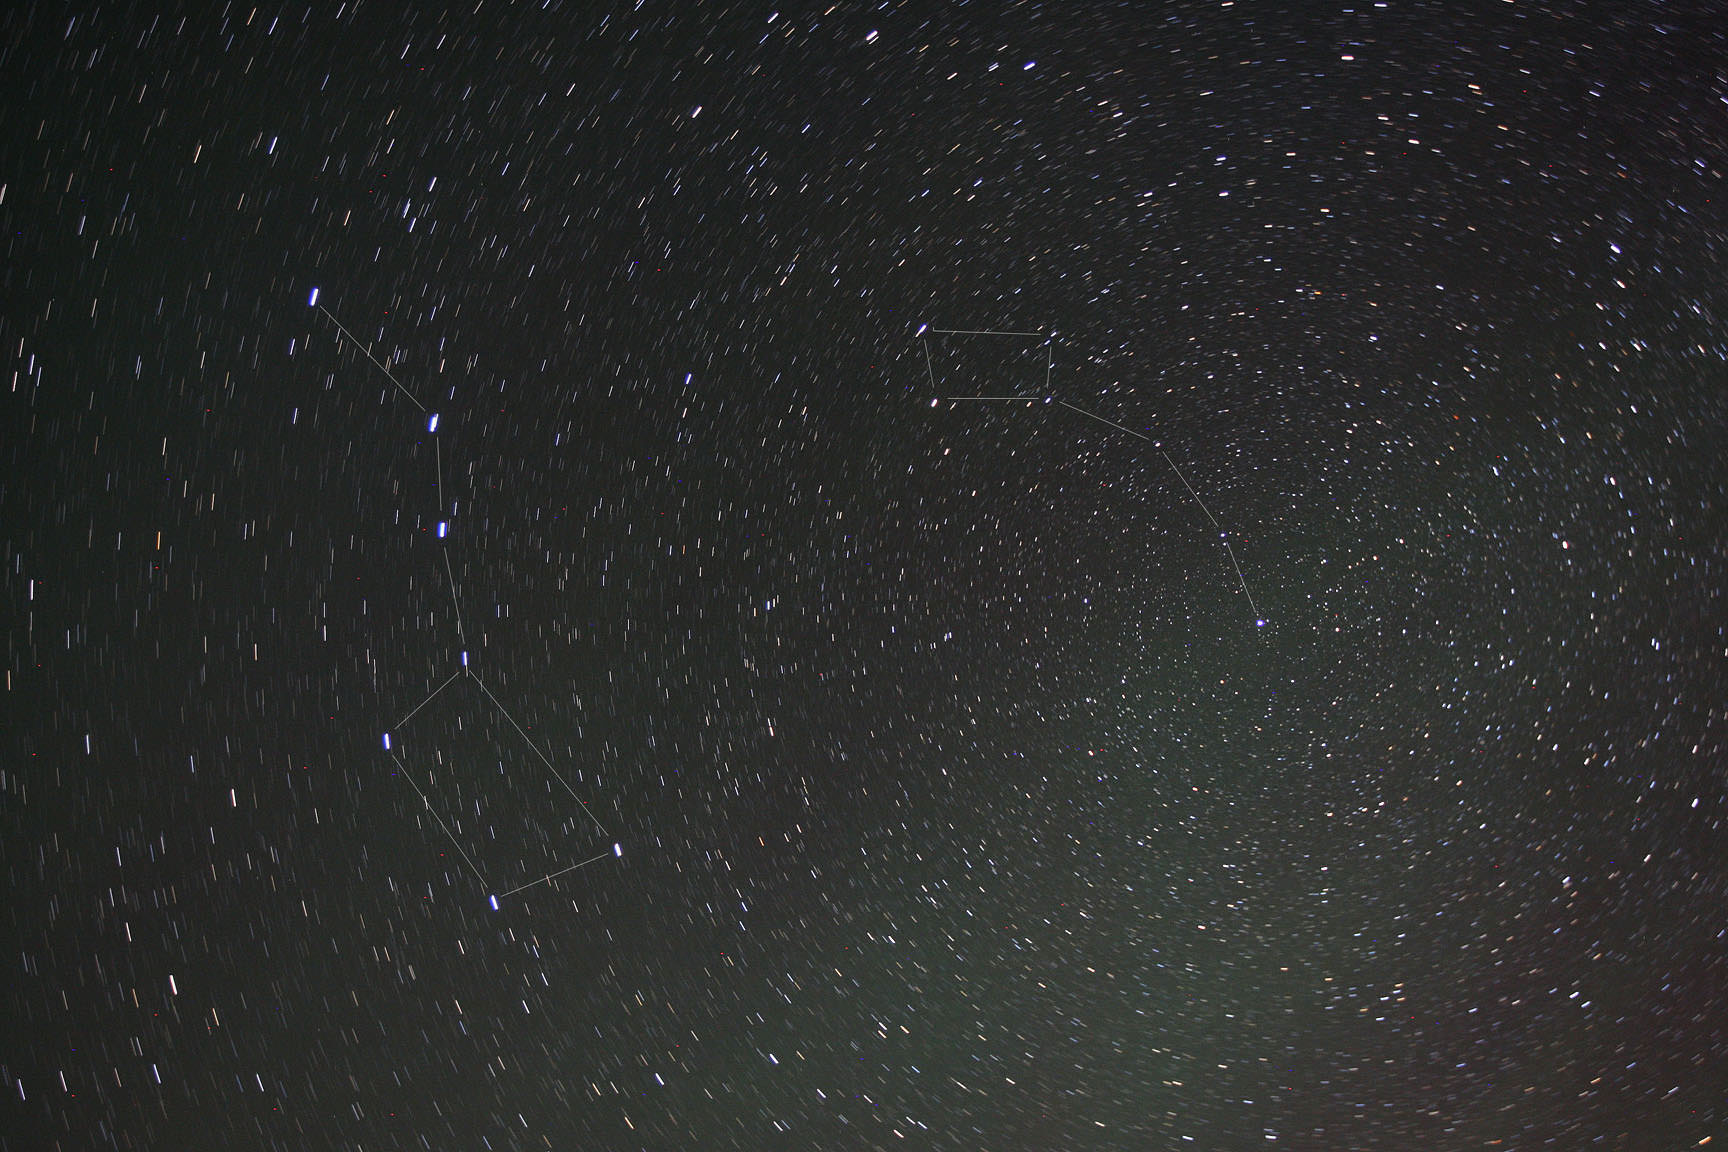
Airglow shows as wavy stripes of pale green across the northeastern sky on May 24, 2014. Andromeda Galaxy at left. the banding was faintly visible with the naked eye as a soft, diffuse glow. The red glow at lower left is airglow from atomic oxygen 90-185 miles up. Details: 20mm lens, ISO 3200, 30". Credit: Bob King
Emerald green, fainter than the zodiacal light and visible on dark nights everywhere on Earth, airglow pervades the night sky from equator to pole. Airglow turns up in our time exposure photographs of the night sky as ghostly ripples of aurora-like light about 10-15 degrees above the horizon. Its similarity to the aurora is no coincidence. Both form at around the same altitude of 60-65 miles (100 km) and involve excitation of atoms and molecules, in particular oxygen. But different mechanisms tease them to glow.
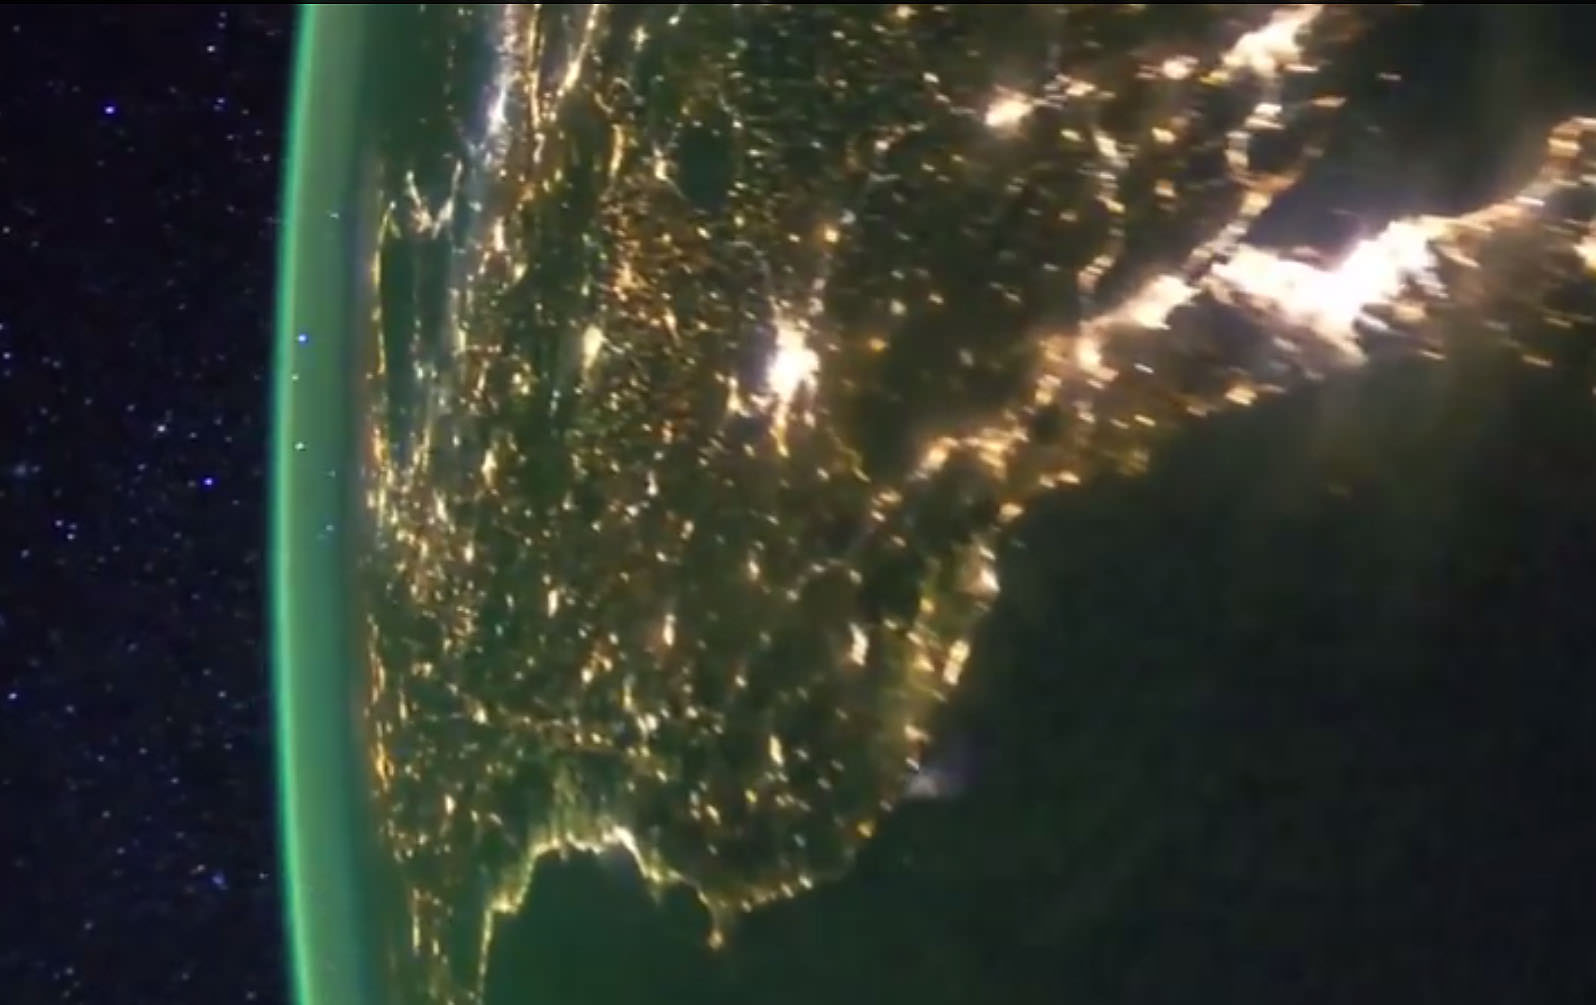
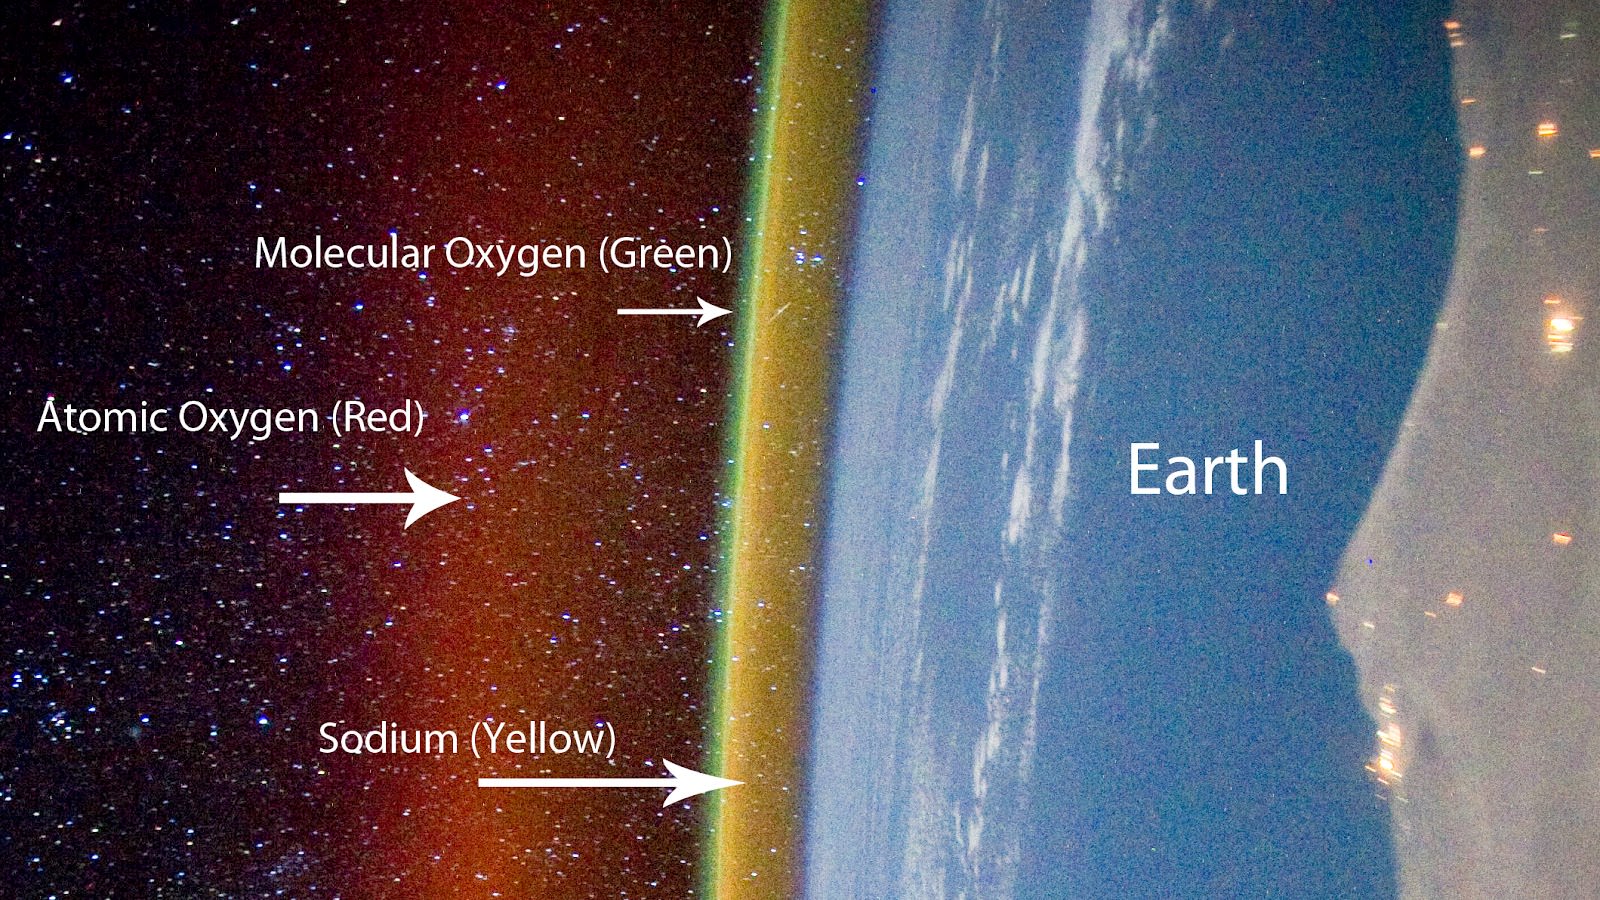
Earth at night from the International Space Station showing bright splashes of city lights and the airglow layer created by light-emitting oxygen atoms some 60 miles high in the atmosphere. This green cocoon of light is familiar to anyone who’s looked at photos of Earth’s night-side from orbit. Credit: NASA
Auroras get their spark from high-speed electrons and protons in the solar wind that bombard oxygen and nitrogen atoms and molecules. As excited electrons within those atoms return to their rest states, they emit photons of green and red light that create shimmering, colorful curtains of northern lights.
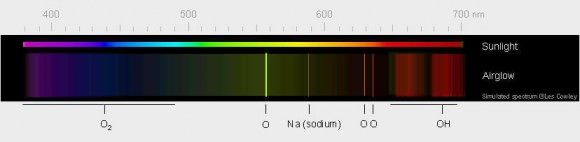
Green light from excited oxygen atoms dominates the light of airglow. The atoms are 56-62 miles high in the thermosphere. The weaker red light is from oxygen atoms further up. Sodium atoms, hydroxyl radicals (OH) and molecular oxygen add their own complement to the light. Credit: Les Cowley
Airglow’s subtle radiance arises from excitation of a different kind. Ultraviolet light from the daytime sun ionizes or knocks electrons off of oxygen and nitrogen atoms and molecules; at night the electrons recombine with their host atoms, releasing energy as light of different colors including green, red, yellow and blue. The brightest emission, the one responsible for creating the green streaks and bands visible from the ground and orbit, stems from excited oxygen atoms beaming light at 557.7 nanometers, smack in the middle of the yellow-green parcel of spectrum where our eyes are most sensitive.
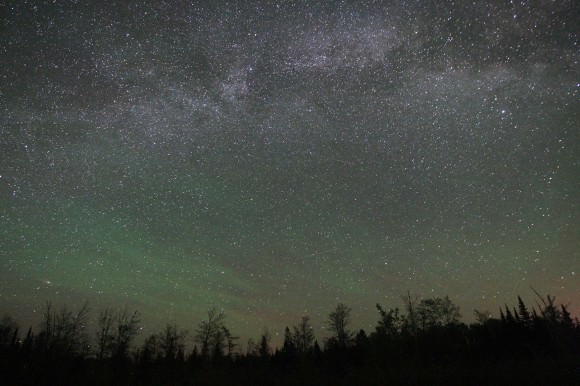
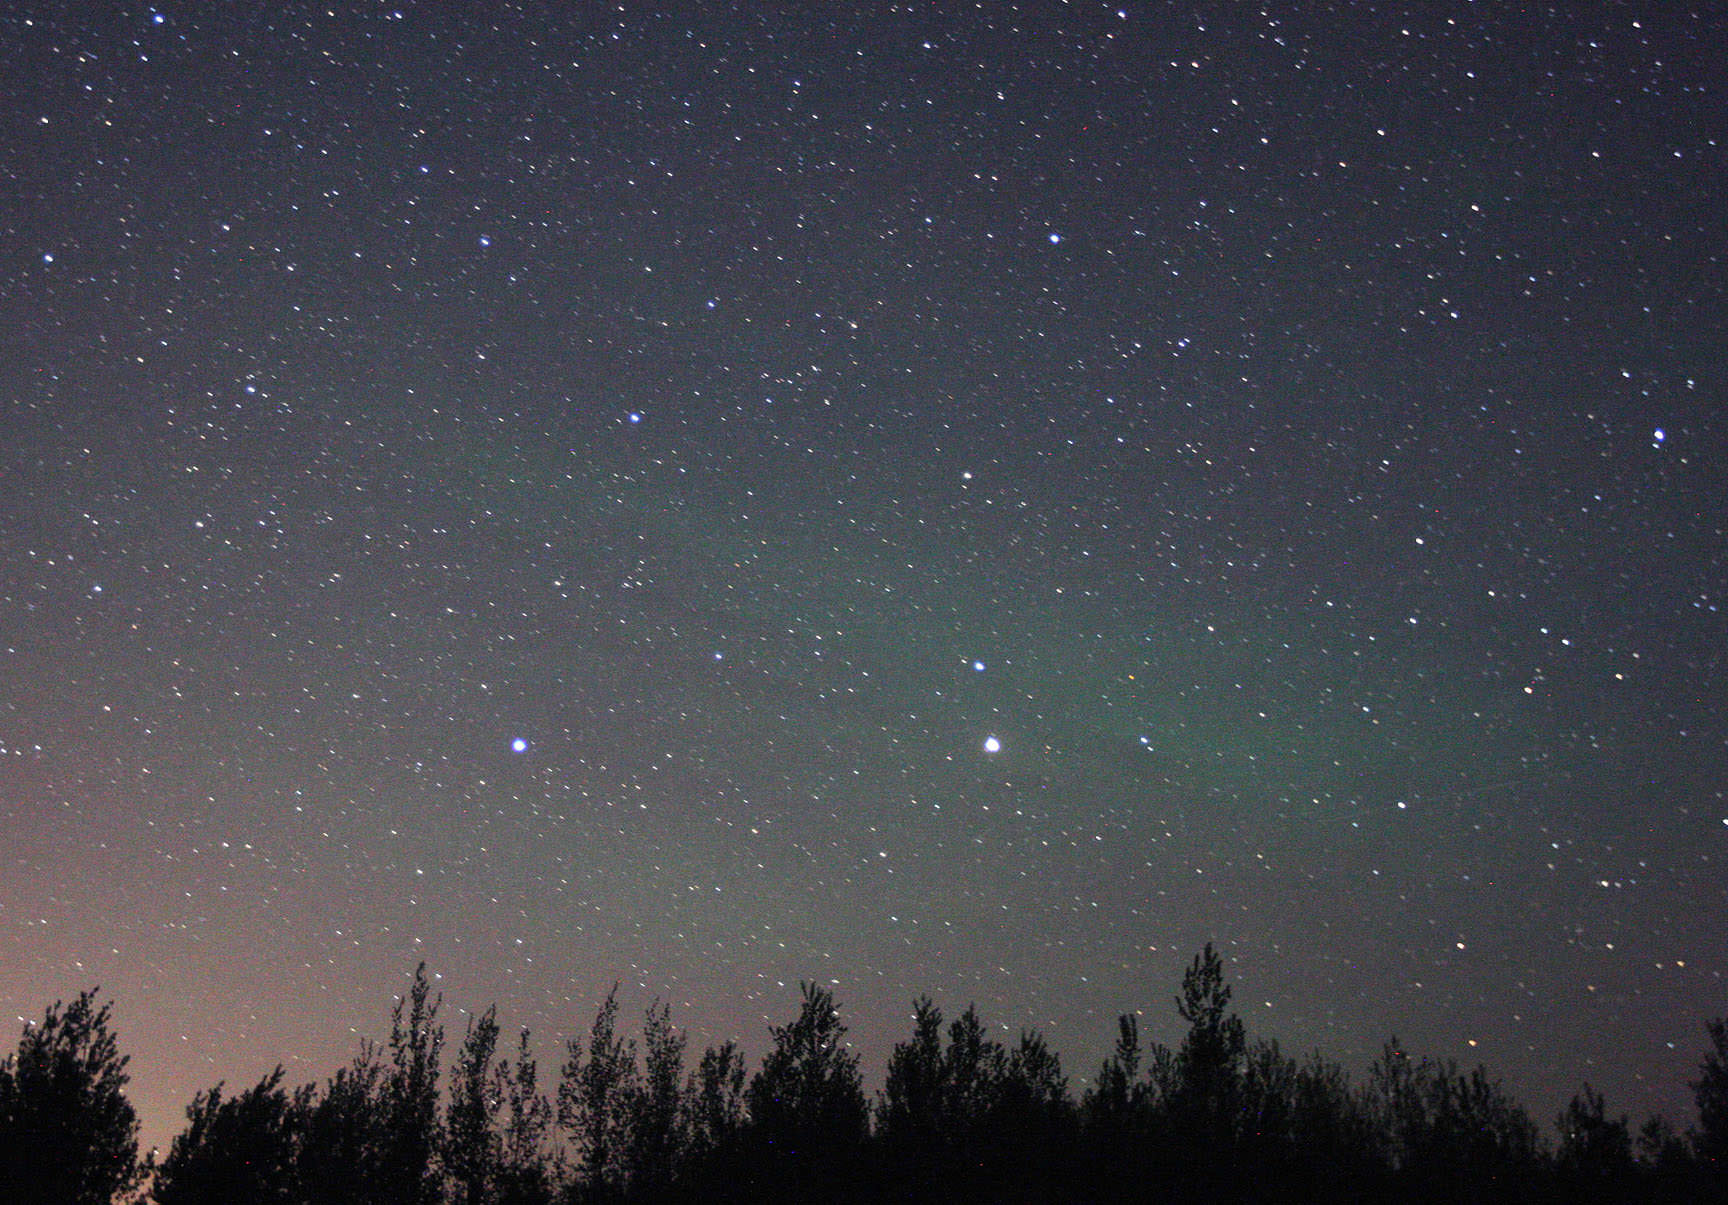
Airglow across the eastern sky below the summertime Milky Way. Notice that unlike the vertical rays and gently curving arcs of the aurora, airglow is banded, streaky and in places almost fibrous. It’s brightest and best visible 10-15 degrees high along a line of sight through the thicker atmosphere. If you look lower, its feeble light is absorbed by denser air and dust. Looking higher, the light spreads out over a greater area and appears dimmer. Credit: Bob KingA large, faint patch of airglow below the Dippers photographed May 24. To the eye, airglow appears as colorless streaks and patches. Unlike the aurora, it’s typically too faint to excite our color vision. Time exposures show its colors well. This swatch is especially faint because it’s much higher above the horizon. Credit: Bob King
That’s not saying airglow is easy to see! For years I suspected streaks of what I thought were high clouds from my dark sky observing site even when maps and forecasts indicated pristine skies. Photography finally taught me to trust my eyes. I started noticing green streaks near the horizon in long-exposure astrophotos. At first I brushed it off as camera noise. Then I noticed how the ghostly stuff would slowly shape-shift over minutes and hours and from night to night. Gravity waves created by jet stream shear, wind flowing over mountain ranges and even thunderstorms in the lower atmosphere propagate up to the thermosphere to fashion airglow’s ever-changing contours.
An obvious airglow smear across Virgo last month. Mars is the bright object below and right of center. Light pollution from Duluth, Minn. creeps in at lower left. Credit: Bob King
Last month, on a particularly dark night, I made a dedicated sweep of the sky after my eyes had fully adapted to the darkness. A large swath of airglow spread south of the Big and Little Dipper. To the east, Pegasus and Andromeda harbored hazy spots of varying intensity, while brilliant Mars beamed through a long smear in Virgo.
To prove what I saw was real, I made the photos you see in this article and found they exactly matched my visual sightings. Except for color. Airglow is typically too faint to fire up the cone cells in our retinas responsible for color vision. The vague streaks and patches were best seen by moving your head around to pick out the contrast between them and the darker, airglow-free sky. No matter what part of the sky I looked, airglow poked its tenuous head. Indeed, if you were to travel anywhere on Earth, airglow would be your constant companion on dark nights, unlike the aurora which keeps to the polar regions. Warning – once you start seeing it, you
Excited oxygen at higher altitude creates a layer of faint red airglow. Sodium excitation forms the yellow layer at 57 miles up. Airglow is brightest during daylight hours but invisible against the sunlight sky. Credit: NASA with annotations by Alex Rivest
Airglow comes in different colors – let’s take a closer look at what causes them:
* Red – I’ve never seen it, but long-exposure photos often reveal red/pink mingled with the more common green. Excited oxygen atoms much higher up at 90-185 miles (150-300 km) radiating light at a different energy state are responsible. Excited -OH (hydroxyl) radicals give off deep red light in a process called chemoluminescencewhen they react with oxygen and nitrogen. Another chemoluminescent reaction takes place when oxygen and nitrogen molecules are busted apart by ultraviolet light high in the atmosphere and recombine to form nitric oxide (NO).
* Yellow – From sodium atoms around 57 miles (92 km) high. Sodium arrives from the breakup and vaporization of minerals in meteoroids as they burn up in the atmosphere as meteors.
* Blue – Weak emission from excited oxygen molecules approximately 59 miles (95 km) high.
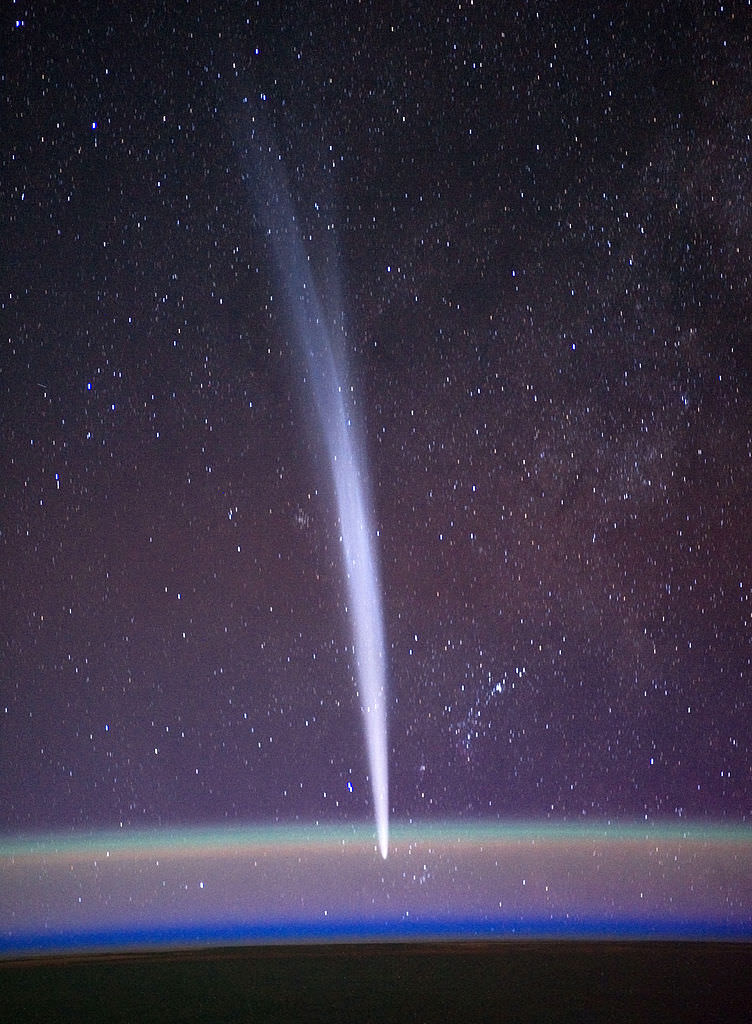
Comet Lovejoy passing behind green oxygen and sodium airglow layers on December 22, 2011 seen from the space station. Credit: NASA/Dan Burbank
Airglow varies time of day and night and season, reaching peak brightness about 10 degrees, where our line of sight passes through more air compared to the zenith where the light reaches minimum brightness. Since airglow is brightest around the time of solar maximum (about now), now is an ideal time to watch for it. Even cosmic rays striking molecules in the upper atmosphere make a contribution.
See lots of airglow and aurora from orbit in this video made using images taken from the space station.
If you removed the stars, the band of the Milky Way and the zodiacal light, airglow would still provide enough illumination to see your hand in front of your face at night. Through recombination and chemoluminescence, atoms and molecules creates an astounding array of colored light phenomena. We can’t escape the sun even on the darkest of nights.
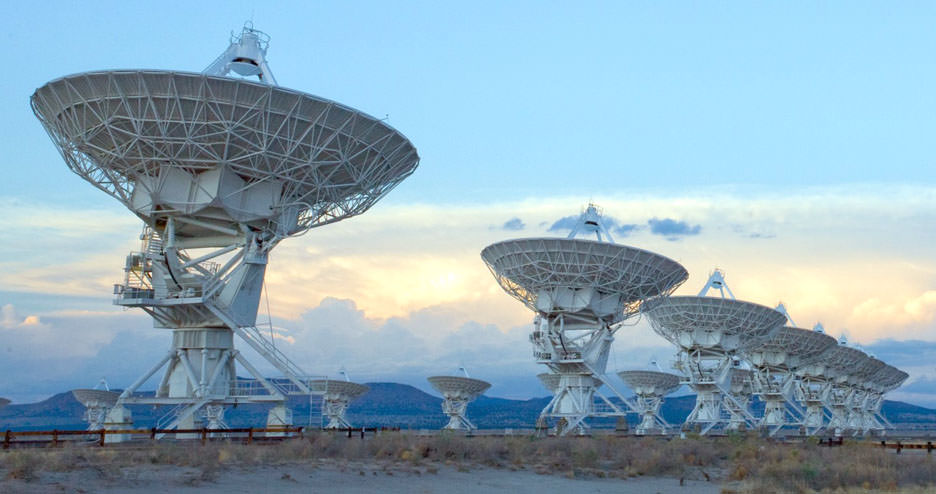
The Very Large Array, one of the world's premier astronomical radio observatories, consists of 27 radio antennas in a Y-shaped configuration 50 miles west of Socorro, New Mexico. Each antenna is 82 feet (25 m) in diameter. The data from the antennas is combined electronically to give the resolution of an antenna 22 miles (36 km) across. Image courtesy of NRAO/AUI and NRAO
Thanks to Channel 37, radio astronomers keep tabs on everything from the Sun to pulsars to the lonely spaces between the stars. This particular frequency, squarely in the middle of the UHF TVbroadcast band, has been reserved for radio astronomy since 1963, when astronomers successfully lobbied the FCC to keep it TV-free.
Back then UHF TV stations were few and far between. Now there are hundreds, and I’m sure a few would love to soak up that last sliver of spectrum. Sorry Charley, the moratorium is still in effect to this day. Not only that, but it’s observed in most countries across the world.
Channel 37, a slice of the radio spectrum from 608 and 614 Megahertz (MHz) reserved for radio astronomy, sits in the middle of the UHF TV band. Click to see the full spectrum. Credit: US Dept. of Commerce
So what’s so important about Channel 37? Well, it’s smack in the middle of two other important bands already allocated to radio astronomy – 410 Megahertz (MHz) and 1.4 Gigahertz (Gz). Without it, radio astronomers would lose a key window in an otherwise continuous radio view of the sky. Imagine a 3-panel bay window with the middle pane painted black. Who wants THAT?
The visible colors, infrared, radio, X-rays and gamma rays are all forms of light and comprise the electromagnetic spectrum. Here you can compare their wavelengths with familiar objects and see how their frequencies (bottom numbers) increase with decreasing wavelength. Credit: ESA
Channel 37 occupies a band spanning from 608-614 MHz. A word about Hertz. Radio waves are a form of light just like the colors we see in the rainbow or the X-rays doctors use to probe our bones. Only difference is, our eyes aren’t sensitive to them. But we can build instruments like X-ray machines and radio telescopes to “see” them for us.
Diagram showing what how Earth’s atmosphere allows visible light, a portion of infrared and radio light to reach the ground from outer space but filters shorter-wavelength, more dangerous forms of light like X-rays and gamma rays. To study the cosmos in these varieties of light, orbiting telescopes are required.
Every color of light has a characteristic wavelength and frequency. Wavelength is the distance between successive crests in a light wave which you can visualize as a wave moving across a pond. Waves of visible light range from one-millionth to one-billionth of a meter, comparable to the size of a virus or DNA molecule.
X-rays crests are jammed together even more tightly – one X-ray is only as big as an small atom. Radio waves fill out the opposite end of the spectrum with wavelengths ranging from baseball-sized to more than 600 miles (1000 km) long.
The frequency of a light wave is measured by how many crests pass a given point over a given time. If only one crest passes that point every second, the light beam has a frequency of 1 cycle per second or 1Hertz. Blue light has a wavelength of 462 billionths of a meter and frequency of 645 trillion Hertz (645 Terahertz).
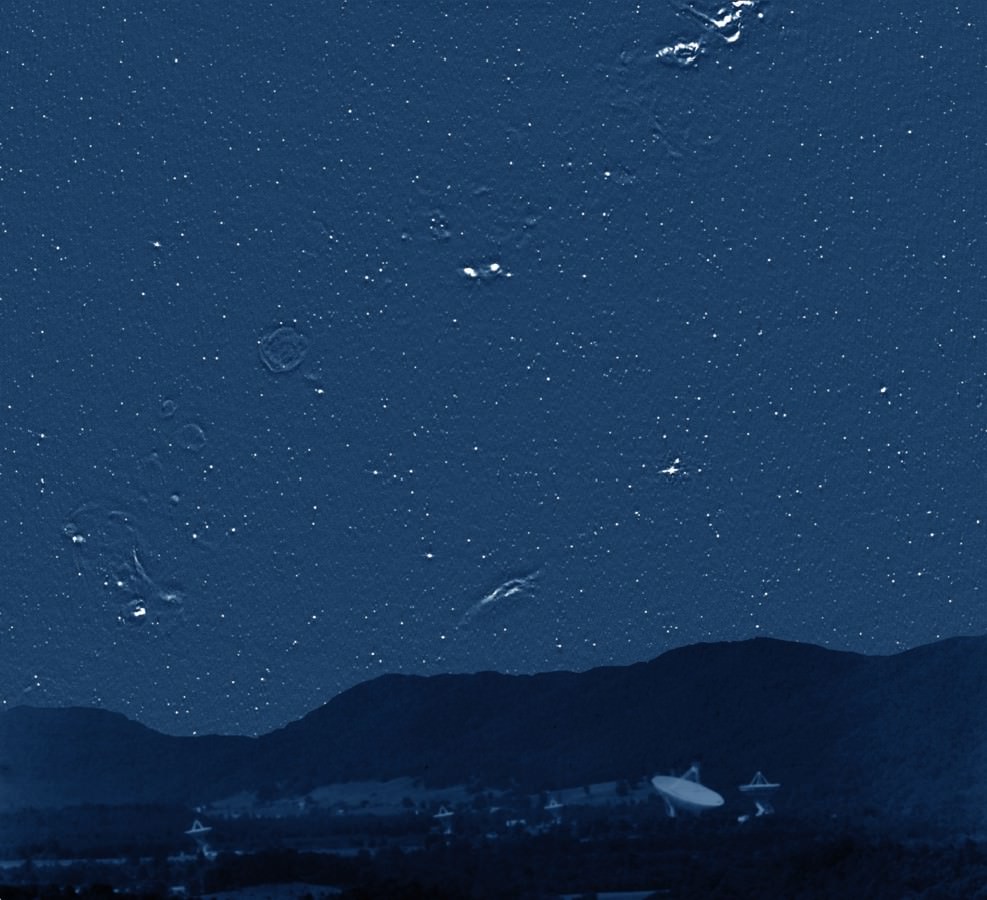
If our eyes could see radio light, this is what the sky would look like. What appear to be stars are actually distant galaxies glowing brightly with energy radiated as matter gets sucked down black holes in the cores. The wispy arcs and shells are the remnants of exploding supernovae. Since air molecules don’t scatter radio waves like they do visible light to create a blue sky, the sky would be dark even on a sunny day. Credit: National Science Foundation
The higher the frequency, the greater the energy the light carries. X-rays have frequencies starting around 30 quadrillion Hertz (30 petahertz or 30 PHz), enough juice to damage body cells if you get too much exposure. Even ultraviolet light has power to burn skin as many of us who’ve spent time outdoors in summer without sunscreen are aware.
Radio waves are the gentle giants of the electromagnetic spectrum. Their enormous wavelengths mean low frequencies. Channel 37 radio waves have more modest frequencies of around 600 million Hertz (MHz), while the longest radio waves deliver crests almost twice the width of Lake Superior at a rate of 3 to 300 Hertz.
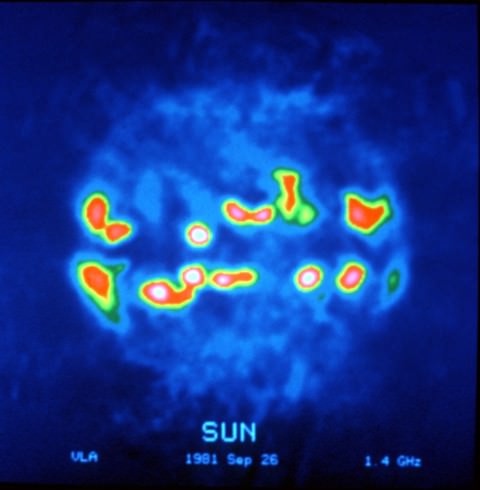
The sun as it would look in the radio portion of the spectrum at a frequency of 1.4 gigahertz (GHz). Image courtesy of the National Radio Astronomy Observatory (NRAO/AUI)
If Channel 37 were ever lost to TV, the gap would mean a loss of information about the distribution of cosmic rays in the Milky Way galaxy and rapidly rotating stars called pulsars created in the wake of supernovae. Closer to home, observations in the 608-614 MHz band allow astronomers track bursts of radio energy produced by particles blasted out by solar flares traveling through the sun’s outer atmosphere. Some of these can have powerful effects on Earth. No wonder astronomers want to keep this slice of the electromagnetic spectrum quiet. For more details on how useful this sliver is to radio astronomy, click HERE.
Just as optical astronomers seek the darkest sites for their telescopes to probe the most remote corners of the universe, so too does radio astronomy need slices of silence to listen to the faintest whispers of the cosmos.
In terms of physics, absorption is defined as the way that energy from photons is taken up by matter, and transformed into other forms of energy, like heat. All of the light in the electromagnetic spectrum is made up of photons at different energy levels. Radio waves are photons with lower amounts of energy, and gamma rays are photons with very high levels of energy. When a photon strikes matter, it can either be reflected or absorbed by the material. And if it is absorbed, the energy of the photon is transformed into heat.
The absorbance of an object is a measure of what percentage of the electromagnetic radiation it’s likely to absorb. Transparent or reflective objects absorb much less than opaque, black objects.
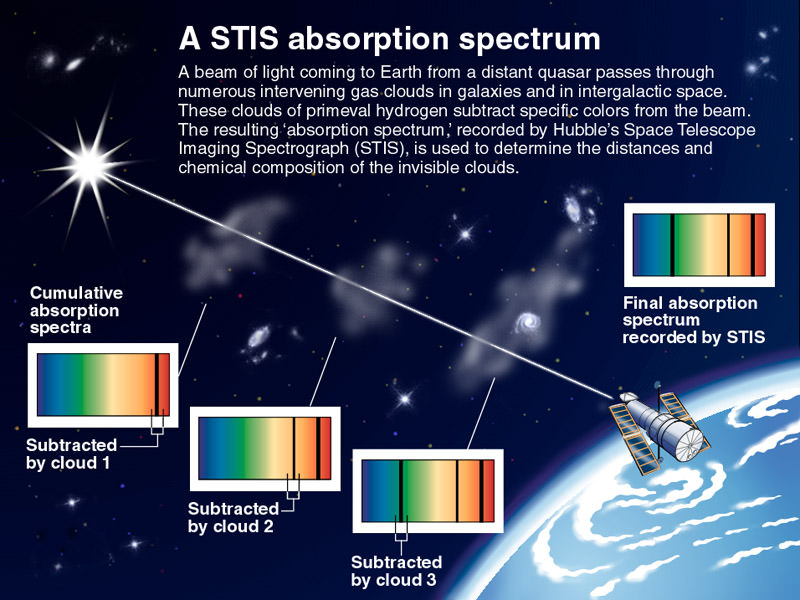
This concept is very important to astronomers, who are able to measure which wavelengths of light are being absorbed by an object or cloud of gas, to get an idea of what it’s made of. When you put the light from a star through a prism, you get a spectrum of the light coming from that star. But in some spectra, there are blank lines, gaps where no photons of a specific wavelength are being emitted. This means that some intervening object is absorbing all of the photons of this wavelength.
For example, imagine looking at how the light from a star passes through a planet’s atmosphere which is rich in sodium. This sodium will absorb photons at a specific wavelength, creating gaps in the spectrum from the light of the star. By comparing these gaps to the absorption line pattern of known gasses, astronomers can work out what’s in the planet’s atmosphere. This general method is used in many ways by astronomers to learn what distant objects are made out of.
The opposite of absorption is emission. This is where different elements will release photons when they’re heated. Different elements will release photons at different levels of energy, and their colors on the electromagnetic spectrum help astronomers discover what elements the object is made out of. When iron is heated, it releases photons in a very specific pattern, different from the pattern released by oxygen.
Both the absorption and emission serve as a fingerprint to help astronomers understand what the Universe is made out of.
We have written many articles about Absorption Spectroscopy for Universe Today. Here’s an article about amateur spectroscopy, and here’s an article about the light spectrum.
If you’d like more info on Absorption Spectroscopy, check out the Principles of Spectroscopy, and the Infrared Spectroscopy Page.
Light spectrum can mean the visible spectrum, the range of wavelengths of electromagnetic radiation which our eyes are sensitive to … or it can mean a plot (or chart or graph) of the intensity of light vs its wavelength (or, sometimes, its frequency). More possible ambiguity: ‘light’ … which can refer to what we see, or to the part of the electromagnetic spectrum that optical telescopes (especially the ones down here on the ground) work in (and sometimes, just occasionally, it means the whole of the electromagnetic spectrum, or any electromagnetic radiation). Good news: the context makes it clear!
The realization that visible light is made up of colors is most often attributed to Isaac Newton (though a strong case can be made that it was known well before him), who used a prism to create a spectrum (rainbow of colors) from a beam of white light, and another to recombine them back into white light. And what’s it called when you spread light into a spectrum, for the purpose of studying it (in astronomy, chemistry, …)? Spectroscopy. And is there a different word if it’s infrared, ultraviolet, x-rays, … which are spread into a spectrum (rather than visible light)? Nope, it’s still spectroscopy.
Visible light ranges from about 380 nanometers (nm) to about 750 nm (or, as is still common in astronomy, ~3800 angstroms (Å) to ~7500 Å); the window in the Earth’s atmosphere which allows us to do astronomy from down here on its surface (and lets the light of the Sun through, so we can see!) is a bit wider than the visible spectrum; it goes from about 300 nm to about 1100 nm (or 1.1 µ).
To an astronomer, a light spectrum has two main components, the continuum and the lines (sometimes bands as well). The lines are discrete wavelengths (well, they do have some ‘width’, hence ‘narrow lines’ and ‘broad lines’), either emission or absorption, and correspond to a particular atomic transition (an electron jumps between one allowed energy level in an atom, or ion, and another; bands are the same thing, except for molecules … and the allowed states are either vibrational or rotational). And the continuum? Well, it’s the part that isn’t lines! It varies smoothly, and generally slowly, across the spectrum.
Spectroscopy – analysis of the light spectrum – is one of the most powerful tools astronomers use to work out what’s going on, and what it’s like, way out there where the light from the sky originates. Do you know why? If not, then these two NASA webpages will help! Visible Light Waves , and Electromagnetic Spectrum.
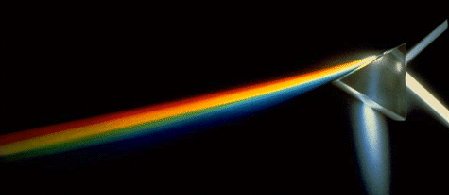
Sunlight passing through a prism. Image credit: NASA
[/caption]
Of all the wavelengths in the electromagnetic spectrum, those that lie between 400 nm to 700 nm are the ones most familiar to us. That’s because these are the waves that comprise what we call visible light.
When we see objects, it’s because they’re being illuminated by visible light. When we see that the sky is blue, or the grass is green, or hair black, or that an apple is red, that’s because we’re seeing different wavelengths within the 400nm-700nm band. Because of the waves in this band, a lot has been learned about the properties of electromagnetic waves.
Through visible light, reflection & refraction are easily observed. So are interference and diffraction. Mirrors, lenses, prisms, diffraction gratings, and spectrometers have all been put to use to understand and manifest the qualities of the light that we see through our naked eyes.
Galileo’s telescope, which was composed of a simple set of lenses, made use of the refractive properties of light to magnify distant objects. Today’s binoculars and periscopes capitalize on the optical phenomenon called Total Internal Reflection by using prisms to improve on what early refractive telescopes were capable of achieving.
As mentioned earlier, visible light is made up of the wavelengths that range from 400 nm to 700 nm. Each wavelength is characterized by a unique color, with violet on one end (adjacent to ultraviolet light) and red on the other (adjacent to infrared light). When all these wavelengths are combined together, they make up what is known as white light.
You can separate these wavelengths (and the corresponding colors) by letting them pass through either a prism or a diffraction grating. The magnificent array of colors that we see in a rainbow, on a diamond, or even a peacock’s tail are examples of this separation.
All phenomena of visible light such as reflection, refraction, interference, and diffraction are also exhibited by non-visible wavelengths. Hence, by understanding these phenomena, and applying them to the non-visible wavelengths, scientists were able to unearth many of nature’s secrets. In fact, if we trace back the roots of modern physics, particularly the wave-particle duality of matter, we will be led back to its manifestation in visible light.
The study of visible light falls under the realm of optics. Among the scientists who have contributed substantially to the development of optics are Christiaan Huygens for his wavelets and a wave theory of light, Isaac Newton for his contributions on reflection and refraction, James Clerk Maxwell for the propagation of electromagnetic waves as explained in a series of equations, and Heinrich Hertz for verifying the truth of those equations through experiments.