The Most Compelling Places to Search for Life Will Look Like “Anomalies”

Will it be possible someday for astrobiologists to search for life "as we don't know it"? Credit: NASA/Jenny Mottar

In the past two and a half years, two next-generation telescopes have been sent to space: NASA’s James Webb Space Telescope (JWST) and the ESA’s Euclid Observatory. Before the decade is over, they will be joined by NASA’s Nancy Grace Roman Space Telescope (RST), Spectro-Photometer for the History of the Universe, Epoch of Reionization, and Ices Explorer (SPHEREx), and the ESA’s PLAnetary Transits and Oscillations of stars (PLATO) and ARIEL telescopes. These observatories will rely on advanced optics and instruments to aid in the search and characterization of exoplanets with the ultimate goal of finding habitable planets.

Along with still operational missions, these observatories will gather massive volumes of high-resolution spectroscopic data. Sorting through this data will require cutting-edge machine-learning techniques to look for indications of life and biological processes (aka. biosignatures). In a recent paper, a team of scientists from the Institute for Fundamental Theory at the University of Florida (UF-IFL) recommended that future surveys use machine learning to look for anomalies in the spectra, which could reveal unusual chemical signatures and unknown biosignatures.

Continue reading “The Most Compelling Places to Search for Life Will Look Like “Anomalies””

JWST Tries to Untangle the Signals of Water. Is it Coming From the Planet or the Star?

This artist concept represents the rocky exoplanet GJ 486 b. Credits: NASA, ESA, CSA, Joseph Olmsted (STScI)

The number of known extrasolar planets has exploded in the past few decades, with 5,338 confirmed planets in 4,001 systems (and another 9,443 awaiting confirmation). When it comes to “Earth-like” planets (aka. rocky), the most likely place to find them is in orbit around M-type red dwarf stars. These account for between 75 and 80% of all stars in the known Universe, are several times smaller than the Sun and are quite cool and dim by comparison. They are also prone to flare activity and have very tight Habitable Zones (HZs), meaning that planets must orbit very closely to get enough heat and radiation.

In addition, red dwarfs are highly-active when they are young, exposing planets in their HZs to lots of ultraviolet and X-ray radiation. As such, whether planets orbiting these stars can maintain or reestablish their atmospheres over time is an open question. Using the James Webb Space Telescope (JWST), researchers from the Space Telescope Science Institute (STScI) observed an exoplanet known as GJ 486 b. As they stated in a recent study, the team detected traces of water vapor, though it is unclear if the signal was coming from the planet or its parent star.

Continue reading “JWST Tries to Untangle the Signals of Water. Is it Coming From the Planet or the Star?”

Rocky Planets Orbiting White Dwarf Stars Could be the Perfect Places to Search for Life

Artist's rendition of a white dwarf from the surface of an orbiting exoplanet. Astronomers have found two giant planet candidates orbiting two white dwarfs. More proof that giant planets can surve their stars' red giant phases. Image Credit: Madden/Cornell University

Some very powerful telescopes will see first light in the near future. One of them is the long-awaited James Webb Space Telescope (JWST.) One of JWST’s roles—and the role of the other upcoming ‘scopes as well—is to look for biosignatures in the atmospheres of exoplanets. Now a new study is showing that finding those biosignatures on exoplanets that orbit white dwarf stars might give us our best chance to find them.

Continue reading “Rocky Planets Orbiting White Dwarf Stars Could be the Perfect Places to Search for Life”

Quasar Light Confirms Consistency Of Electromagnetism Over 8 Billion Years

Using data provided by the Very Large Telescope in Chile, the ESO has been able to discern the "fingerprints" of the early Universe. Credit: ESO

Back in November, a team of researchers from the Swinburne University of Technology and the University of Cambridge published some very interesting findings about a galaxy located about 8 billion light years away. Using the La Silla Observatory’s Very Large Telescope (VLT), they examined the light coming from the supermassive black hole (SMBH) at its center.

In so doing, they were able to determine that the electromagnetic energy coming from this distant galaxy was the same as what we observe here in the Milky Way. This showed that a fundamental force of the Universe (electromagnetism) is constant over time. And on Monday, Dec. 4th, the ESO followed-up on this historic find by releasing the color spectrum readings of this distant galaxy – known as HE 0940-1050.

To recap, most large galaxies in the Universe have SMBHs at their center. These huge black holes are known for consuming the matter that orbits all around them, expelling tremendous amounts of radio, microwave, infrared, optical, ultra-violet (UV), X-ray and gamma ray energy in the process. Because of this, they are some of the brightest objects in the known Universe, and are visible even from billions of light years away.

 Artist’s interpretation of ULAS J1120+0641, a very distant quasar. Credit: ESO/M. Kornmesser

Artist’s interpretation of ULAS J1120+0641, a very distant quasar.
Credit: ESO/M. Kornmesser

But because of their distance, the energy which they emit has to pass through the intergalactic medium, where it comes into contact with incredible amount of matter. While most of this consists of hydrogen and helium, there are trace amounts of other elements as well. These absorb much of the light that travels between distant galaxies and us, and the absorption lines this creates can tell us of lot about the kinds of elements that are out there.

At the same time, studying the absorption lines produced by light passing through space can tell us how much light was removed from the original quasar spectrum. Using the Ultraviolet and Visual Echelle Spectrograph (UVES) instrument aboard the VLT, the Swinburne and Cambridge team were able to do just that, thus sneaking a peak at the “fingerprints of the early Universe“.

What they found was that the energy coming from HE 0940-1050 was very similar to that observed in the Milky Way galaxy. Basically, they obtained proof that electromagnetic energy is consistent over time, something which was previously a mystery to scientists. As they state in their study, which was published in the Monthly Notices of the Royal Astronomical Society:

“The Standard Model of particle physics is incomplete because it cannot explain the values of fundamental constants, or predict their dependence on parameters such as time and space. Therefore, without a theory that is able to properly explain these numbers, their constancy can only be probed by measuring them in different places, times and conditions. Furthermore, many theories which attempt to unify gravity with the other three forces of nature invoke fundamental constants that are varying.

A laser beam launched from VLT´s 8.2-metre Yepun telescope crosses the majestic southern sky and creates an artificial star at 90 km altitude in the high Earth´s mesosphere. The Laser Guide Star (LGS) is part of the VLT´s Adaptive Optics system and it is used as reference to correct images from the blurring effect of the atmosphere. The picture field is crossed by an impressive Milky Way, our own galaxy seen perfectly edge-on. The most prominent objects on the Milky Way are: Sirius, the brightest star in the sky, visible at the top and the Carina nebula, seen as a bright patch besides the telescope. From the right edge of the picture to the left, the following objects are aligned: the Small Magellanic Cloud (with the globular cluster 47 Tucanae on its right), the Large Magellanic Cloud and Canopus, the second brightest star in the sky.
A laser beam launched from the Very Large Telescope (VLT) at the ESO’s La Silla Observatory in Chile. Credit: ESO

Since it is 8 billion light years away, and its strong intervening metal-absorption-line system, probing the electromagnetic spectrum being put out by HE 0940-1050 central quasar – not to mention the ability to correct for all the light that was absorbed by the intervening intergalactic medium – provided a unique opportunity to precisely measure how this fundamental force can vary over a very long period of time.

On top of that, the spectral information they obtained happened to be of the highest quality ever observed from a quasar. As they further indicated in their study:

“The largest systematic error in all (but one) previous similar measurements, including the large samples, was long-range distortions in the wavelength calibration. These would add a ?2 ppm systematic error to our measurement and up to ?10 ppm to other measurements using Mg and Fe transitions.”

However, the team corrected for this by comparing the UVES spectra to well-calibrated spectra obtained  from the High Accuracy Radial velocity Planet Searcher (HARPS) –  which is also located at the at the La Silla Observatory. By combining these readings, they were left with a residual systematic uncertainty of just 0.59 ppm, the lowest margin of error from any spectrographic survey to date.

High Accuracy Radial velocity Planet Searcher at the ESO La Silla 3.6m telescope. Credit: ESO

This is exciting news, and for more reasons that one. On the one hand, precise measurements of distant galaxies allow us to test some of the most tricky aspects of our current cosmological models. On the other, determining that electromagnetism behaves in a consistent way over time is a major find, largely because it is responsible for such much of what goes on in our daily lives.

But perhaps most importantly of all, understanding how a fundamental force like electromagnetism behaves across time and space is intrinsic to finding out how it – as well as weak and strong nuclear force – unifies with gravity. This too has been a preoccupation of scientists, who are still at a loss when it comes to explaining how the laws governing particles interactions (i.e. quantum theory) unify with explanations of how gravity works (i.e general relativity).

By finding measurements of how these forces operate that are not varying could help in creating a working Grand Unifying Theory (GUT). One step closer to truly understanding how the Universe works!

Further Reading: ESO

How Do We Know How Old Everything Is?

How Do We Know How Old Everything Is?

We hear that rocks are a certain age, and stars are another age. And the Universe itself is 13.7 billion years old. But how do astronomers figure this out?

I know it’s impolite to ask, but, how old are you? And how do you know? And doesn’t comparing your drivers license to your beautiful and informative “Year In Space” calendar feel somewhat arbitrary? How do we know old how everything is when what we observe was around long before calendars, or the Earth, or even the stars?

Scientists have pondered about the age of things since the beginning of science. When did that rock formation appear? When did that dinosaur die? How long has the Earth been around? When did the Moon form? What about the Universe? How long has that party been going on? Can I drink this beer yet, or will I go blind? How long can Spam remain edible past its expiration date?

As with distance, scientists have developed a range of tools to measure the age of stuff in the Universe. From rocks, to stars, to the Universe itself. Just like distance, it works like a ladder, where certain tools work for the youngest objects, and other tools take over for middle aged stuff, and other tools help to date the most ancient.

Let’s start with the things you can actually get your hands on, like plants, rocks, dinosaur bones and meteorites. Scientists use a technique known as radiometric dating. The nuclear age taught us how to blow up stuff real good, but it also helped understand how elements transform from one element to another through radioactive decay.

For example, there’s a version of carbon, called carbon-14. If you started with a kilo of it, after about 5,730 years, half of it would have turned into carbon-12. And then by 5,730 more years, you’d have about ¼ carbon-14 and ¾ carbon-12.

A list of the elements with their corresponding visible light emission spectra. Image Credit: MIT Wavelength Tables, NIST Atomic Spectrum Database, umop.net

This is known as an element’s half-life. And so, if you measure the ratio of carbon-12 to carbon-14 in a dead tree, for example, you can calculate how long ago it lived. Different elements work for different ages. Carbon-14 works for the last 50,000 years or so, while Uranium-238 has a half-life of 4.5 billion years, and will let you date the most ancient of rocks. But what about the stuff we can’t touch, like stars?

When you use a telescope to view a star, you can break up its light into different colors, like a rainbow. This is known as a star’s spectra, and if you look carefully, you can see black lines, or gaps, which correspond to certain elements. Since they can measure the ratios of different elements, astronomers can just look at a star to see how old it is. They can measure the ratio of uranium-238 to lead-206, and know how long that star has been around. How astronomers know the age of the Universe itself is one of my favorites, and we did a whole episode on this.

Artist's conception of Planck, a space observatory operated by the European Space Agency, and the cosmic microwave background. Credit: ESA and the Planck Collaboration - D. Ducros
Artist’s conception of Planck, a space observatory operated by the European Space Agency, and the cosmic microwave background. Credit: ESA and the Planck Collaboration – D. Ducros

The short answer is, they measure the wavelength of the Cosmic Microwave Background Radiation. Since they know this used to be visible light, and has been stretched out by the expansion of the Universe, they can extrapolate back from its current wavelength to what it was at the beginning of the Universe. This tells them the age is about 13.8 billion years. Radiometric dating was a revolution for science. It finally gave us a dependable method to calculate the age of anything and everything, and finally figure out how long everything has been around.

So, fan of our videos. How old are you? Tell us in the comments below.
Thanks for watching! Never miss an episode by clicking subscribe.Our Patreon community is the reason these shows happen. We’d like to thank Ryan Finley and the rest of the members who support us in our quest to make great space and astronomy content every week. Our community members get advance access to episodes, extras, contests, and other shenanigans with Jay, myself and the rest of the team. Want to get in on the action? Click here.

Weekly SkyWatcher’s Forecast: April 23-29, 2012

Mars In Leo - Credit: John Chumack

[/caption]

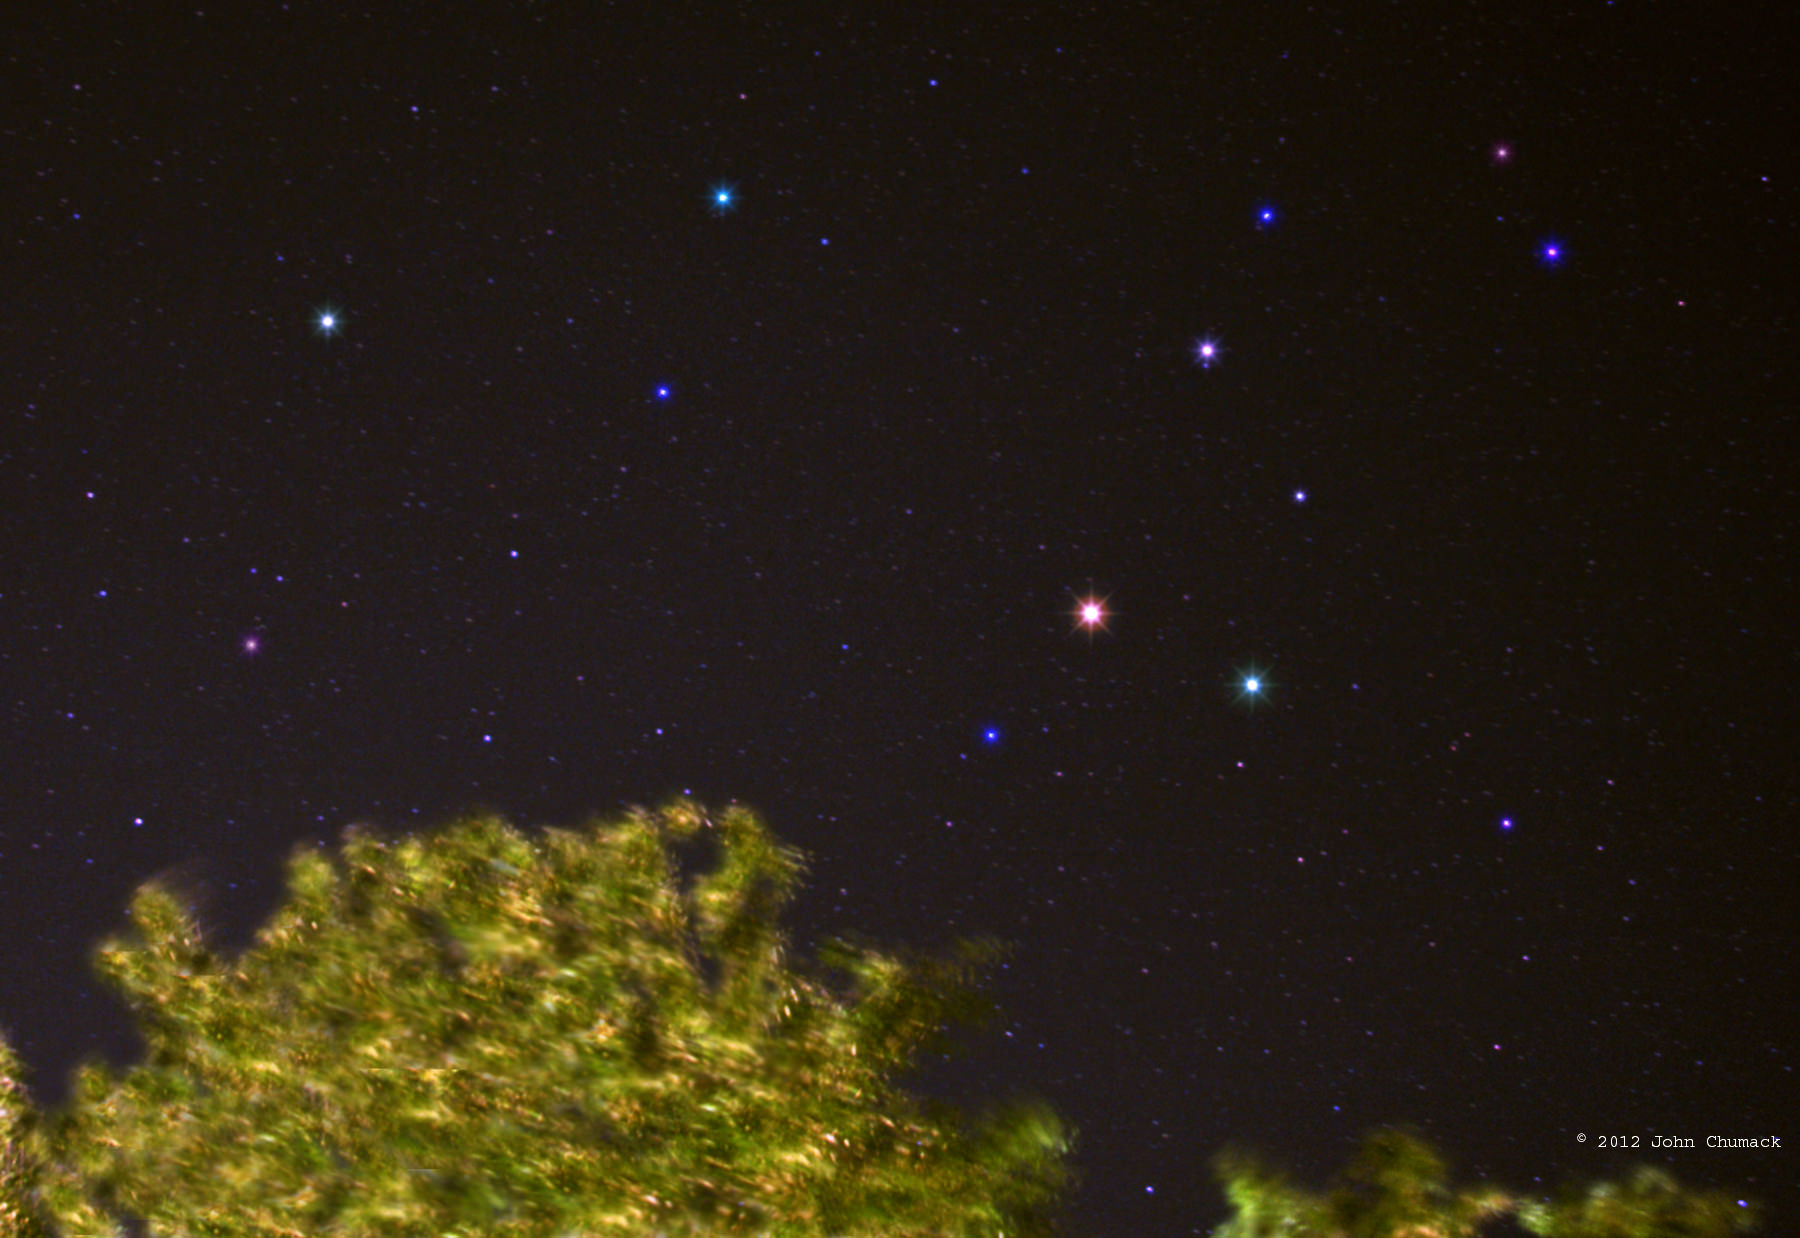
Greetings, fellow SkyWatchers! What a great week to just enjoy some great unaided eye astronomy observations. Who can resist the beautiful appearance of Mars in Leo? Also this week, you’ll enjoy not one – but two – meteor showers as the Mu Virginids come to town mid-week and the Bootids light up the weekend. Get ready to enjoy bright stars, find planets, explore lunar features, learn some astronomy history and much more! When ever you’re ready, meet me in the back yard…

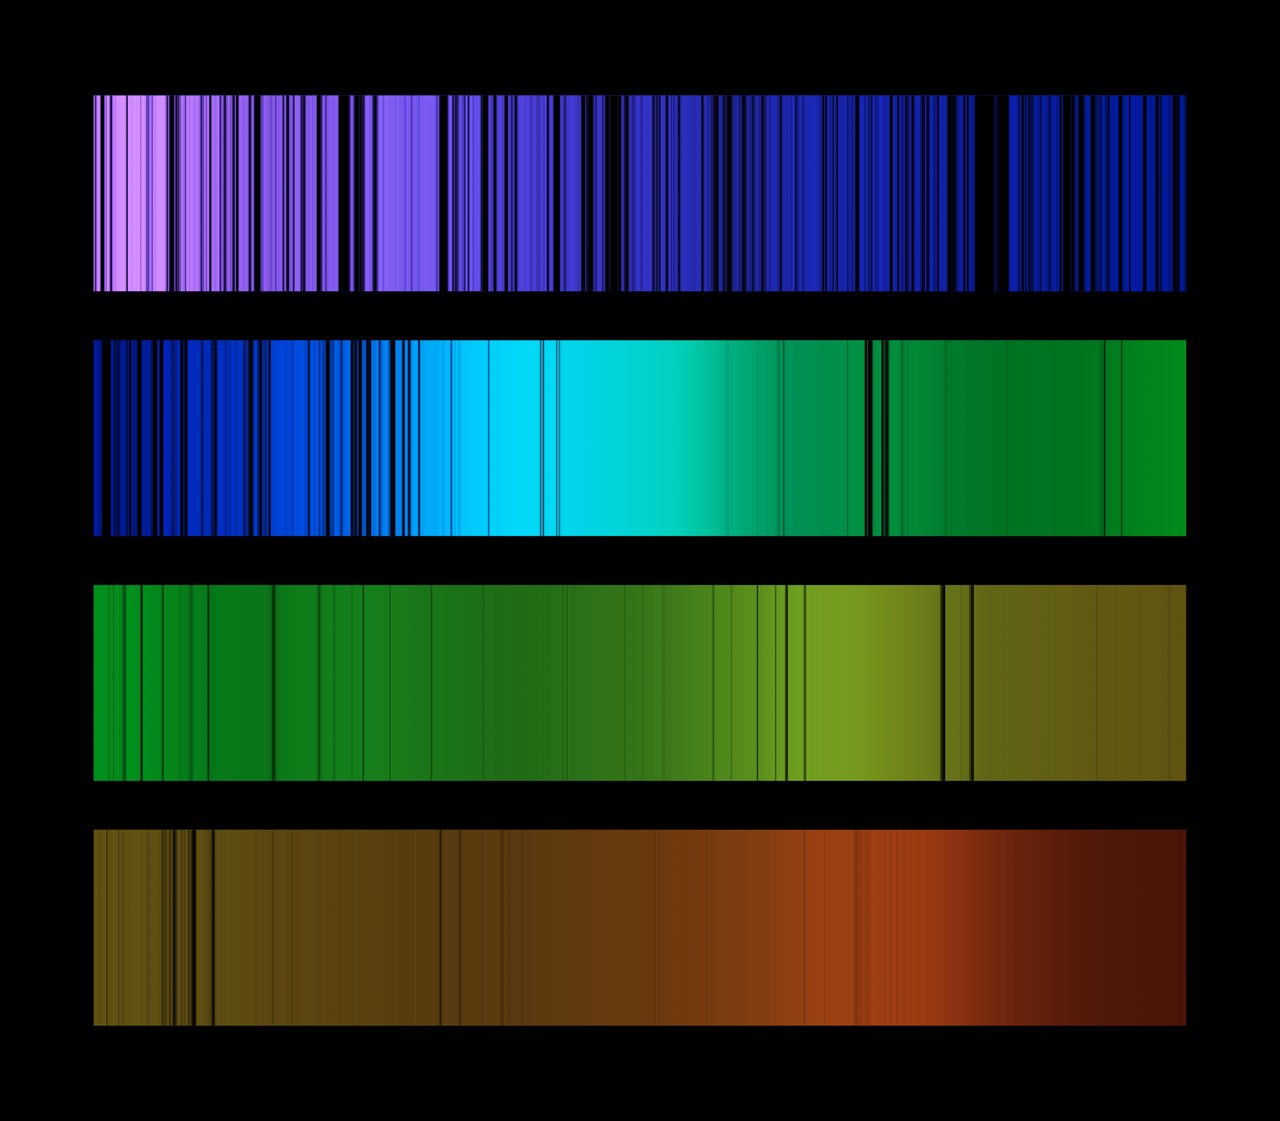
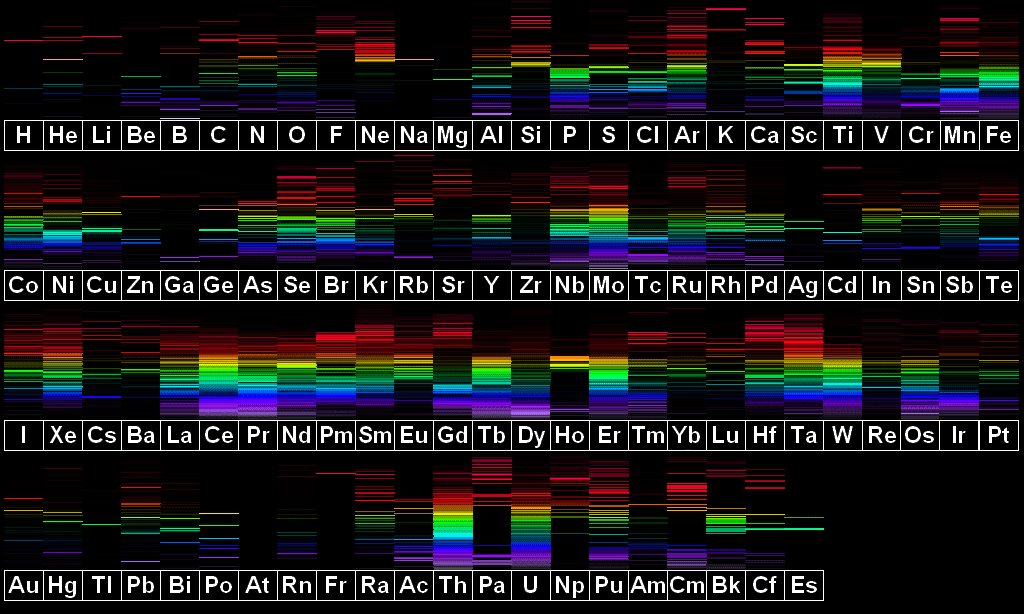
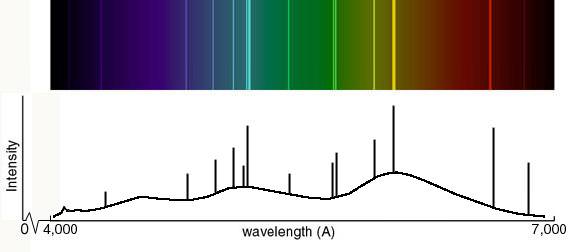
Monday, April 23 – Pioneer quantum physicist Max Planck was born on this day in 1858. In 1900, Max developed the Planck equation to explain the shape of blackbody spectra (a function of temperature and wavelength of emission). A “blackbody” is any object that absorbs all incident radiation – regardless of wavelength. For example, heated metal has blackbody properties because the energy it radiates is thermal. The blackbody spectrum’s shape remains constant, and the peak and height of an emitter can be measured against it – be it cosmic background radiation – or our own bodies.

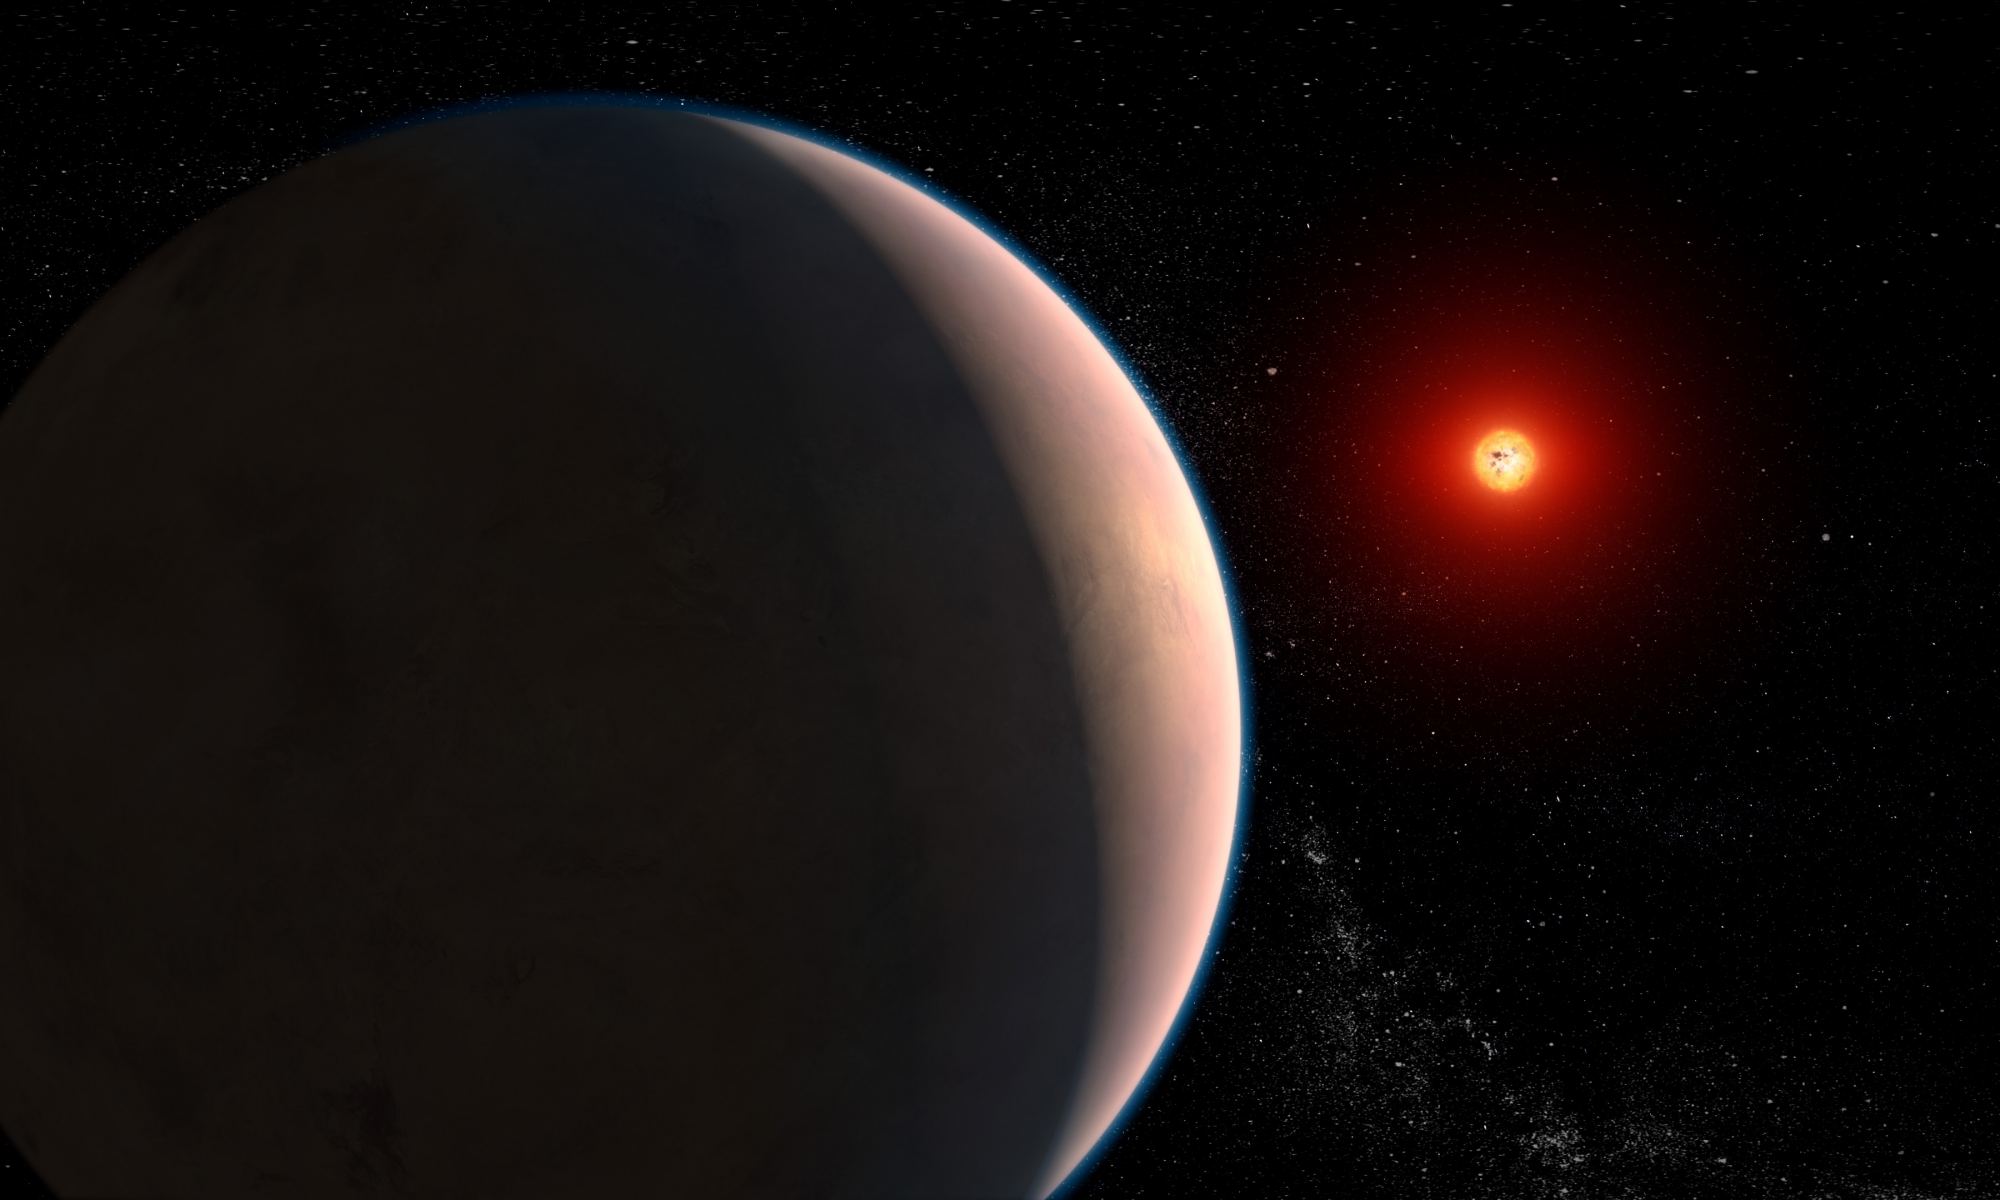
Now, let’s put this knowledge into action. Stars themselves approximate blackbody radiators, because their temperature directly controls the color we see. A prime example of a “hot” star is Alpha Virginis, better known as Spica. Compare its color to the cooler Arcturus… What colors do you see? There are other astronomical delights that radiate like blackbodies over some or all parts of the spectrum as well. You can observe a prime example in a nebula such as M42, in Orion. By examining the radio portion of the spectrum, we find the temperature properly matches that of electrons involved in the process of fluorescence. Much like a common household fixture, this process is what produces the visible light we can see.

Tuesday, April 24 – Today in 1970, China launched its first satellite. Named Shi Jian 1, it was a successful technological and research craft. This achievement made China the fifth country to send a vessel into space.

Tonight see if you can spot the tender beginnings of the Moon after sunset. Observers take pleasure in sweeping the sky with small scopes and binoculars in hopes of finding the thinnest possible lunar crescent. And speaking of crescents, did you spot Venus close to the Moon? Why not take out your telescope and see what phase Venus is now in. If you don’t have a filter to cut its bright glare, try wearing sunglasses!

No telescope? No problem. You can still do some very awesome astronomy with just your eyes! Begin with locating the northern constellation of Ursa Major – most commonly known as the “Big Dipper”. Take note of the curve of the Dipper’s “handle” and trace it from the bottom of the cup and continue on the “Arc to Arcturus”. Keep moving, because now you’re going to “Speed on to Spica”! Once you’ve located this bright, blue/white star, simply look to its east/southeast (or upper left) for a yellow appearing “star”. That’s no star… That’s Saturn!

Now let’s have a look at 140 light-year distant Epsilon Hydrae – the northernmost star in the small circlet east of Procyon. While it and Rho will make a beautiful visual double for binoculars, Epsilon itself is a multiple system. Its A and B components are a tough split for any scope, but the 8th magnitude C star is easier. The D component is a dwarf star.

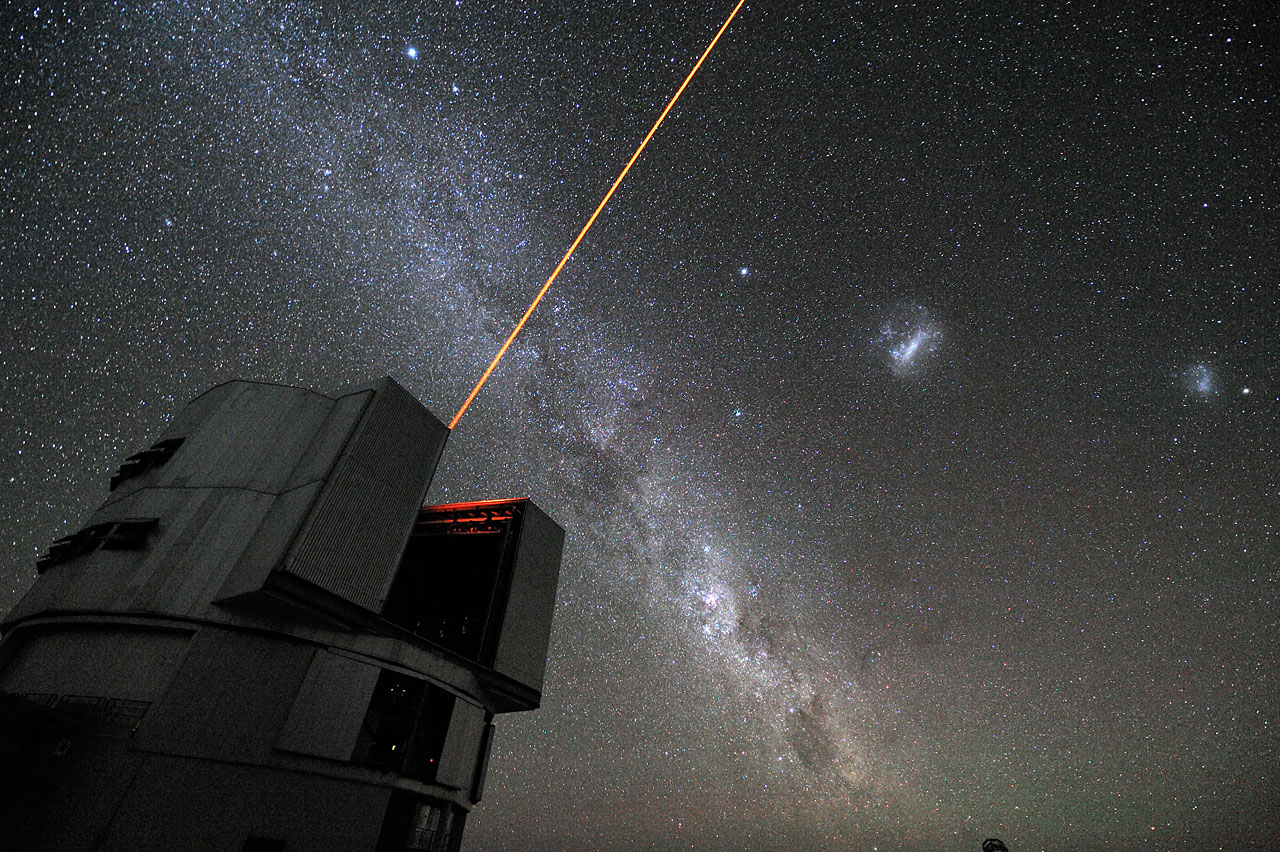
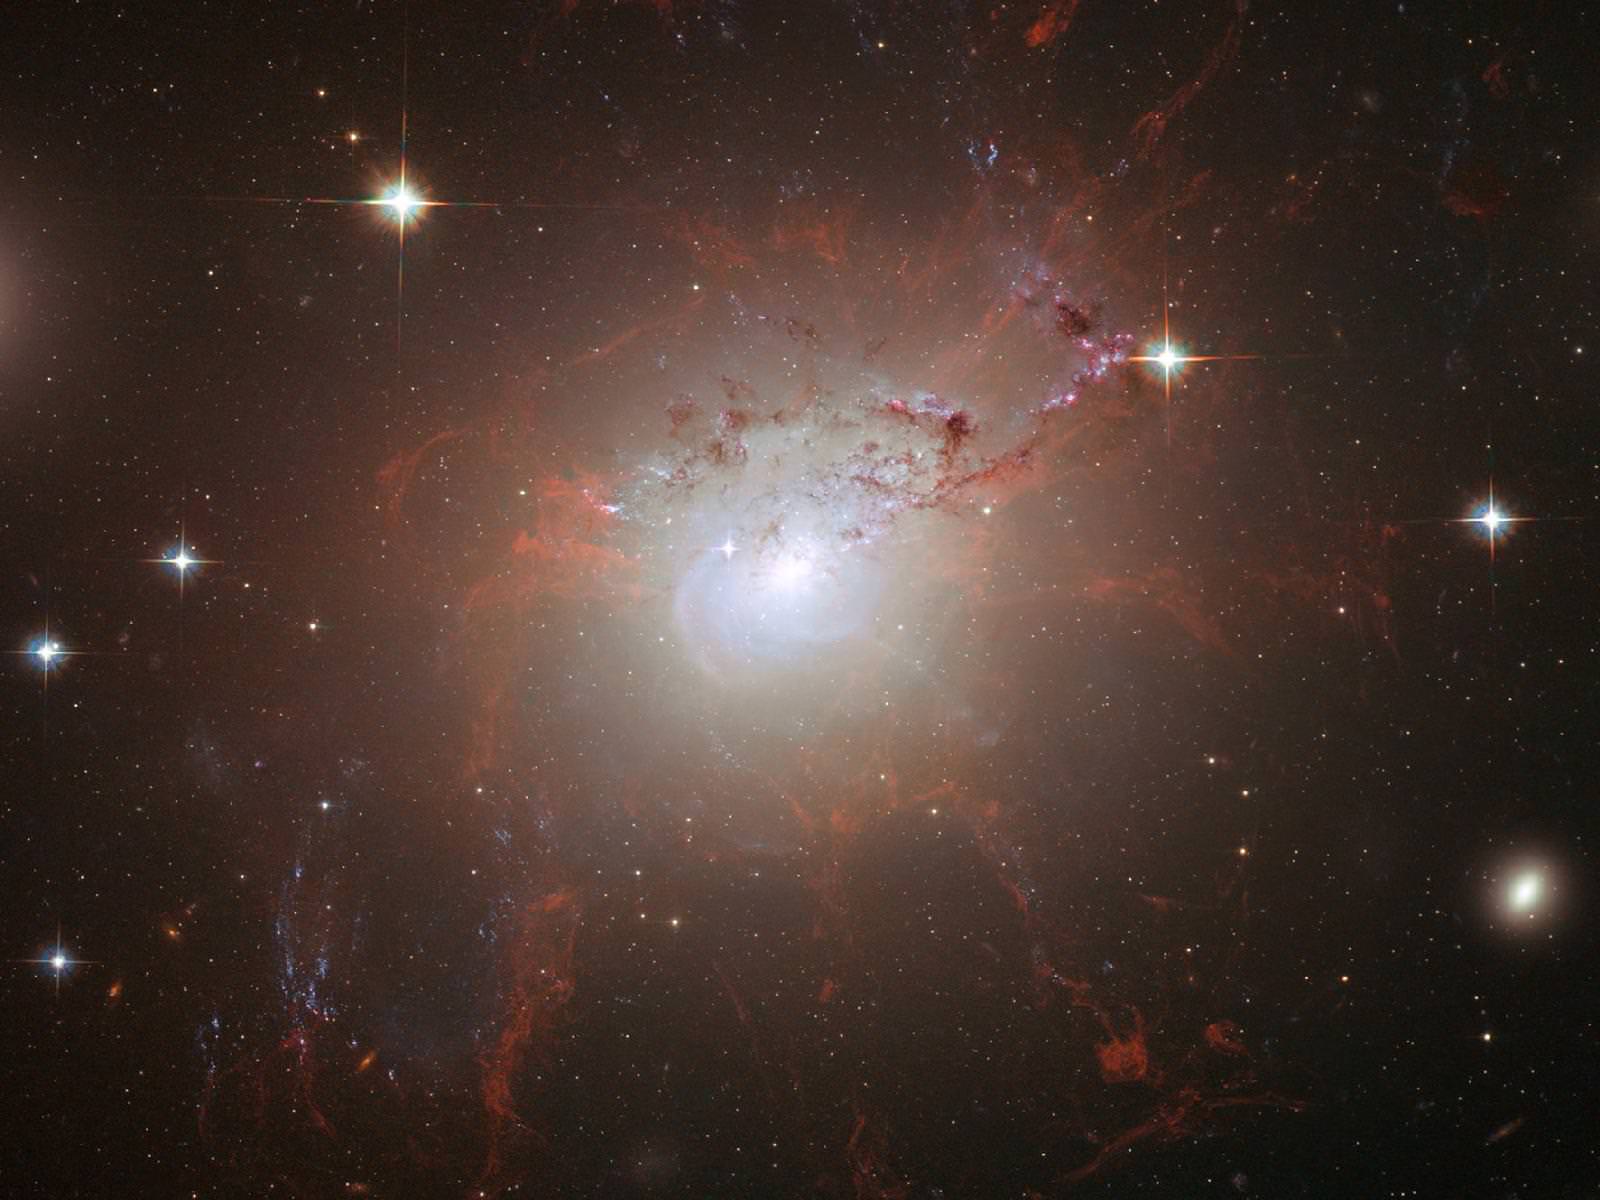
Wednesday, April 25 – Today marks the 15th anniversary of the deployment of Hubble Space Telescope. While everyone in the astronomical community is well aware of what this magnificent telescope “sees,” did you know that you can see it with just your eyes? The HST is a satellite that can be tracked and observed. Visit heavens-above.com and enter your location. This page will provide you with a list of visible passes for your area. Although you can’t see details of the scope itself, it’s great fun to track with binoculars or see the Sun glinting off its surface in a scope.

Tonight our first voyage is to the Moon’s surface. Look along the terminator in the southern quadrant and revisit ancient old crater Furnerius. Named for French Jesuit mathematician George Furner, this crater spans approximately 125 kilometers and is a lunar club challenge. Power up and look for two interior craters. The smaller is crater A and it spans a little less than 15 kilometers and drops to a depth of over 1000 meters. The larger crater C is about 20 kilometers in diameter, but goes far deeper, to more than 1400 meters. That’s about as deep as a coral will grow under the Earth’s oceans!

Keep a watch on the skies while you’re out as the Mu Virginid meteor shower reaches its peak at 7 to 10 per hour. With dark skies tonight, you still might catch one of these medium speed meteors radiating from a point near the constellation of Libra.

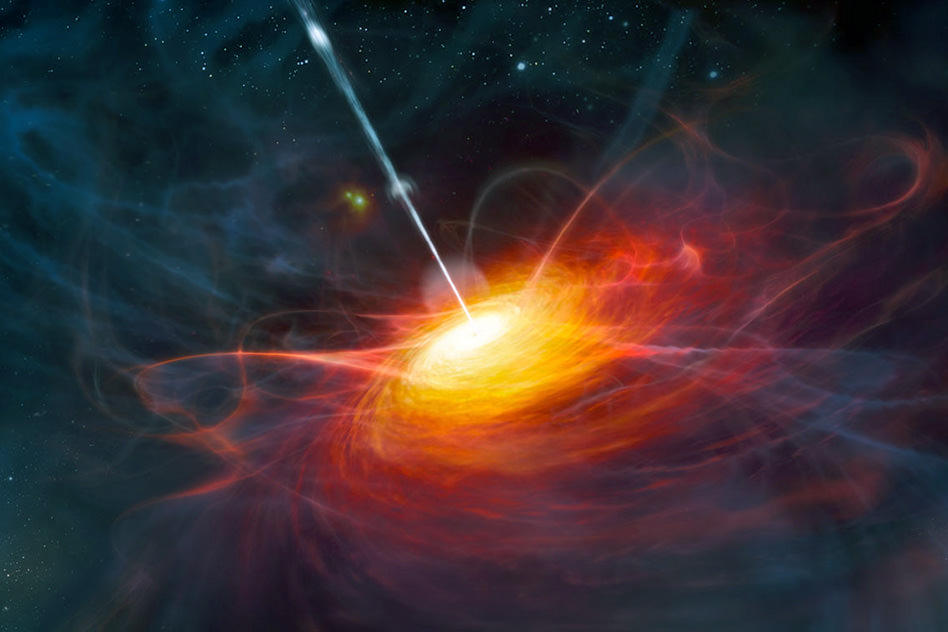
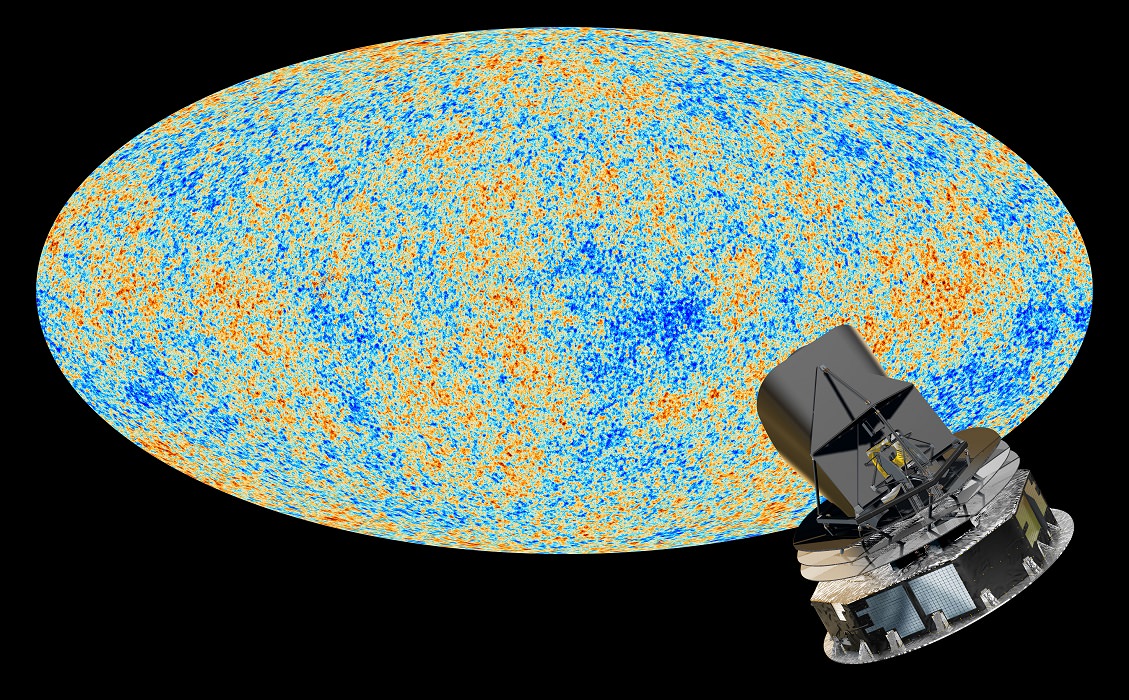
Thursday, April 26 – On this date in 1920, the Shapely-Curtis debate raged in Washington on the nature of and distance to spiral nebulae. Shapely claimed they were part of one huge galaxy to which we all belonged, while Curtis maintained they were distant galaxies of their own. Thirteen years later on the same date, Arno Penzias was born. He went on to become a Nobel Prize winner for his part in the discovery of the cosmic microwave background radiation, through searching for the source of the “noise” coming from a simple horn antenna. His discovery helped further our understanding of cosmology in ways that Shapely and Curtis could have never dreamed of.

Perhaps they dreamed of Moon? We’ve got Moon! No matter, what we really want to do is revisit and study a changeable, sometimes transient, and eventually bright feature on the lunar surface – crater Proclus. At around 28 kilometers in diameter and 2400 meters deep, Proclus will appear on the terminator on the west mountainous border of Mare Crisium. For many viewers tonight, it will seem to be about 2/3 black, but 1/3 of the exposed crater will be exceptionally brilliant – and with good reason. Proclus has an albedo, or surface reflectivity, of about 16%, which is an unusually high value for a lunar feature. Watch this area over the next few nights as two rays from the crater will widen and lengthen, extending approximately 322 kilometers to both the north and south. Congratulations on another lunar club challenge!

Friday, April 27 – Tonight we’re heading towards the lunar surface to view a very fine old crater on the northwest shore of Mare Nectaris – Theophilus. Slightly south of mid-point on the terminator, this crater contains an unusually large multiple-peaked central mountain which can be spotted in binoculars. Theophilus is an odd crater, one that is a parabola – with no area on the floor being flat. It stretches across a distance of 100 kilometers and dives down 440 meters below the surface. Tonight it will appear dark, shadowed by its massive west wall, but look for sunrise on its 1400 meter summit!

Now, let’s try picking up a globular cluster in Hydra that is located about 3 fingerwidths southeast of Beta Corvus and just a breath northeast of double star A8612 – M68 (Right Ascension:12 : 39.5 – Declination: -26 : 45). This class X globular was discovered in 1780 by Charles Messier and first resolved into individual stars by William Herschel in 1786. At a distance of approximately 33,000 light-years, it contains at least 2000 stars, including 250 giants and 42 variables. It will show as a faint, round glow in binoculars, and small telescopes will perceive individual members. Large telescopes will fully resolve this small globular to the core!

While you’re out, have a look at 27 Hydrae about a fingerwidth southwest of Alpha. It’s an easy double for any equipment with its slightly yellow 5th magnitude primary and distant, white, 7th magnitude secondary. Although it is wide, the pair is a true binary system.

Saturday, April 28 – Today was a very busy day in astronomy history. Newton published his Principia in 1686 on April 28. In 1774, Francis Baily was born. He went on to revise star catalogs and explain the phenomenon at the beginning and ending of a total solar eclipse which we know as “Baily’s Beads.” 1900 saw the birth of Jan Hendrick Oort, who quantified the Milky Way’s rotation characteristics and envisioned the vast, spherical area of comets outside our solar system that we now call the Oort Cloud. Last, but not least, was the birth of Bart Jan Bok in 1906 who studied the structure and dynamics of the Milky Way.

Tonight’s outstanding lunar feature will be crater Maurolycus just southwest of the three rings of Theophilus, Cyrillus and Catharina. This lunar club challenge spans 114 kilometers and goes below the lunar surface by 4730 meters. Be sure to look for Gemma Frisius just to its north.

Now let’s check out a dandy little group of stars that are about a fistwidth southeast of Procyon and just slightly more than a fingerwidth northeast of M48. Called C Hydrae, this group isn’t truly gravitationally bound, but is a real pleasure to large binoculars and telescopes of all sizes. While they share similar spectral types, this mixed magnitude collection will be sure to delight you!

For SkyWatchers, no equipment is necessary to enjoy the Alpha Bootid meteor shower – despite the Moon. Pull up a comfortable seat and face orange Arcturus as it climbs the sky in the east. These slow meteors have a fall rate of 6 to 10 per hour and leave very fine trails, making an evening of quiet contemplation most enjoyable.

Sunday, April 29 – Before we explore space, let’s have a look at the Moon and the close apparition of Regulus and Mars! The three make a wonderful “line up” the night sky! Now, let’s start our lunar observations tonight as challenge craters Cassini and Cassini A come into view just south of the black slash of the Alpine Valley. The major crater spans 57 kilometers and reaches a floor depth of 1240 meters. The challenge is to also spot the central crater A, which is only 17 kilometers wide, yet drops down another 2830 meters below the surface.

While we’re out, have a look at R Hydrae about a fingerwidth east of Gamma – which is a little more than fistwidth south of Spica. R is a beautiful, red, long-term variable first observed by Hevelius in 1662. Located about 325 light-years from us, it’s approaching – but not that fast. Be sure to look for a visual companion star as well!

Until next week? Dreams really do come true when you keep on reaching for the stars!

Many thanks to John Chumack of Galactic Images for his outstanding photo of “Leo In Mars”!

Hubble Telescope Directly Observes Quasar Accretion Disc Surrounding Black Hole

A team of scientists has used the NASA/ESA Hubble Space Telescope to observe a quasar accretion disc — a brightly glowing disc of matter that is slowly being sucked into its galaxy’s central black hole. Their study makes use of a novel technique that uses gravitational lensing to give an immense boost to the power of the telescope. The incredible precision of the method has allowed astronomers to directly measure the disc’s size and plot the temperature across different parts of the disc. Image credit: NASA, ESA, J.A. Munoz (University of Valencia)

[/caption]

Thanks to the magic of the NASA/ESA Hubble Space Telescope, a team of international astronomers have made an incredible observation – a quasar accretion disc surrounding a black hole. By employing a technique known as gravitation lensing, the researchers have been able to get an accurate size measurement and spectral data. While you might not think this exciting at first, know that this type of observation is akin to spotting individual grains of sand on the Moon!

Of course, we know we can’t see a black hole – but we’ve learned a lot about them with time. One of their properties is a bright, visible phenomenon called a quasar. These glowing discs of matter are engaged in orbit around the black hole, much like a coil on an electric stove. As energy is applied, the “coil” heats up and unleashes bright radiation.

“A quasar accretion disc has a typical size of a few light-days, or around 100 billion kilometres across, but they lie billions of light-years away. This means their apparent size when viewed from Earth is so small that we will probably never have a telescope powerful enough to see their structure directly,” explains Jose Munoz, the lead scientist in this study.

Because of the diminutive size of the quasar, most of our understanding of how they work has been based on theory… but great minds have found a way to directly observe their effects. By employing the gravity of stars in an intervening galaxy like a scanning microscope, astronomers have been able to observe the quasar’s light as the stars move. While most of these types of features would be too small to see, the gravitation lensing effect ramps up the strength of the quasar’s light and allows study of the spectra as it cruises across the accretion disc.

This diagram shows how Hubble is able to observe a quasar, a glowing disc of matter around a distant black hole, even though the black hole would ordinarily be too far away to see clearly. Credit: NASA and ESA

By observing a group of gravitationally lensed quasars, the team was able to paint a vivid color portrait of the activity. They were able to pick out small changes between single images and spectral shifts over a period of time. What causes these kaleidoscopic variances? For the most part, it’s the different properties in the gases and dust of the lensing galaxies. Because they travel at different angles to the quasar’s light, scientists were even able to distinguish extinction laws at work.

But there was something special about one of the quasars. Says the Hubble Team, “There were clear signs that stars in the intervening galaxy were passing through the path of the light from the quasar. Just as the gravitational effect due to the whole intervening galaxy can bend and amplify the quasar’s light, so can that of the stars within the intervening galaxy subtly bend and amplify the light from different parts of the accretion disc as they pass through the path of the quasar’s light.”

By documenting these color changes, the team could build a profile of the accretion disc. Unlike our Earthly electric stove coil which glows red as it heats up, the accretion disc of a black hole turns blue as it gets closer to the event horizon. By measuring the blue hue, the team was able to measure the disc diameter and the various tints gave them an indicator of distances from its center. In this case, they found that the disc is between four and eleven light-days across (approximately 100 to 300 billion kilometres). Of course, these are only rough estimates, but considering just how far away we’re looking at such a small object gives these types of observations great potential for future studies… and even improvements on accuracy.

“This result is very relevant because it implies we are now able to obtain observational data on the structure of these systems, rather than relying on theory alone,” says Munoz. “Quasars’ physical properties are not yet well understood. This new ability to obtain observational measurements is therefore opening a new window to help understand the nature of these objects.”

Original Story Source: ESA/Hubble News Release. For Further Reading: A Study of Gravitational Lens Chromaticity With the Hubble Space Telescope.

Energizing the Filaments of NGC 1275

NGC 1275
NGC 1275 as captured by the Hubble Space Telescope

[/caption]

When examining clusters of galaxies, astronomers often find massive elliptical galaxies lurking at the centers. In some of these, long filaments of gas and dust extend outwards from the core. One of the best examples of this is the relatively nearby galaxy NGC 1275 which lies in the constellation of Perseus. In this galaxy these tendrils are exceptionally narrow, only about 200 light years across, but as long as 20,000 light years in length. While many groups have studied them, their nature is a topic of much debate. The structures tend to be far removed from star forming regions which can cause the gas to glow. So what energy source powers these gaseous ribbons?

Answering this question is the goal of a recent paper by a team of astronomers led by Andrew Fabian at Cambridge University. Previous studies have explored the spectra of these filaments. Although the filaments have strong Hα emission, created by warm hydrogen gas, the spectra of these tendrils are unlike any nebulae within our own galaxy. The closest resemblance to galactic objects was the Crab Nebula, the remnant of a supernova that was witnessed in 1054 AD. Additionally, the spectra also reveal the presence of molecules such as carbon monoxide and H2.

Another, previous challenge astronomers faced with these tendrils was explaining their formation. Since molecules were present, it meant the gas was cooler than the surrounding gas. In this case, the clouds should collapse due to their self gravity to form more stars than are actually present. But surrounding these tendrils is ionized plasma which should interact with the cold gas, heating it and causing it to disperse. While these two forces would counteract one another, it is impossible to consider that they would balance each other perfectly in one case, let alone for the numerous tendrils in numerous central galaxies.

This problem was apparently solved in 2008, when Fabian published a paper in Nature suggesting that these filaments were being columnated by extremely weak magnetic fields (only 0.01% the strength of Earth’s). These field lines could prevent the warmer plasma from directly entering the cold filaments since, upon interaction with the magnetic field, they would be redirected. But could this property help to explain the lesser degree of heating that still causes the emission spectra? Fabian’s team thinks so.

In the new paper, they suggests that some of the particles of the surrounding plasma do eventually penetrate the cold tendrils which explains some of the heating. However, this flow of charged particles also affects the field lines themselves inducing turbulence which also heats the gas. These effects make up the main bulk of the observed spectra. But the tendrils also exhibit an anomalous amount of X-ray flux. The team proposes that some of this is due to charge exchange in which the ionized gas entering the filaments steals electrons from the cold gas. Unfortunately, the interactions are expected to be too infrequent to explain all of the observed X-rays leaving this portion of the spectrum not fully explained by the new model.


In this article I’ve used the words “magnetic field”, “charge”, and “plasma” throughout, so of course the Electric Universe crowd is going to come flocking, declaring this validates everything they’ve ever said, just as they did when magnetic fields were first implicated in 2008. So before closing completely, I want to take a bit to consider how this new study conforms to their predictions. In general, the study agrees with their claims. However, that doesn’t mean their claims are correct. Rather, it implies they’re worthlessly vague and can be made to fit any circumstance that even briefly mentions such words as I listed above.

The EU supporters consistently refuse to provide any quantitative models which could provide true discriminating tests for their propositions. Instead, they leave the claims suspiciously vague and insist that complex physics is completely understandable with no more understanding than high school level E&M. As a result, the mere scale of their claims is horrifically inconsistent wherein they propose things like the paltry field in this article, or the slight charge on lunar craters are indicative of overwhelming currents powering stars and entire galaxies.

So while articles like this one do reinforce the EU position that electromagnetics does play a role in astronomy, it does not support the grandiose claims on entirely different scales. In the meantime, astronomers don’t argue that electromagnetic effects don’t exist (like EU supporters frequently claim). Rather, we analyze them and appreciate them for what they are: Generally weak effects that are important here and there, but they’re not some all powerful energy field pervading the universe.

Spectroscopy in 1881

Instrument for imaging solar spectra on photographic plate. Also contains electric arc lamp which can be focused above solar spectra to allow for comparison.

[/caption]

Presently, I’ve been reading a lot of very old papers and books in astronomy. The work I’m currently reading a portion of, is from 1881, and is a summary of all the findings of the year in all fields of Science. For those that aren’t familiar with that time period in astronomy, the big thing was spectroscopy. It was only ~30 years earlier that chemists and astronomers had begun to work out methods by which to investigate spectra and with the newly developed tools in hand, astronomers were pointing them at anything they could find sufficiently bright to get a spectra. Obviously, this meant the first target was the Sun. This work provides an interesting snapshot at a developing era in astronomical history.

The article describes a brief bit of background, noting that the pioneering work of spectroscopy was done by Fraunhofer, Kirchoff, Angstrom, and Thalen (but manages to leave out Kirchoff’s colleague, Robert Bunsen!). These early explorers noted that, although spectral lines may appear unique, several had lines that would appear in very nearly the same positions.

Another discovery around that time was the phenomenon of emission lines from the Sun’s corona. This had officially been discovered in 1868 during a solar eclipse, but now that astronomers knew about the occurrence, they began to explore it further and discovered that many of the features had no apparent explanation as the chemicals causing them had yet to be discovered on Earth. Incidentally, it would be a year following this publication that helium, one of the chief components of the Sun, would be found and isolated on Earth.

As the astronomers explored the corona, they inspected the various layers and found a bizarre thing: Magnesium appeared higher in the corona than sodium despite magnesium having a higher atomic weight which astronomers realized, should cause it to sink. While this is not explained, I should note that spectra often play tricks like this. It may well have been that magnesium simply emits better at the temperatures in that region given an overestimation of the abundance. This odd behavior, as well as the inconstant nature of the spectra on various portions of the Sun was described as “a great screw loose”.

Another portion of the paper provides another somewhat humorous snapshot of this moment in history as the writer remarks just how different the Sun is from the Earth. He states, “It was difficult to imagine a stronger difference to exist between any two masses of matter than the chemical constitution of the incandescent sun, and of the earth, which is now cooling.” He wonders if perhaps planets evolved from failed stars in which the Sun’s “immense temperature had not allowed a complex evolution of higher complex forms of chemical matter to take place”. While this may seem quaint, the periodic table had only been developed 12 years prior and the creation of heavy elements would not be well understood until the 1950’s.

Similarly, the confusion on the varying spectral lines between stars is apparent although the author shows that the answers were already being developed, although still not fully fleshed out. He cites Angstrom stating: “In increasing successively the temperature I have found that the lines of the spectra vary in intensity in an exceedingly complicated way, and consequently new lines even may present themselves if the temperature is raised sufficiently high.”

In this single flash of insight, Angstrom had predicted a methodology by which astronomers could have begun to classify stars. Unfortunately, the standard of classification had already been set and it would take until the next century for astronomers to begin classifying stars by temperature (thanks to the work of Annie Jump Cannon). However, the author demonstrates that investigation was underway as to the relationship between temperature and line intensity. This work would eventually connect to our modern understanding of stellar temperatures.

Atomic Spectra

An example of an atomic spectrum, showing emission lines at particular wavelengths.

The light which atoms give off is made up of specific wavelengths, called lines; observed by a spectroscope, the lines are, collectively, atomic spectra.

In more detail …

In an atom, electrons have specific and discrete energies. There are many more energy states (or levels) in each atom than there are electrons. When an electron transitions (‘jumps’) from one energy level to another, it emits (if going from a higher level to a lower one) or absorbs (vice versa) light – a photon – with a discrete, specific wavelength. In any given set of conditions (pressure, temperature, magnetic field strength, etc), the collection of all those specific wavelengths is the spectrum of the atom … so atomic spectra are the spectra of atoms!

As the atomic electron energy levels are unique to each element, the lines in a spectrum (emission or absorption) can be used to identify the elements present in the source (a star, say) or gas between the source and us (e.g. the interstellar medium). Of course, for an extragalactic object – a quasar, perhaps – you need more than one line to make a certain identification … because the universe is expanding (and so you don’t know how much just one line may have been redshifted).

The light electronic transitions in atoms produces may not be in the visual part of the electromagnetic spectrum, but for atoms that are neutral or have lost only one or two electrons (yes, ‘atomic spectra’ refers to the line spectrum of ions too!), most lines are in the UV, visual, or near infrared. For highly ionized atoms, the lines are found in the extreme UV or x-ray region.

As the relative intensity of the lines in an atomic spectrum varies with temperature, analysis of the lines in the spectrum of a star (say) can give an estimate of the temperature of the star’s surface (photosphere). The width of the lines depends on the pressure of the gas; the structure of the lines depends on the magnetic field strength; the … (you get the idea) – atomic spectra are a wonderful window into the physical conditions of places far, far away!

Looking for more? This University of Oregon webpage has a good, brief, description of atomic spectra; and Physics Lab’s Atomic Models and Spectra covers both the historical context and a bit more of the theory.

As atomic spectra play such a vital role in optical astronomy, no wonder there are so many Universe Today articles involving atomic spectra! Here’s a random selection: New Study Find Fundamental Force Hasn’t Changed Over Time, Spitzer Discovers Early Galaxy Forming Region, and Strange Nebula Around Eta Carinae .

The Astronomy Cast episode Energy Levels and Spectra is all about atomic spectra. Other Astronomy Cast episodes well worth a listen, in regard to atomic spectra, include Optical Astronomy and In Search of Other Worlds.

Sources:
GSU Hyperphysics
NIST