Video Caption: NASA/JAXA’s GPM satellite measured record rainfall that fell over the Carolinas from September 26 to October 5, 2015 from a plume of moisture from Hurricane Joaquin when it was located over the Bahamas and moved to Bermuda. The IMERG showed highest rainfall totals near 1,000 mm (39.3 inches) in a small area of South Carolina and rainfall between 700 and 900 mm (27.5 and 37.4 inches) over a large area of South Carolina. Credits: SSAI/NASA/JAXA, Hal Pierce
See below ground level images and videos of storm devastation
Story updated with additional details/imagery from NASA and South Carolina
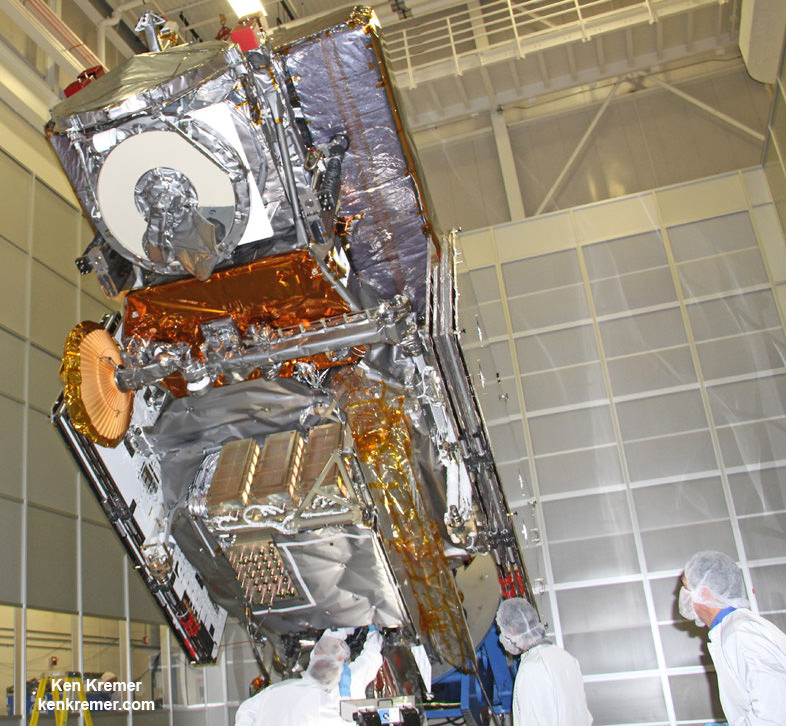
NASA’s advanced Global Precipitation Measurement (GPM) weather satellite is continuously tracking and recording the ‘1000 Year’ rainfall event heaping death and devastation across wide areas of South Carolina from the combined actions of a freak Nor’easter and Hurricane Joaquin – which reached a borderline Cat 5 status on Saturday, Oct. 3 with winds of 150 mph.
South Carolina Gov. Nikki Haley declared the historic and torrential rain fall to be a “1000 Year event” on Sunday, Oct. 4. “We have never seen anything like this.” Governor Haley and President Obama issued a “State of Emergency.”
Although the horrendous rains in South Carolina may nearly be done, the nor’easter caused damage estimated to be in the Billions of Dollars and at least 9 storm related deaths as of today, Monday, Oct. 5.
Rainfall totals ranging from 14 to 37 inches in local areas over the past week drenched a wide swath of the Palmetto state with never before seen flooding, according to NASA and NOAA. The most intense periods of rain fell over the weekend.
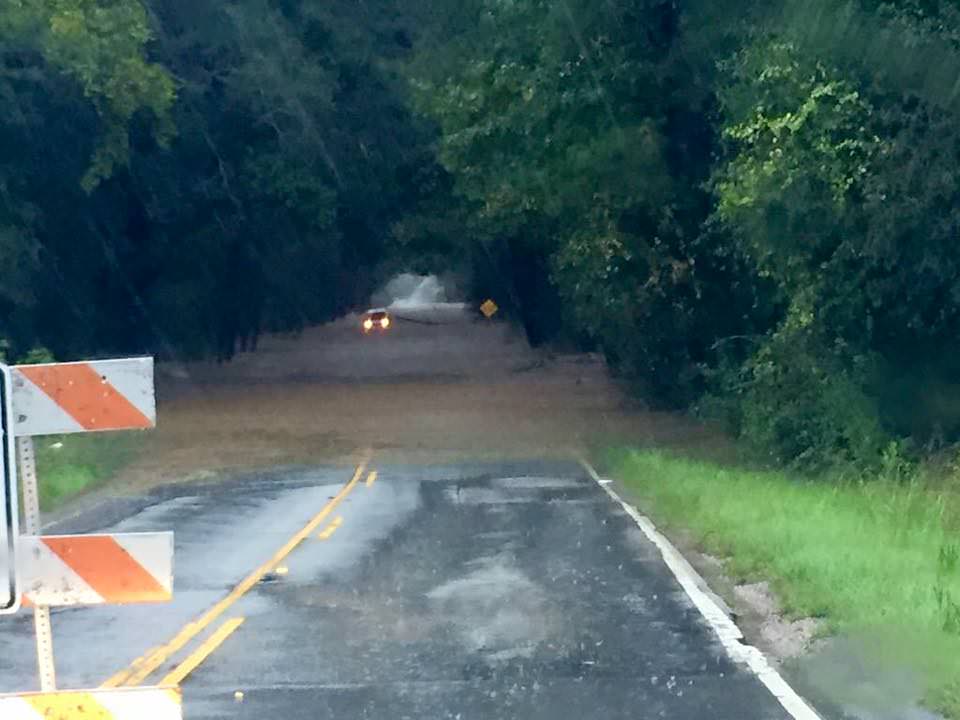
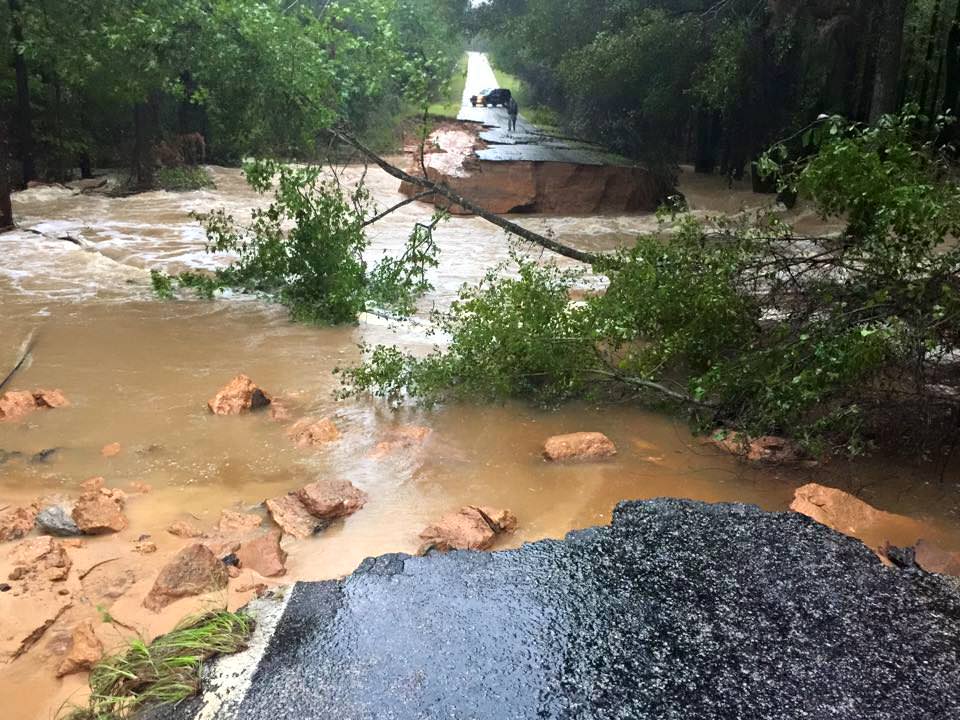
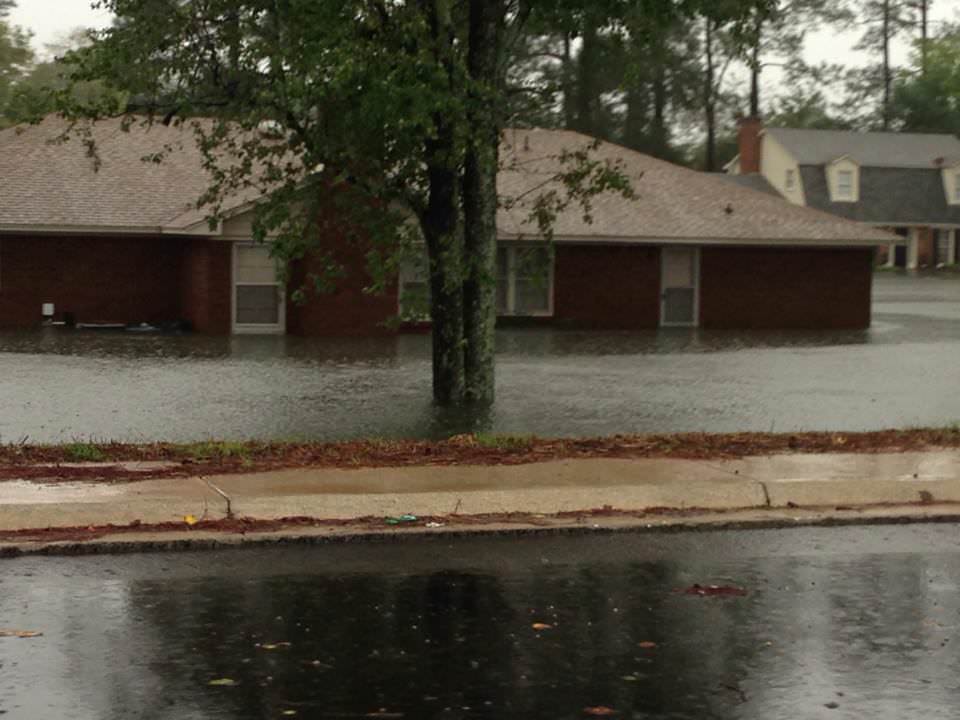
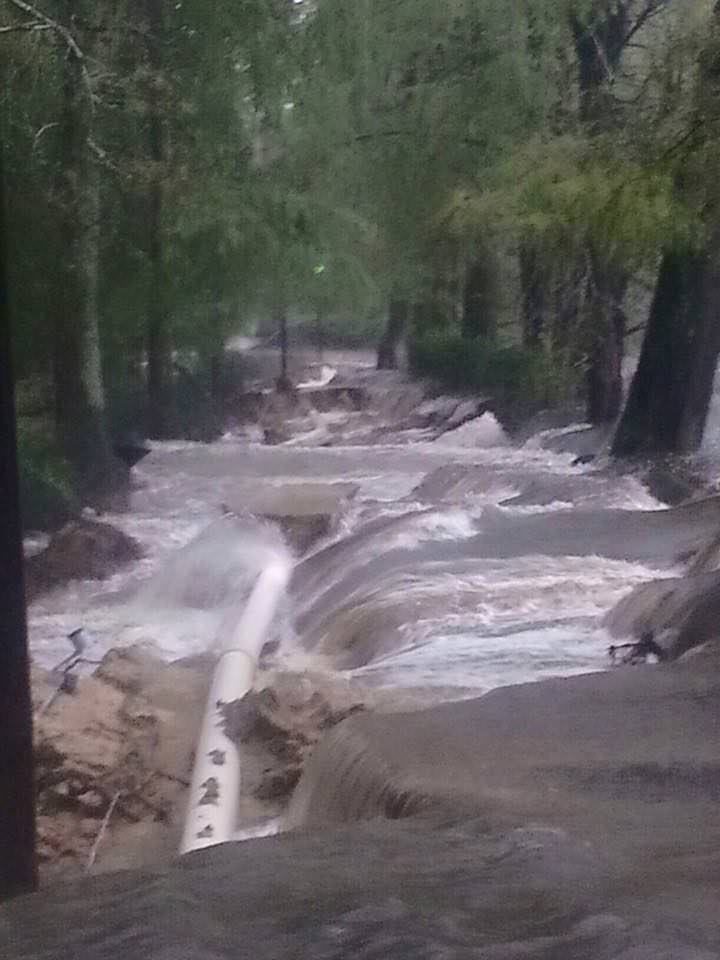
See herein a gallery of photos from friends and others living through the disaster in South Carolina.
NASA astronaut Scott Kelly also captured dramatic images of Hurricane Joaquin – as I reported earlier here.
A slew of NASA and NOAA orbiting weather satellites are constantly tracking the fierce storms and providing the state and federal governments with the most up to date forecasts to aid officials and emergency responders in evaluating and managing the disaster in the most effective manner possible.
NASA’s GPM and a global fleet of other international weather monitoring satellites gathered measurements every 30 minutes from September 26 to October 5, 2015 that were combined into the eyepoppongly dramatic IMERG (Integrated Multi-satellitE Retrievals for GPM) color-coded video above. It tracks the massive growth, spread and direction of the storms and shows the historic levels of destructive precipitation generated by the lethal pair of powerful storms.
The NASA GPM video shows plumes of moisture from the Nor’Easter and Hurricane Joaquin as they gather force and moved over South Carolina and through the Caribbean around and over the Bahamas and later as Joaquin fortunately veered away from the US eastern seaboard towards Bermuda.
“The IMERG showed highest rainfall totals near 1,000 mm (39.3 inches) in a small area of South Carolina and rainfall between 700 and 900 mm (27.5 and 37.4 inches) over a large area of South Carolina,” says NASA’s Hal Pierce.
Here’s a NASA video with NASA scientist Dalia Kirschbaum describing how GPM can see inside a hurricane to makes rainfall and precipitation measurements in 3D:
Video caption: NASA scientist Dalia Kirschbaum explains how the Global Precipitation Measurement Mission’s Core observatory has an instrument that can see layer by layer through a storm.
The GPM precipitation measurements come from both of its advanced radar instruments – the dual-frequency precipitation (DPR) radar instrument (Ku and Ka band) and the GPM microwave imager (GMI), NASA scientist George Huffman told Universe Today.
The IMERG video is based on an algorithm that also carefully combines and calibrates measurements gathered every 30 minutes from the passive microwave sensors flying aboard a large international constellation of satellites from the US, Europe, Japan and India – and outlined in complete detail further below by NASA’s Huffman and Kirschbaum; exclusively for Universe Today.
The visualization of data was created by NASAs Goddard’s Space Flight Center and shows Hurricane Joaquin around the Bahamas “when it was a tropical storm. Red and green colors show rain and the ice and snow at the top of the storm is visualized in blue.”
“Understanding hurricane structure helps weather forecasters around the world determine a storm’s structure and where it may be going,” says Kirschbaum.
Hurricane Joaquin was still packing winds exceeding 125 mph this morning, but it has lost strength throughout the day.
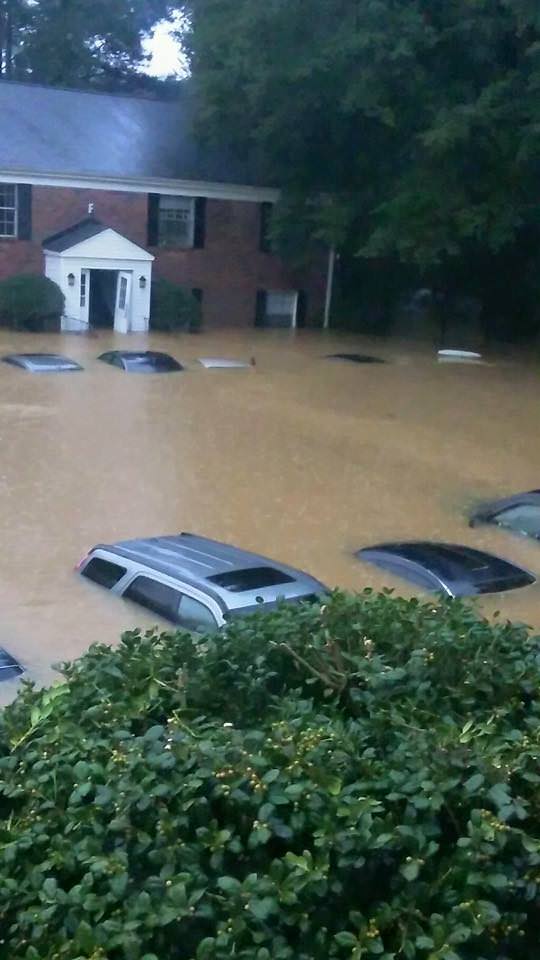
Over 40,000 homes and businesses are without power today, Oct. 5, in South Carolina due to the unending rain and widespread catastrophic flooding. And many folks had to be evacuated.
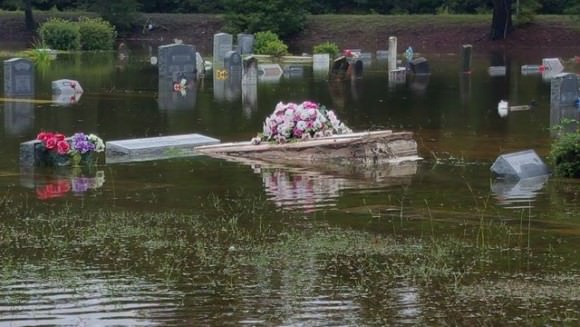
Some cemeteries were uprooted with caskets seen floating down flooded streets.
Residents are warned to stay out of the flood waters and standing waters that can be carrying bacteria and diseases presenting a significant health hazard.
In the capitol city of Columbia, there was widespread flooding with severe damage to water mains that cut off drinking water to over 15,000 people.
The governor deployed over 1300 national guard troops to render assistance. Over 150 folks were rescued by helicopter, some from the rooftops of their homes and apartments.
Here’s a helicopter rescue:
Video: Helicopter Rescue at Lakewood Links in Sumter, SC on Oct 4, 2014. Credit: Sean Reyes
Scores of South Carolina residents were getting rescued by canoes and even boats where waters surged in places up to 25 feet above normal.
At least 9 dams have been breached statewide, as well as levees, requiring many thousands people more to be evacuated.
Governor Haley confirmed that over 550 roads were either closed, damaged or destroyed, including back roads and major interstate highways vital to the states and US national economy.
A 70 mile stretch of I-95, a major north-south artery traveled by millions including myself, was closed to all traffic on Sunday and remains closed today. And many side roads that could serve as potential detours are also closed.
Historically high water levels in some of the areas worst hit by flooding has finally receded. But in other areas water levels are rising.
In addition, the US Coast Guard says the cargo ship ‘El Faro’ with 33 people aboard is believed to have sunk because it ventured straight into Hurricane Joaquin. The ship’s crew included 28 Americans and 5 Polish sailors. It sank in the area popularly known as the ‘Bermida Triangle’ in water some 3 miles deep.
Today, the Coast Guard reported the discovery of a debris field over 25-square-miles wide. At least one crew member has already been found dead.
The El Faro set out from the port of Jacksonville on Tuesday when Joaquin was a tropical storm with 85 mph wind speed.
The last distress call on last Thursday morning, as the ship neared the eye of the Hurricane, then a Category 3. The ship was listing over 15 degrees surrounded by 30 foot high waves.
The hurricane quickly grew into a Cat 4 and no further word was heard from the ship. It may be 3 miles underwater at the bottom of the Atlantic Ocean.
How and from which fleet of satellites does NASA obtain the orbital measurements used to create the high resolution, color-coded GPM IMERG visualizations?
“The Integrated Multi-satellitE Retrievals for GPM (IMERG) creates a merged precipitation product from the GPM constellation of satellites. These satellites include DMSPs from the U.S. Department of Defense, GCOM-W from the Japan Aerospace Exploration Agency (JAXA), Megha-Tropiques from the Centre National D’etudies Spatiales (CNES) and Indian Space Research Organization (ISRO), NOAA series from the National Oceanic and Atmospheric Administration (NOAA), Suomi-NPP from NOAA-NASA, and MetOps from the European Organisation for the Exploitation of Meteorological Satellites (EUMETSAT),” NASA scientists George Huffman and Dalia Kirschbaum told me exclusively for Universe Today.
“All of the instruments (radiometers) onboard the constellation partners are intercalibrated with information from the GPM Core Observatory’s GPM Microwave Imager (GMI) and Dual-frequency Precipitation Radar (DPR). The data are gridded at 0.1°x0.1° lat./lon and provided in 30 minute time slices through morphing between satellite overpasses. The satellite estimates are then calibrated with rainfall gauge information.”
Here’s another GPM visualization of Hurricane Joaquin:
Stay tuned here for Ken’s continuing Earth and planetary science and human spaceflight news.

More storm photos: