Antarctic Sea Ice Takes Over More Of The Ocean Than Ever Before

Antarctica's sea ice on Sept. 22, 2013. Scientists say there was more ice on the ocean then than in any time in recorded satellite history. Data came from the Advanced Microwave Scanning Radiometer 2 (AMSR2) sensor on Japan’s Global Change Observation Mission 1st-Water (GCOM-W1) satellite. You can see the land in dark gray and ice shelves in light gray. The yellow line represents the average distribution of sea ice between 1981 and 2000. Credit: NASA/Jesse Allen, using data from the Advanced Microwave Scanning Radiometer 2 (AMSR2) sensor on the Global Change Observation Mission 1st-Water (GCOM-W1) satellite.

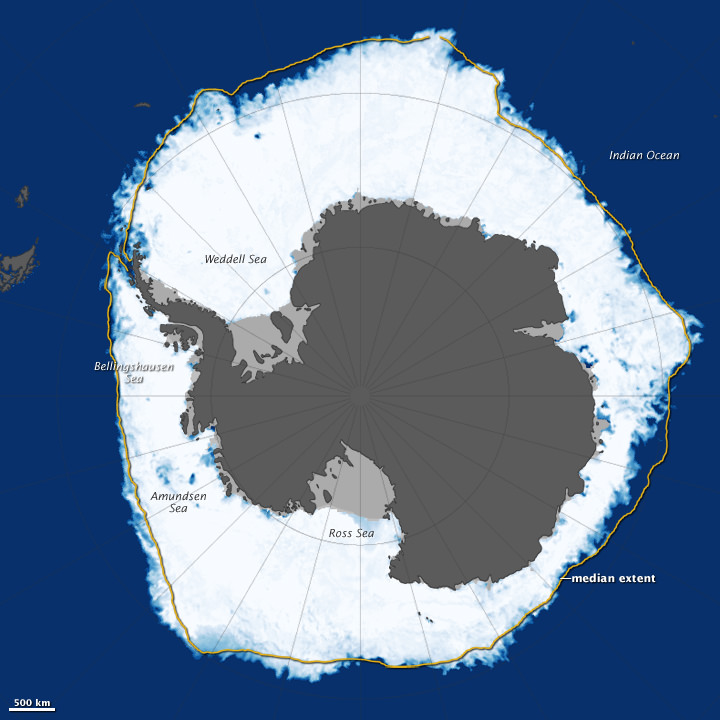
Antarctica’s sea ice is creeping further out in the ocean! New data from a Japanese satellite shows that sea ice surrounding the southern continent in late September reached out over 7.51 million square miles (19.47 million square kilometers).

The extent — a slight increase over 2012’s record of 7.50 million square miles (19.44 million square km) — is the largest recorded instance of Antarctica sea ice since satellite records began, NASA said. Data was recorded using the Advanced Microwave Scanning Radiometer 2 (AMSR2) sensor on the Global Change Observation Mission 1st-Water (GCOM-W1) satellite.

“While researchers continue to study the forces driving the growth in sea ice extent, it is well understood that multiple factors—including the geography of Antarctica, the region’s winds, as well as air and ocean temperatures—all affect the ice,” NASA stated.

Update — see below for a more detailed description of why this is an important clue that climate change IS happening.

“Geography and winds are thought to be especially important. Unlike the Arctic, where sea ice is confined in a basin, Antarctica is a continent surrounded by open ocean. Since its sea ice is unconfined, it is particularly sensitive to changes in the winds. As noted by the National Snow and Ice Data Center, some research has suggested that changes in Antarctic sea ice are caused in part by a strengthening of the westerly winds that flow unhindered in a circle above the Southern Ocean.”

For those thinking that increased sea ice means we can relax about climate change, this humorous video explains the difference between land ice (glaciers) and sea ice (which is generated from snow, rainfall and fresh water). It’s definitely worth four minutes of your time. The part about sea ice starts around 2:45.

UPDATE: Just to clarify:

Here’s what the graphic says: “The water around Antarctica is more fresh than it has been in previous years because of increased snow and rainfall as well as in increased contribution of fresh water from melting land ice. This fresh cold water is less dense than the warmer, saltier water below. Previously, that warm salty water would rise, melting the sea ice. But now, bcaus of the lighter fresh water on top, there is less mixing of the ocean’s layer and the surface stays cooler longer. “

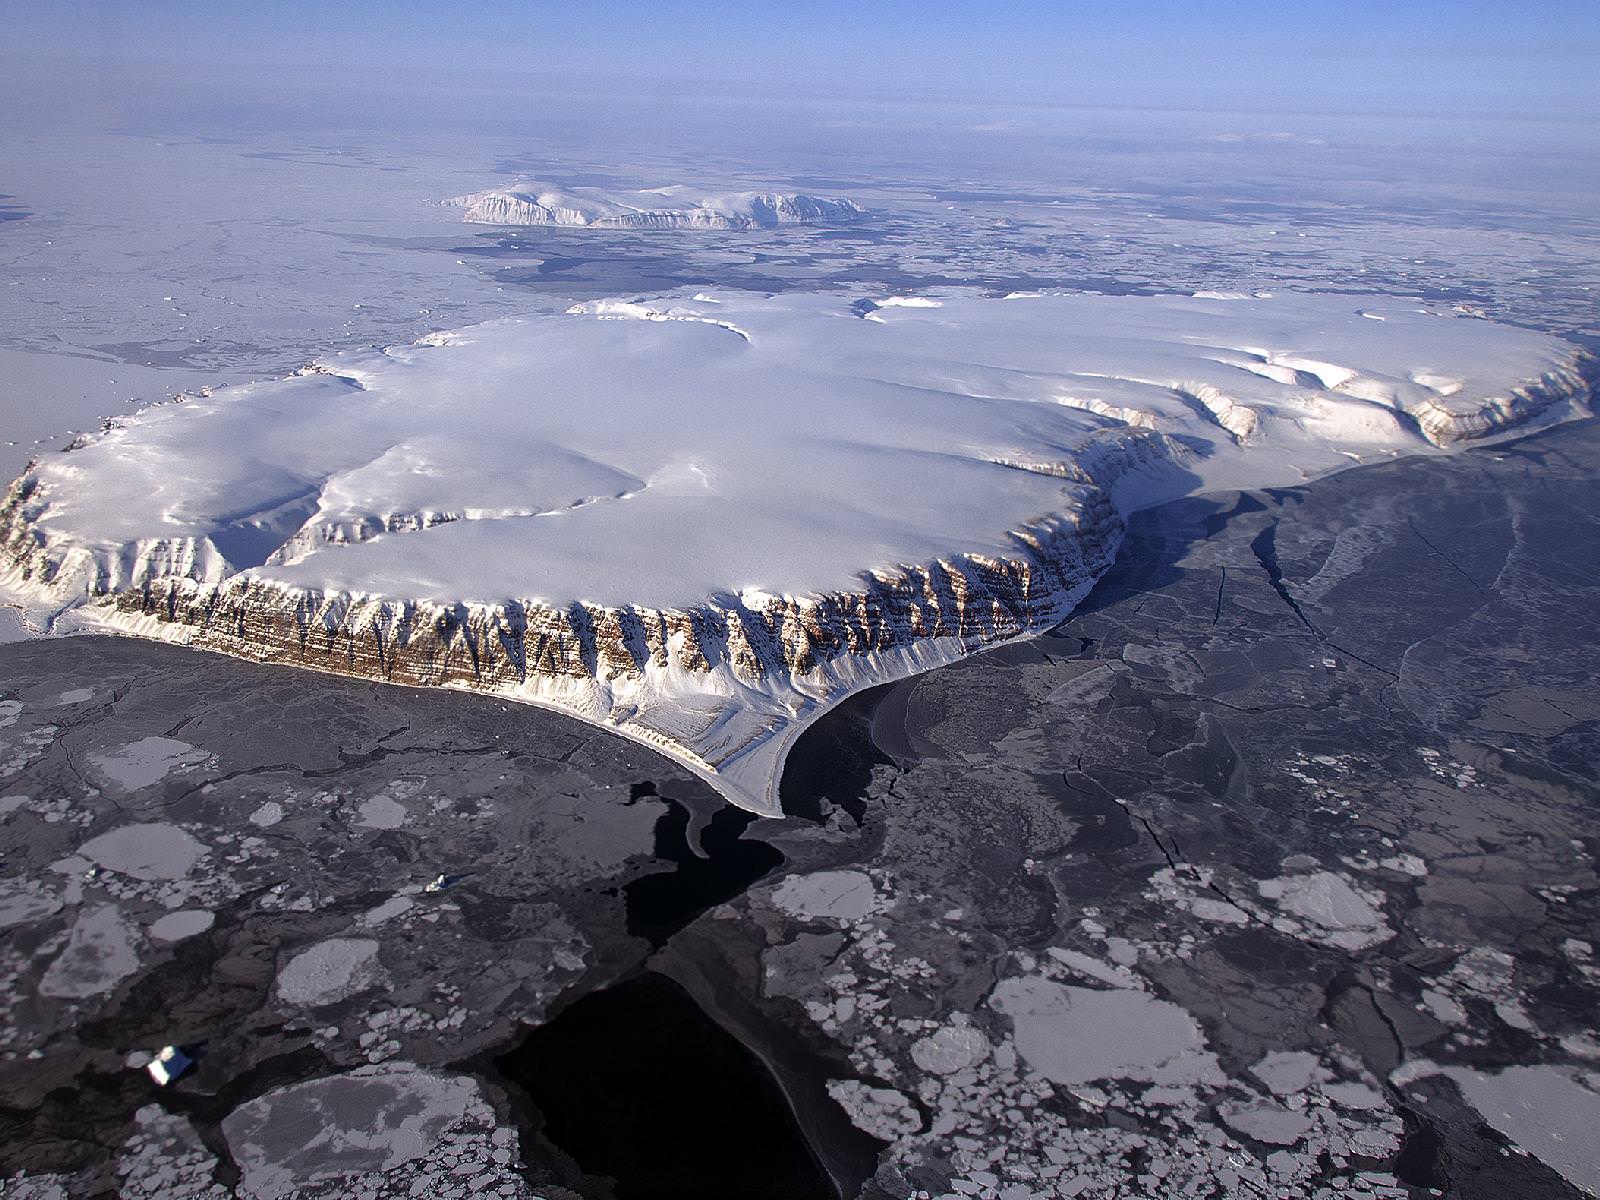
And so, there is increased fresh water because of the melting land ice – due to climate change. There is a fundamental difference between sea ice and land ice. Antarctic land ice is the ice which has accumulated over thousands of years on the Antarctica landmass through snowfall. Antarctic sea ice is entirely different as it is ice which forms in salt water during the winter and almost entirely melts again in the summer.

Importantly, when land ice melts and flows into the oceans global sea levels rise on average; when sea ice melts sea levels do not change measurably but other parts of the climate system are affected, like increased absorption of solar energy by the darker oceans.

See this article on SkepticalScience for additional information.

Source: NASA Earth Observatory

NASA Scientists Soar Over a Mini Ice Cap

Saunders Island and Wolstenholme Fjord with Kap Atholl in the background photographed during a NASA IceBridge flight. (NASA/Michael Studinger)

It’s quite a long way from Mars, but I can’t help but be reminded of the Red Planet’s ice-covered north pole when looking at this photo taken by Michael Studinger earlier this month, during a recent IceBridge survey flight over Greenland.

Called Saunders Island (also Appat Island) the 82-square-mile frozen slab of rock rises from the sea off the coast of northwestern Greenland, one of many islands within the Wolstenholme (Uummannaq) Fjord on the shore of Baffin Bay. Operation IceBridge, a six-year aerial survey of the changing ice coverage at our planet’s poles, is run by NASA to provide valuable ground-level information to supplement satellite data.

To me, the shape of the island’s steep rock faces and rugged inlets slice into its interior bear a striking resemblance to Mars’ ice cap.

Mars' north polar ice cap
Mars’ north polar ice cap

While Mars’ ice cap is shaped by very different processes — and obviously much bigger — you might see the connection too!

But rather than dark Martian dunes, sea ice can be seen surrounding the islands in varying thicknesses in the IceBridge photo above. Sea ice coverage in the fjord ranges from thicker, white ice in the background to thinner “grease” ice and leads with dark, open ocean water in the foreground.

The IceBridge P-3B airborne laboratory in a hangar at Wallops Flight Facility (NASA/George Hale)

As the amount of darker, ice-free water surfaces increase over the course of the year due to rising global temperatures, the more heat from solar radiation is collected in the ocean — thus speeding up the process of seasonal sea ice loss and overall Arctic warming.

Read more about the IceBridge mission here, and see a collection of more photos from this season’s flights here.

NASA’s Operation IceBridge images Earth’s polar ice in unprecedented detail to better understand processes that connect the polar regions with the global climate system. IceBridge utilizes a highly specialized fleet of research aircraft and the most sophisticated suite of innovative science instruments ever assembled to characterize annual changes in thickness of sea ice, glaciers, and ice sheets. In addition, IceBridge collects critical data used to predict the response of earth’s polar ice to climate change and resulting sea-level rise.