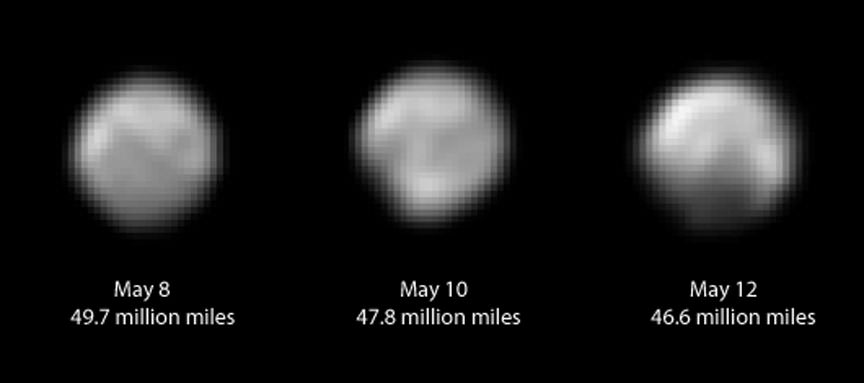
These images show Pluto in the latest series of New Horizons Long Range Reconnaissance Imager (LORRI) photos, taken May 8-12, 2015. Hints of possible complex surface geology and the polar cap first seen in April are visible. Credit: NASA
Hey Pluto, it’s great to see your face! Since sending its last batch of images in April, NASA’s New Horizons probe lopped off another 20 million miles in its journey to the mysterious world. Among the latest revelations: the dwarf planet displays a much more varied surface and the bright polar cap discovered earlier this spring appears even bigger.
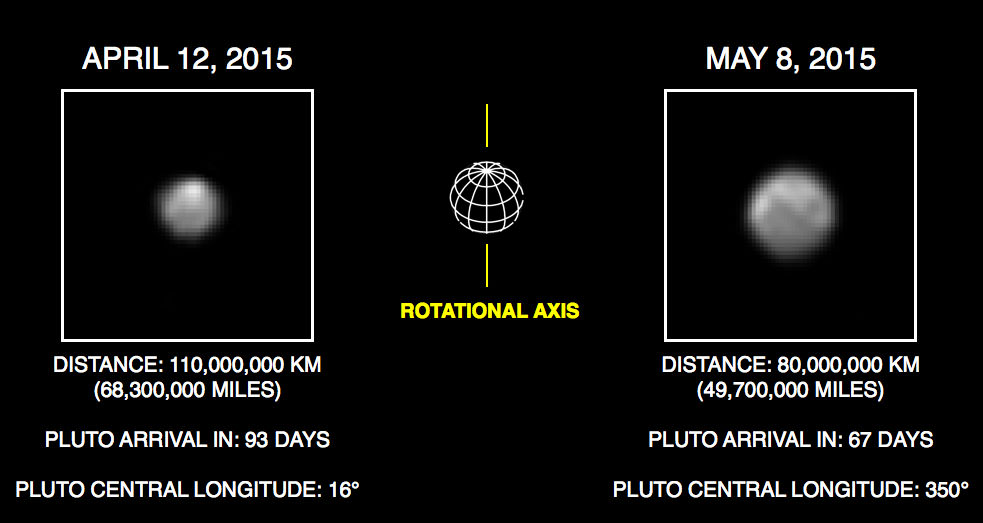
Comparison of the April image of one hemisphere of Pluto with the same hemisphere photographed in May. The photos have been rotated to align Pluto’s rotational axis with the vertical direction (up-down), as shown schematically in the center panel. Between April and May, Pluto grew larger as the spacecraft got closer, with Pluto’s apparent size increasing by approximately 50%. Pluto rotates around its axis every 6.4 Earth days; this and the images below show the variations in Pluto’s surface features during its rotation. Credit: NASA
“These new images show us that Pluto’s differing faces are each distinct; likely hinting at what may be very complex surface geology or variations in surface composition from place to place,” said New Horizons Principal Investigator Alan Stern, of the Southwest Research Institute in Boulder, Colorado.
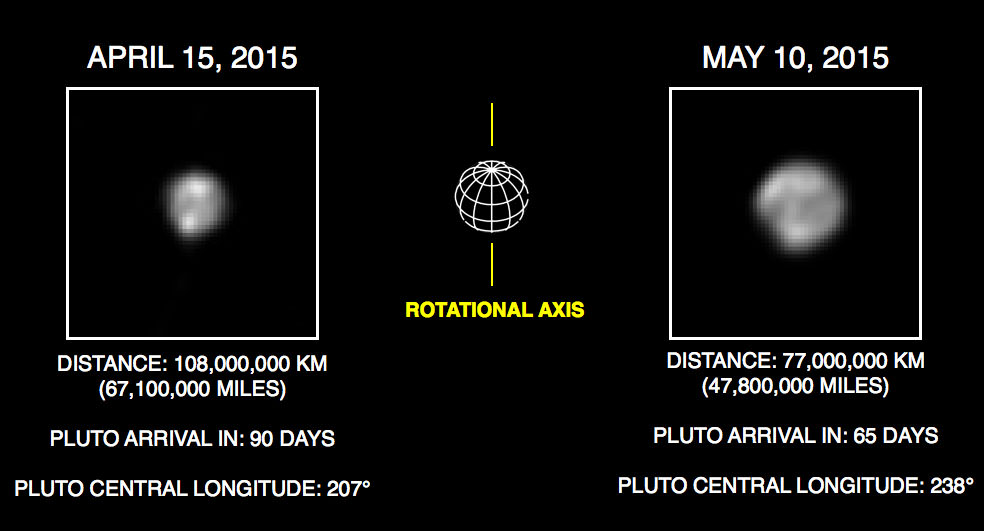
Compare Pluto’s polar cap (white spot at top of the globe), first seen in April (left) with the latest image taken on May 10. Approximately the same face of Pluto is shown in both images. The cap’s extent varies with longitude. Credit: NASA
Mission scientists caution against over-interpreting some of the smaller details. The photos have been processed using a method called deconvolution, which strips away the out-of-focus information to enhance features on Pluto. Deconvolution can occasionally add “false” details or artifacts, so the smallest features in these pictures will need to be confirmed by images taken from closer range in the next few weeks.
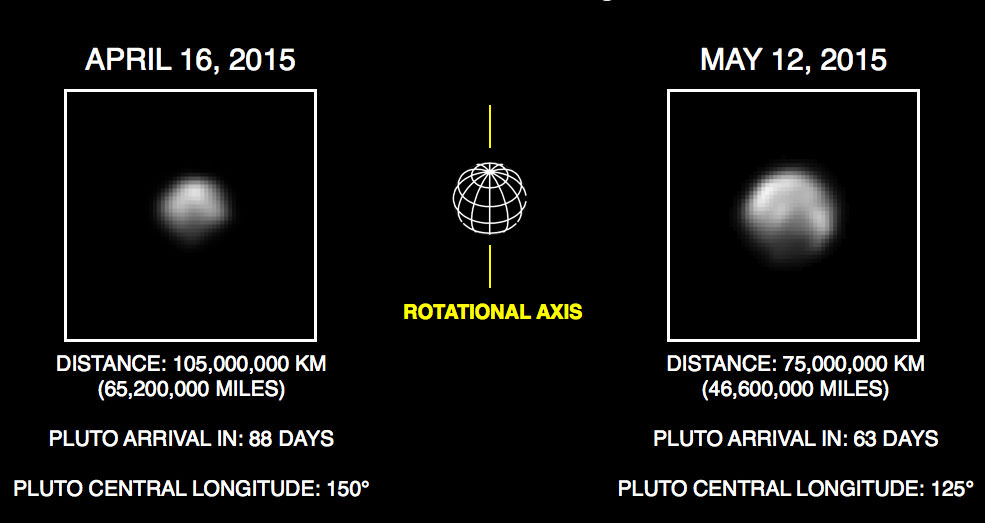
Pluto compared on April 16, 2015 and May 12. Credit: NASA
Compared to recent photos of Ceres, the other dwarf planet in the limelight this season, Pluto shows only light and dark blotches. That’s how Ceres started out too. All those variations in tone and texture suggest a fascinating and complex surface. And it’s clear that the polar cap — whatever it might ultimately be — is extensive and multi-textured. The images were taken from a little less than 50 million miles (77 million km) away or about the same distance Mars is from Earth during a typical opposition.
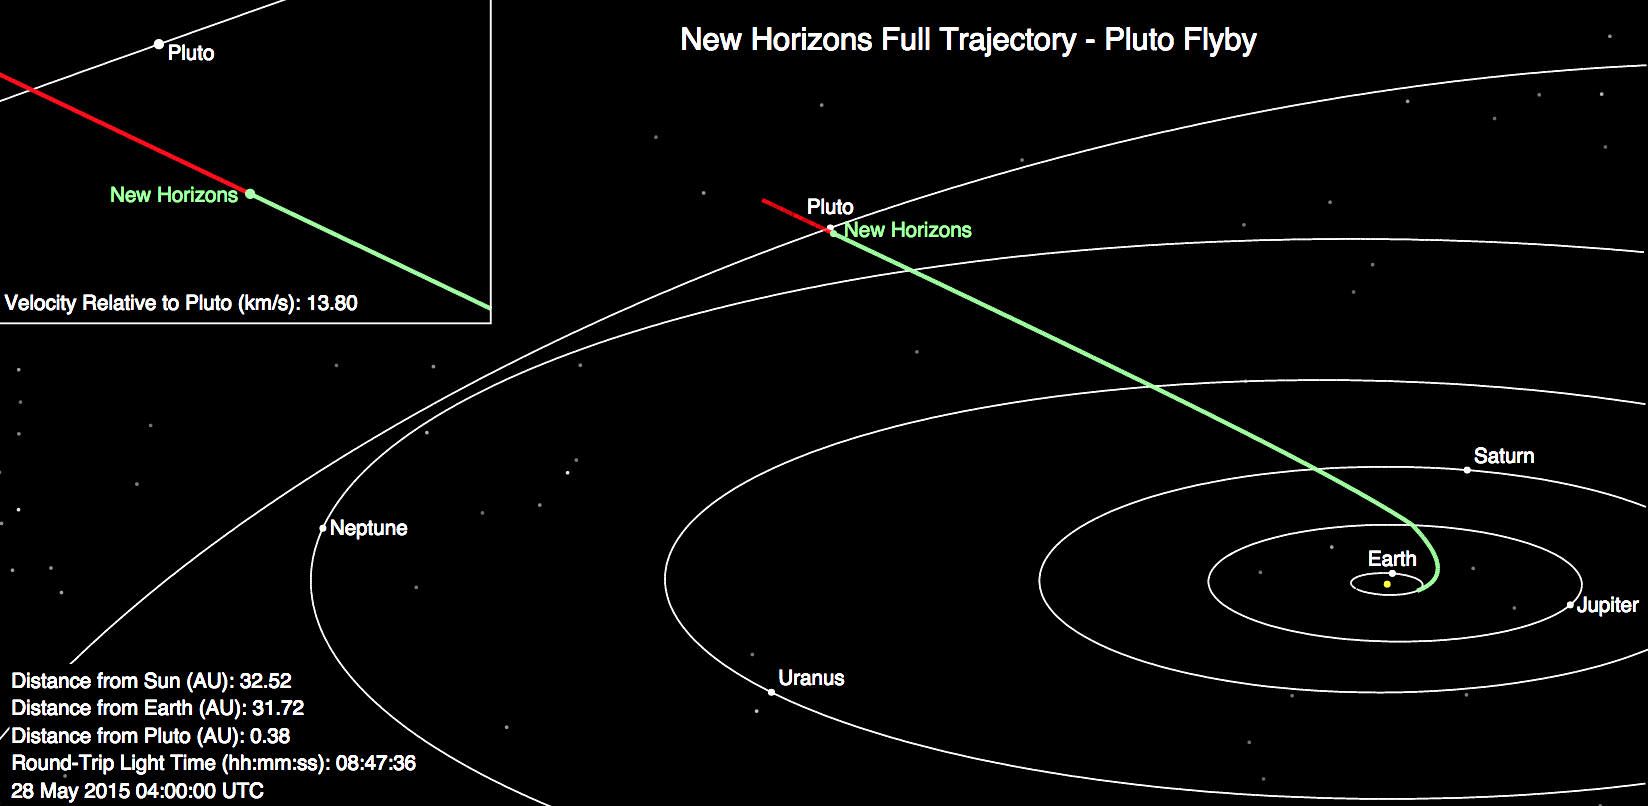
New Horizons current position and particulars on May 28, 2015. Credit: NASA
Watch for dramatic improvements in the images as New Horizons speeds toward its target, covering 750,000 miles per day until closest approach on July 14. By late June, they’ll have four times the resolution; during the flyby that will improve to 5,000 times. The spacecraft is currently 2.95 billion miles from Earth. Light, traveling at 186,00o miles per second, requires 8 hours and 47 minutes – the length of a typical work day – to make the long round trip.
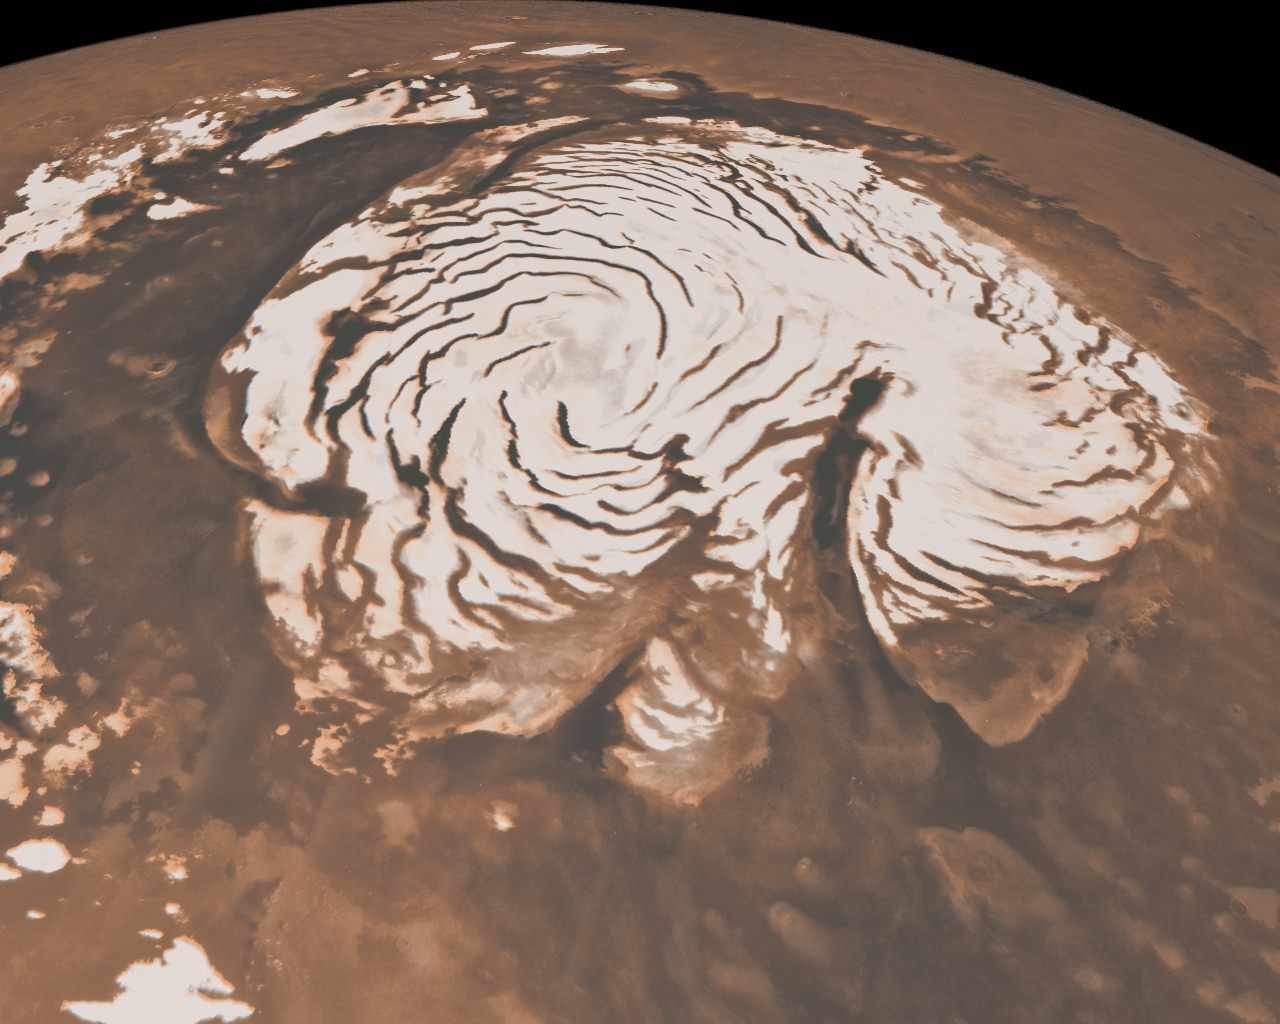
The spiral troughs and gian canyon Chasma Borale have puzzled scientists for 40 years.
[/caption]
The shape of the two-mile-tall Texas-sized ice cap at the north pole of Mars has puzzled scientists for forty years, but new results to be published in a pair of papers in the journal Nature on May 27 have put the controversy to rest.
The polar caps of Mars have been known since the first telescopic views of the planet, but early spacecraft images revealed that the north polar cap is scored by enigmatic troughs that spiral out from its center, as well as a chasm larger than the Grand Canyon. The origin of these features has been debated since they were first discovered in 1972.
One hypothesis to explain the giant canyon, called Chasma Boreale, is that volcanic heat melted the ice and caused a catastrophic flood that formed the chasm. Other scientists have suggested that wind sweeping downhill from the top of the cap carved Chasma Boreale from the ice.
Multiple explanations have been suggested for the spiral troughs too. One explains the troughs as fractures caused by the flow of ice from the pole. Another uses a model to suggest that the troughs are the natural result of solar heating and lateral heat conduction in the ice.
The two new papers, led by Jack Holt and Isaac Smith of The University of Texas at Austin’s Institute for Geophysics, used data from the Shallow Subsurface Radar (SHARAD) on the Mars Reconnaissance Orbiter (MRO) to study the internal structure of the ice cap and discover the origin of the troughs and the chasm.
“SHARAD sends pulses of radio waves from orbit, 700 times per second,” Holt explained. “Some energy is reflected from the surface, and then from subsurface interfaces if the intervening material allows the radio waves to penetrate. Radar at this wavelength (about 20 meters) penetrates ice very well, and it has been used from airplanes on Earth to map large portions of Earth’s ice sheets.”
“By putting all of the reflections together one can make an image of what lies beneath the
surface,” Smith added.
Holt explained that the ability to map not only the surface features but also the internal structure of the ice cap “opens the door to better understand what we see on the surface by providing critical context in time.”
Top: An example SHARAD radar cross section of the martian north polar cap. Bottom: An annotated version of the same cross-section.
By mapping the three-dimensional structure of the north polar ice cap, Smith and Holt have determined that both the troughs and Chasma Boreale were formed by katabatic winds, which blow down from the top of the ice cap.
“We aren’t saying they were carved by wind, rather that wind had a strong role in their formation and evolution.” Holt said. “Chasma Boreale is an old feature that persisted because new ice did not accumulate there, likely due to persistent winds coming from the highest point on the ice cap.”
Holt also discovered evidence for another old canyon that has been completely filled in over time. “No evidence remains on the surface to indicate that it was there previously,” Holt said. “We can map it in the radar data, however.”
The spiral troughs likewise are controlled by the wind. “The radar layers we see show evidence for wind transport because they vary in thickness and elevation [across the troughs],” Smith, lead author of the trough paper, explained. “The wind moves across the trough instead of through it [and] moves ice from the upwind side (thereby thinning they layer) to the downwind side (adding more to the existing layer).”
This causes the spiral troughs to migrate upwind over time, a phenomenon first proposed by Alan Howard, a researcher at the University of Virginia, in 1982. “Many people proposed other hypotheses suggesting he was wrong,” Smith said. “But when you look at a hypothetical cross section from his paper, it looks almost exactly like what we see in the radar data. We were amazed at how accurate Alan Howard predicted what we would
see.”
The troughs are spiral shaped due to the planet’s rotation. As the katabatic winds blow from the center of the cap down to lower latitudes they are twisted by the same “coriolis force” that causes hurricanes to spiral on the Earth.
The layers that Holt and Smith mapped using radar data also suggest that ice flows are much rarer on Mars than they are on Earth. The lack of flows means that the polar ice on Mars preserves more complex layers than expected. “This complexity provides very specific constraints on the climatic processes responsible for [the layers],” Holt said. “We will eventually be able to reconstruct winds and accumulation patterns across the polar cap and through time.”
Holt plans to use the ancient polar landscapes inferred from the SHARAD data along with simulations of the martian climate to model the formation of the polar cap. “If we can recreate the major features such as Chasma Boreale [in the models], then we will have learned a great deal about climate on Mars during that period.”
Smith and Holt also plan to study the effect of Mars’ tilt on the formation of the ice cap. “Because Mars’ orbit and tilt change so much with respect to the sun, it would be nice to see how that has affected deposition of ice on the cap. This requires much more mapping, and we have already begun that process,” Smith said.
“There is still much research to do on Mars,” Smith said. “The planet has a lot of mysteries, some of which we haven’t even found yet.”