This screenshot is from NASA's new global CO2 visualization. Image Credit: NASA/SVS
Our CO2 emissions are warming the planet and making life uncomfortable and even unbearable in some regions. In July, the planet set consecutive records for the hottest day.
NASA is mapping our emissions, and while what they show us isn’t uplifting, it is visually appealing in a ghoulish way. Maybe the combination of visual appeal and ghoulishness will build momentum in the fight against climate change.
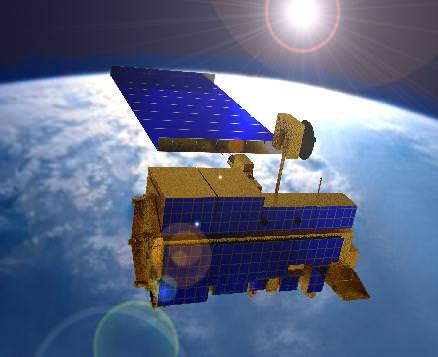
Sensors aboard NASA’s Terra satellite are aiding the search for MH 370. Credit: NASA
NASA has actively joined the hunt for the missing Malaysian Airline flight MH-370 that mysteriously disappeared without a trace more than two weeks ago on March 8, 2014.
Sensors aboard at least two of NASA’s unmanned Earth orbiting global observation satellites as well as others flying on the manned International Space Station (ISS) are looking for signs of the jetliner that could aid the investigators from a multitude of nations and provide some small measure of comfort to the grieving families and loved ones of the passengers aboard.
“Obviously NASA isn’t a lead agency in this effort. But we’re trying to support the search, if possible,” Allard Beutel, NASA Headquarters, Office of Communications director, told Universe Today this evening.
NASA’s airplane search assistance comes in two forms; mining existing space satellite observing data and retargeting space based assets for new data gathering since the incident.
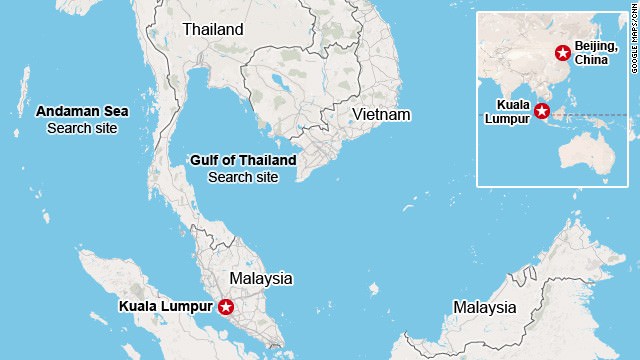
The Malaysian Airline Boeing 777-2H6ER jetliner went missing on March 8 while cruising en route from Kuala Lampur, Malaysia to Beijing, China. See cockpit photo below.
Accurate facts on why MH-370 vanished with 239 passengers aboard have sadly been few and far between.
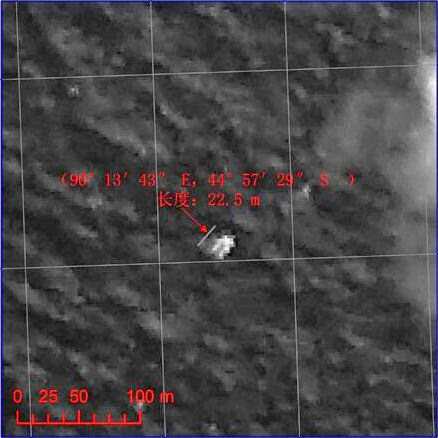
Chinese satellite image of possible debris of MH 370. Credit: China/SASTIND
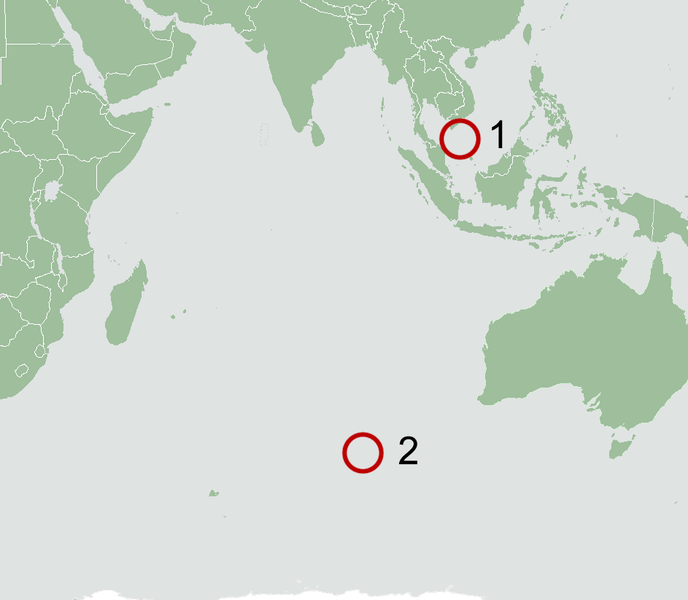
Last week, the search area shifted to a wide swath in the southern Indian Ocean when potential aircraft debris was spotted in a new series of separate satellite images from Australia and China government officials.
A prior set of official Chinese government satellite images at a different location yielded absolutely nothing.
The area is now focused 2,500 km (1,600 mi) south west of Perth, a city on the western coast of Australia.
NASA’s search support was triggered upon activation of the International Charter on Space and Major Disasters.
Available data from NASA’s Terra and Aqua satellites has already been transmitted to the U.S. Geological Survey and new data are now being collected in the search area.
“In response to activation of the International Charter on Space and Major Disasters last week regarding the missing Malaysia Airlines jetliner, NASA sent relevant space-based data to the U.S. Geological Survey’s Earth Resources Observations and Science Hazard Data Distribution System that facilitates the distribution of data for Charter activations,” according to a NASA statement.
And it’s important to note that NASA satellites and space-based cameras are designed for long-term scientific data gathering and Earth observation.
“They’re really not meant to look for a missing aircraft,” Beutel stated.
“The archive of global Earth-observing satellite data is being mined for relevant images. These include broad-area views from the MODIS [instrument] on NASA’s Terra and Aqua satellites,” Beutel informed me.
The next step was to retarget both satellites and another high resolution camera aboard the ISS.
“In addition, two NASA high-resolution assets have been targeted to take images of designated search areas: the Earth Observing-1 satellite and the ISERV camera on the International Space Station,” Beutel explained.
Sensors aboard NASA’s Aqua satellite are aiding the search for MH 370. Credit: NASA
Aqua and Terra were already gathering new observations with the MODIS instrument in the search area off Australia last week. MODIS measures changes in Earth’s cloud cover.
Here are the satellite observation times and capabilities:
• MODIS on the Aqua satellite observed at about 1:30 p.m. local time as it passes overhead from pole-to-pole
• MODIS on the Terra satellite observed at about 10:30 a.m. local time
• The width (field of view) of a MODIS observation is 2,300 kilometers
• One pixel of a MODIS image – the limit of how small a feature it can see – is about 1 kilometer.
A new set of high resolution Earth imaging cameras are being sent to the ISS and are loaded aboard the SpaceX CRS-3 Dragon resupply capsule now slated for blastoff on March 30.
The newly launchedNASA/JAXAGPM precipitation monitoring satellite which will cover this ocean area in the future is still in the midst of science instrument checkout.
The International Space Station (ISS) in low Earth orbit. Credit: NASA
Ships and planes from at least 26 countries have been being dispatched to the new based on the new satellite imagery to search for debris and the black boxes recording all the critical engineering data and cockpit voices of the pilot and copilot and aid investigators as to what happened.
No one knows at this time why the Malaysia Airlines flight mysteriously disappeared.
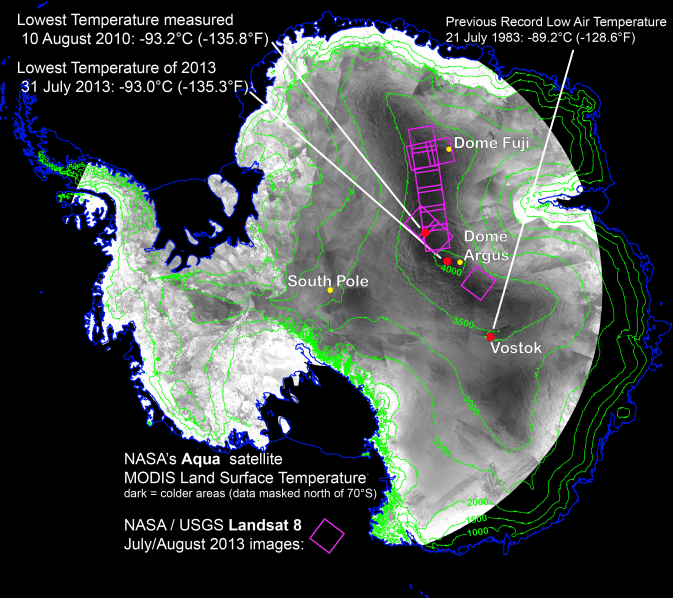
With remote-sensing satellites, scientists have found the coldest places on Earth, just off a ridge in the East Antarctic Plateau. The coldest of the cold temperatures dropped to minus 135.8 F (minus 93.2 C) -- several degrees colder than the previous record.
Image Credit: Ted Scambos, National Snow and Ice Data Center.
What is the coldest place on Earth? Scientists say it’s a place so cold that ordinary mercury or alcohol thermometers won’t work there. If you were there, every breath would be painful, your clothing would crackle every time you moved, and if you threw hot water into the air, it would fall to the ground as tiny shards of ice. At this place, the new record of minus 136 F (minus 93.2 C) was set on Aug. 10, 2010. Researchers analyzed data from several satellite instruments and found the coldest place on Earth in the past 32 years is … a high ridge in Antarctica between Dome Argus and Dome Fuji, two summits on the ice sheet known as the East Antarctic Plateau. Temperatures in several hollows were found to dip to the new record.
“We had a suspicion this Antarctic ridge was likely to be extremely cold,” said Ted Scambos, from the National Snow and Ice Data Center in Boulder, Colorado. “With the launch of Landsat 8, we finally had a sensor capable of really investigating this area in more detail.”
This beats out the previous low of minus 128.6 F (minus 89.2 C), set in 1983 at the Russian Vostok Research Station in East Antarctica. The coldest permanently inhabited place on Earth is northeastern Siberia, where temperatures in the towns of Verkhoyansk and Oimekon dropped to a bone-chilling 90 degrees below zero Fahrenheit (minus 67.8 C) in 1892 and 1933, respectively.
Scambos and his team made the discovery while analyzing the most detailed global surface temperature maps to date, developed with data from remote sensing satellites. The new findings were reported at the American Geophysical Union meeting in San Francisco.
The pursuit to find the coldest place on Earth started when the researchers were studying large snow dunes, sculpted and polished by the wind, on the East Antarctic Plateau. When the scientists looked closer, they noticed cracks in the snow surface between the dunes, possibly created when wintertime temperatures got so low the top snow layer shrunk. This led scientists to wonder what the temperature range was, and prompted them to hunt for the coldest places using data from two types of satellite sensors.
They used data from the Moderate Resolution Imaging Spectroradiometer (MODIS) instruments on NASA’s Terra and Aqua satellites and the Advanced Very High Resolution Radiometer (AVHRR) on several National Oceanic and Atmospheric Administration satellites. These sensitive instruments can pick up thermal radiation emitted from Earth’s surface, even in areas lacking much heat.
Using these sensors to scan the East Antarctic Plateau, Scambos detected extremely cold temperatures on a 620-mile stretch of the ridge at high elevations between Argus and Fuji, and even colder temperatures lower elevations in pockets off the ridge. Then, with the higher resolution of the Thermal Infrared Sensor (TIRS) aboard Landsat 8, the research team pinpointed the record-setting pockets.
The team compared the sites to topographic maps to explore how it gets so cold. Already cold temperatures fall rapidly when the sky clears. If clear skies persist for a few days, the ground chills as it radiates its remaining heat into space. This creates a layer of super-chilled air above the surface of the snow and ice. This layer of air is denser than the relatively warmer air above it, which causes it to slide down the shallow slope of domes on the Antarctic plateau. As it flows into the pockets, it can be trapped, and the cooling continues.
“By causing the air to be stationary for extended periods, while continuing to radiate more heat away into space, you get the absolute lowest temperatures we’re able to find,” Scambos said. “We suspected that we would be looking for one magical site that got extremely cold, but what we found was a large strip of Antarctica at high altitude that regularly reached these record low temperatures.”
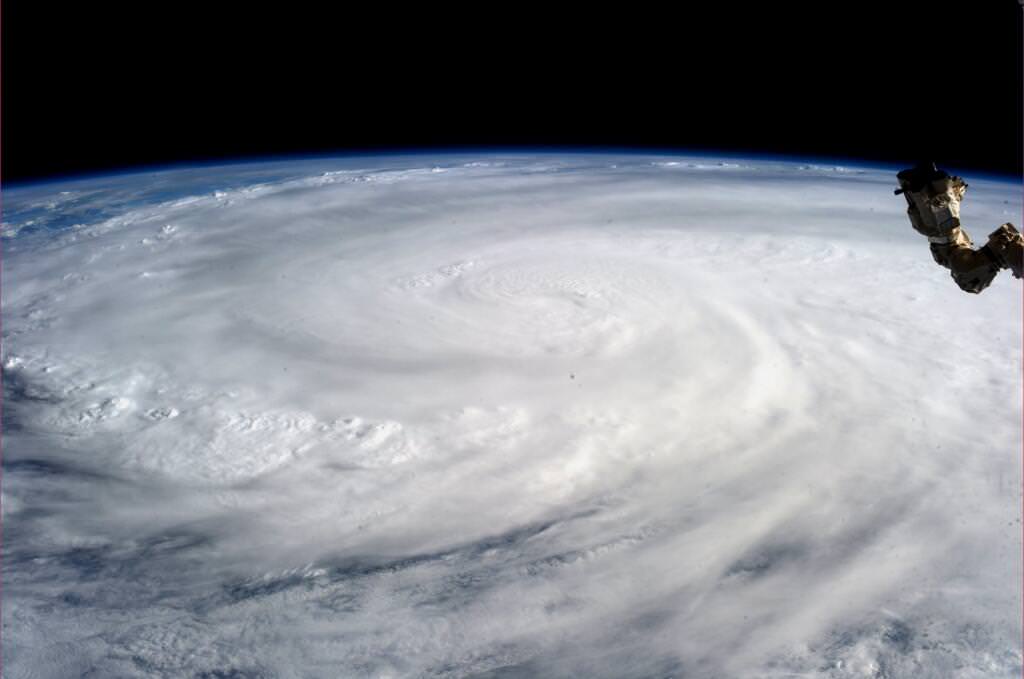
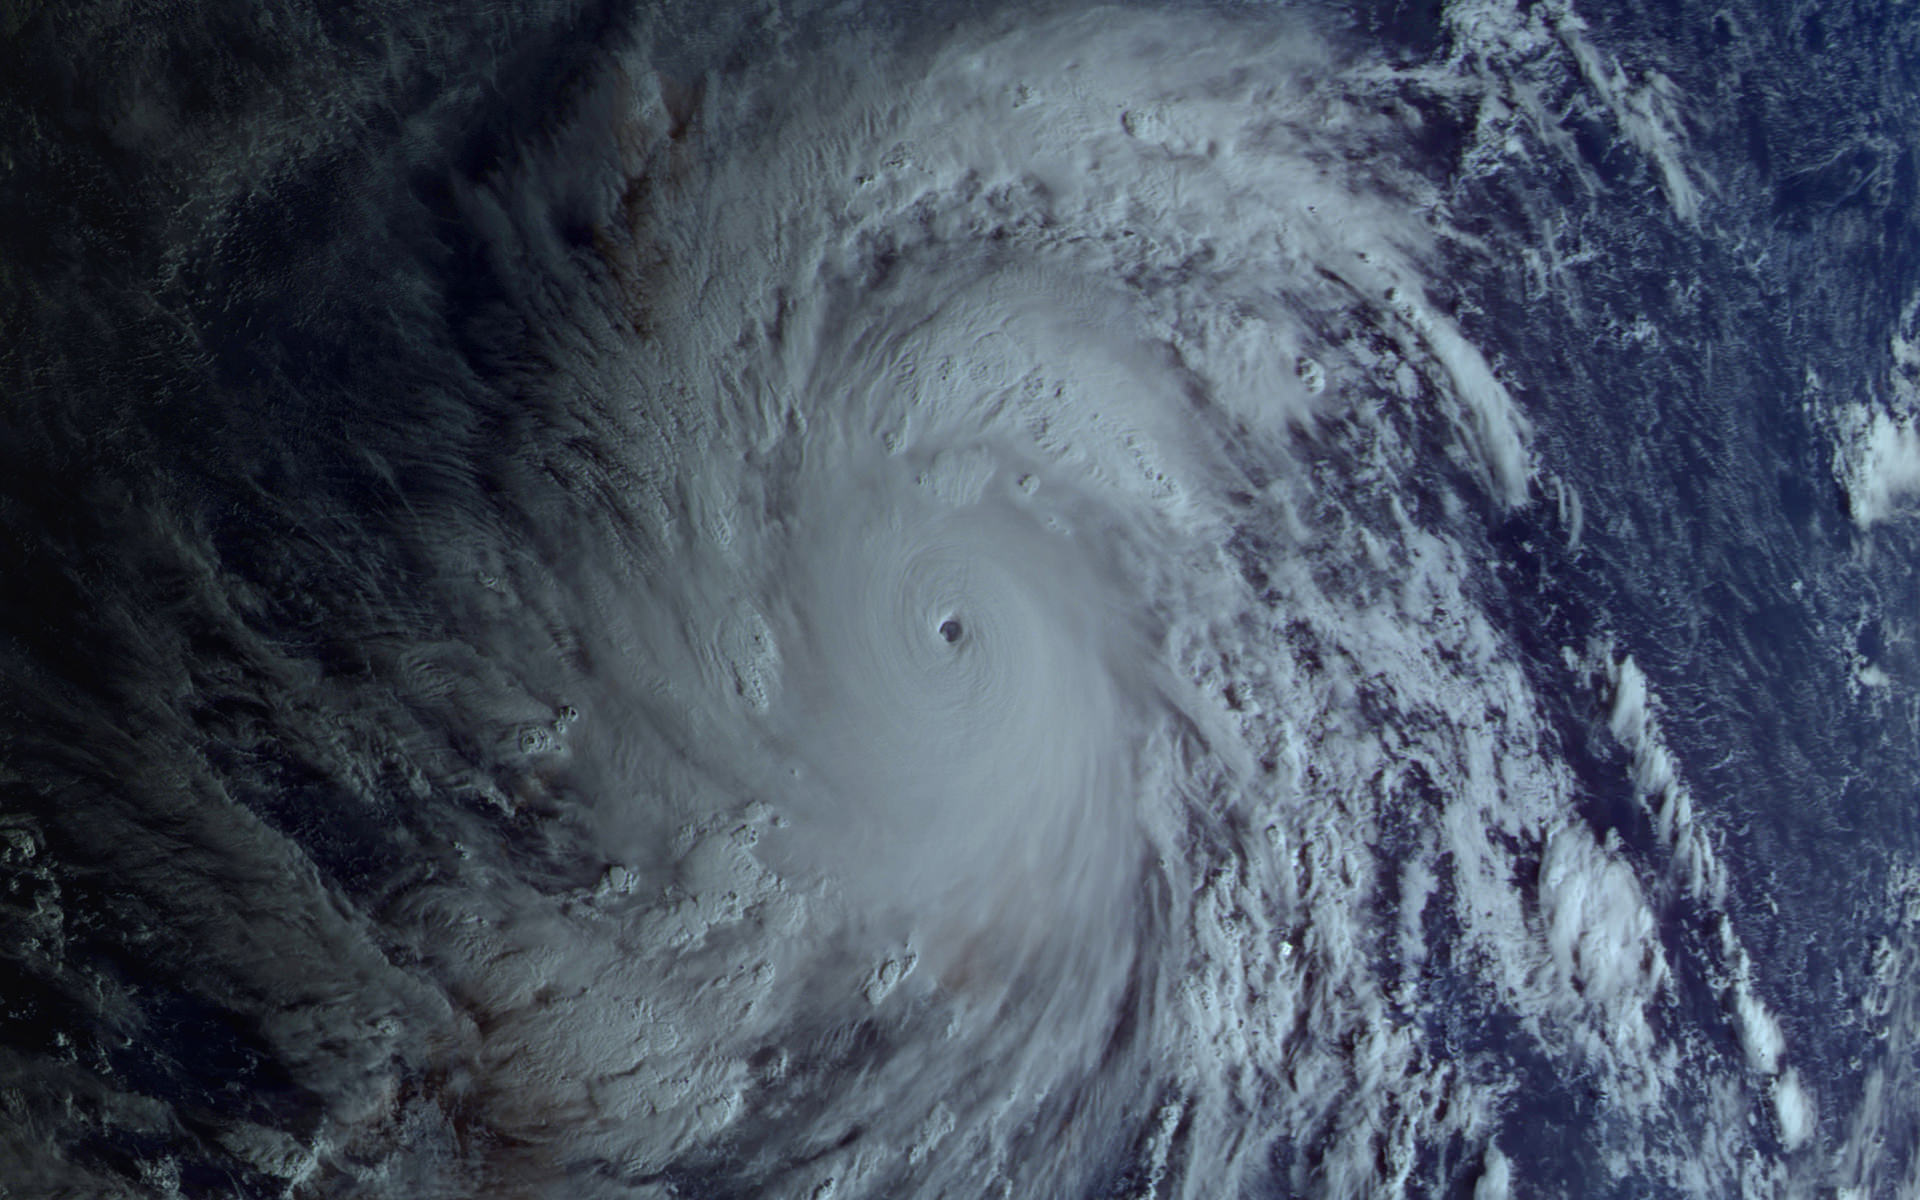
Super Typhoon Haiyan over the Philippines on November 9, 2013 as imaged from Earth orbit by NASA Astronaut Karen Nyberg aboard the International Space Station. Credit: NASA/Karen Nyberg
Super Typhoon Haiyan over the Philippines on November 9, 2013 as imaged from Earth orbit by NASA Astronaut Karen Nyberg aboard the International Space Station.Category 5 killer storm Haiyan stretches across the entire photo from about 250 miles (400 kilometer) altitude. Credit: NASA/Karen Nyberg See more Super Typhoon Haiyan imagery and video below
[/caption]
NASA GODDARD SPACE FLIGHT CENTER, MARYLAND – Super Typhoon Haiyan smashed into the island nation of the Philippines, Friday, Nov. 8, with maximum sustained winds estimated at exceeding 195 MPH (315 kilometer per hour) by the U.S. Navy Joint Typhoon Warning Center – leaving an enormous region of catastrophic death and destruction in its terrible wake.
The Red Cross estimates over 1200 deaths so far. The final toll could be significantly higher. Local media reports today say bodies of men, women and children are now washing on shore.
The enormous scale of Super Typhoon Haiyan can be vividly seen in space imagery captured by NASA, ISRO and Russian satellites – as well as astronaut Karen Nyberg flying overhead on board the International Space Station (ISS); collected here.
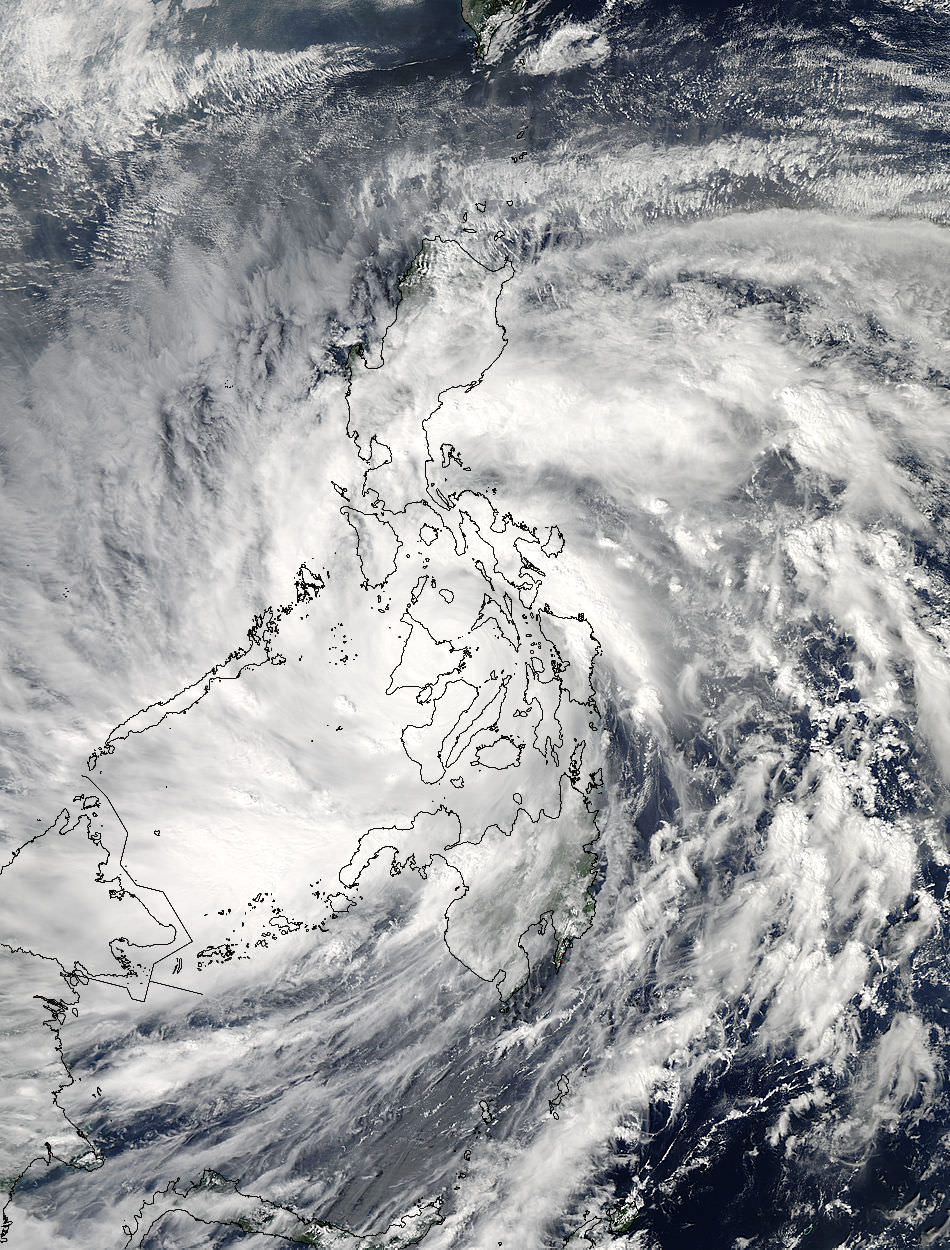
As Super-Typhoon Haiyan moved over the central Philippines on Nov. 8 at 05:10 UTC/12:10 a.m. EDT, the MODIS instrument aboard NASA’s Aqua satellite captured this visible image. Credit: NASA Goddard MODIS Rapid Response Team
Super Typhoon Haiyan is reported to be the largest and most powerful storm ever to make landfall in recorded human history.
Haiyan is classified as a Category 5 monster storm on the U.S. Saffir-Simpson scale.
It struck the central Philippines municipality of Guiuan at the southern tip of the province of Eastern Samar early Friday morning Nov. 8 at 20:45 UTC (4:45 am local time).
As Haiyan hit the central Philippines, NASA says wind gusts exceeded 235 mph (379 kilometers per hour).
The high resolution imagery and precise measurements provided by the worlds constellation of Earth observing space satellites (including NASA, Roscosmos, ISRO, ESA, JAXA) are absolutely essential to tracking killer storms and providing significant advance warning to evacuate residents in affected areas to help minimize the death toll and damage.
More than 800,000 people were evacuated. The storm surge caused waves exceeding 30 feet (10 meters), mudslides and flash flooding.
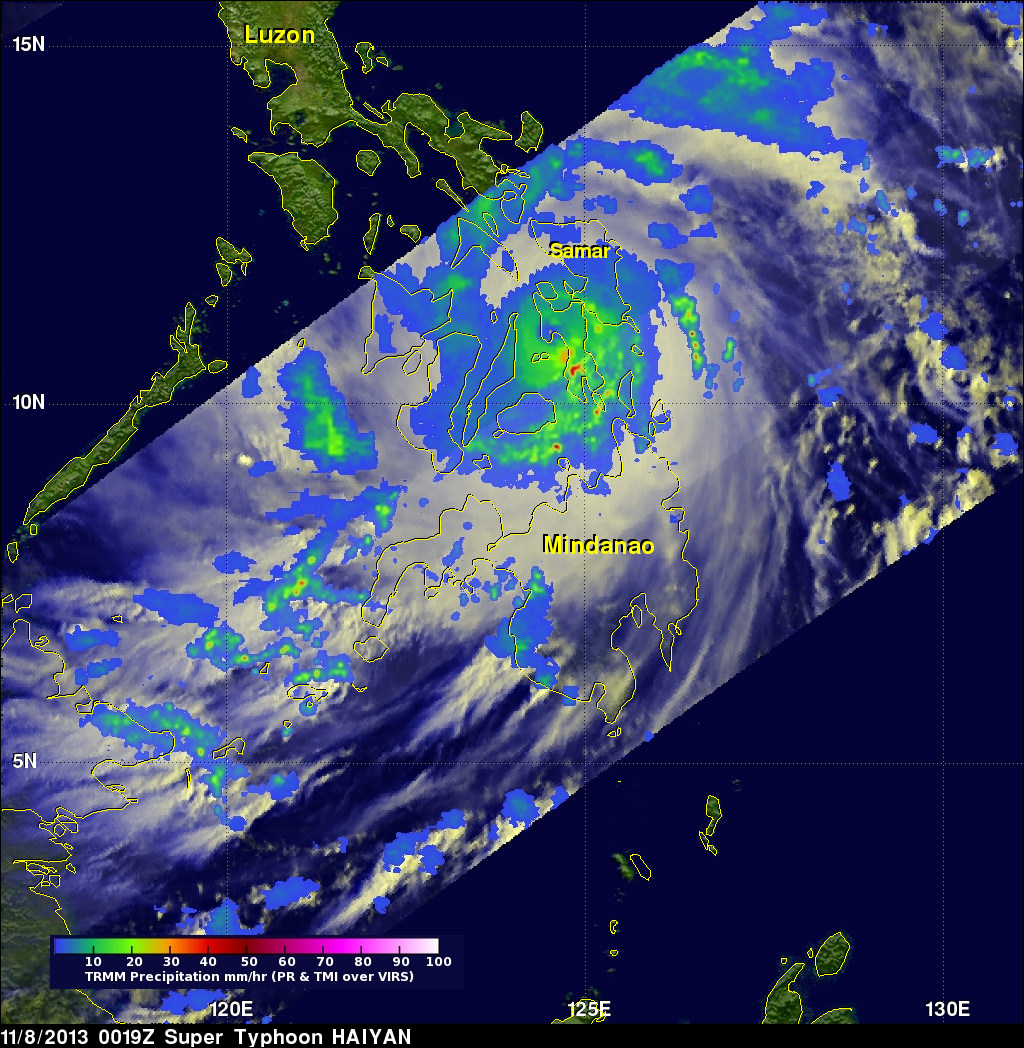
NASA’s Tropical Rainfall Measuring Mission (TRMM) satellite captured visible, microwave and infrared data on the storm just as it was crossing the island of Leyte in the central Philippines, reports NASA – see image below.
NASA’s TRMM satellite data on Nov. 8 at 00:19 UTC showed Haiyan had a well-defined eye surrounded by a symmetric area of moderate rain (green ring with a blue center) with several rainbands wrapping in from the south (green arcs) while crossing the island of Leyte in the central Philippines. Credit: NASA/SSAI, Hal Pierce
TRMM data from rain rates are measured by the TRMM Precipitation Radar (PR) and TRMM Microwave Imager (TMI) and combined with infrared (IR) data from the TRMM Visible Infrared Scanner (VIRS) by science teams working at NASA’s Goddard Space Flight Center in Greenbelt, Md.
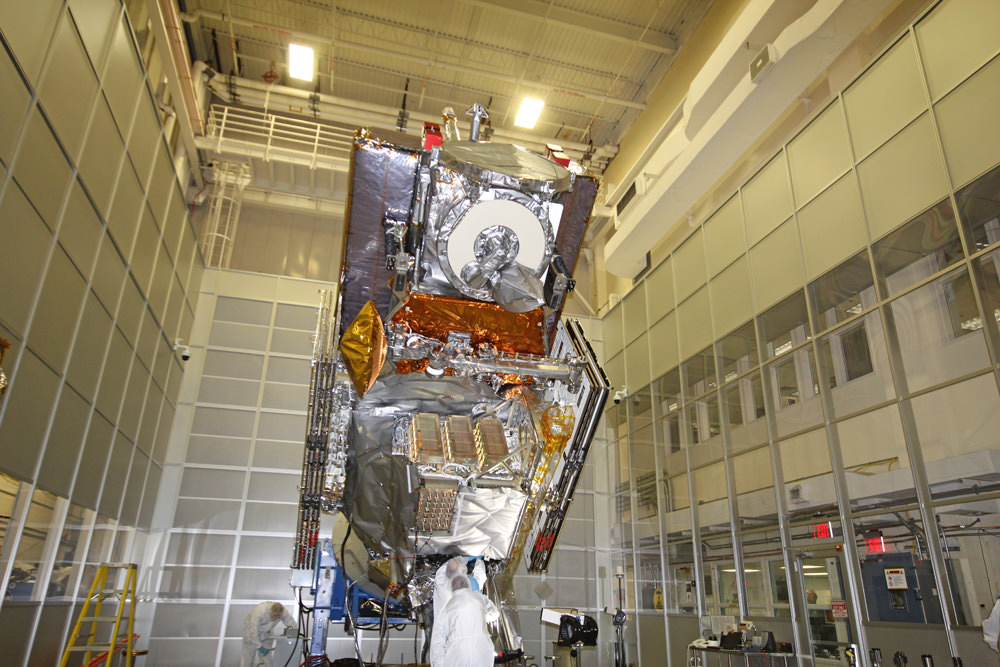
Coincidentally NASA Goddard has just completed assembly of the next generation weather satellite Global Precipitation Measurement (GPM) observatory that replaces TRMM – and where I inspected the GPM satellite inside the Goddard clean room on Friday.
“GPM is a direct follow-up to NASA’s currently orbiting TRMM satellite,” Art Azarbarzin, GPM project manager, told Universe Today during my exclusive clean room inspection of the huge GPM satellite.
NASA’s next generation Global Precipitation Measurement (GPM) observatory inside the clean room at NASA Goddard Space Flight Center. GPM is slated to launch In February 2014 and will provide global measurements of rain and snow every 3 hours – as a direct follow-up to NASA’s currently orbiting TRMM satellite; reaching the end of its usable lifetime.
Credit: Ken Kremer/kenkremer.com
“TRMM is reaching the end of its usable lifetime. GPM launches in February 2014 and we hope it has some overlap with observations from TRMM.”
“The Global Precipitation Measurement (GPM) observatory will provide high resolution global measurements of rain and snow every 3 hours,” Dalia Kirschbaum, GPM research scientist, told me at Goddard.
GPM is equipped with advanced, higher resolution radar instruments. It is vital to continuing the TRMM measurements and will help provide improved forecasts and advance warning of extreme super storms like Hurricane Sandy and Super Typhoon Haiyan, Azarbarzin and Kirschbaum explained.
Video Caption: Super Typhoon Haiyan imaged on Nov 6 – 8, 2013 by the Russian Elektro-L satellite operating in geostationary orbit. Credit: Roscosmos via Vitaliy Egorov
The full magnitude of Haiyan’s destruction is just starting to be assessed as rescue teams reach the devastated areas where winds wantonly ripped apart homes, farms, factories, buildings and structures of every imaginable type vital to everyday human existence.
Typhoon Haiyan is moving westward and is expected to forcefully strike central Vietnam in a day or two. Mass evacuations are underway at this time
Super Typhoon Haiyan imaged by the Russian Elektro-L satellite operating in geostationary orbit. Credit: Roscosmos via Vitaliy Egorov
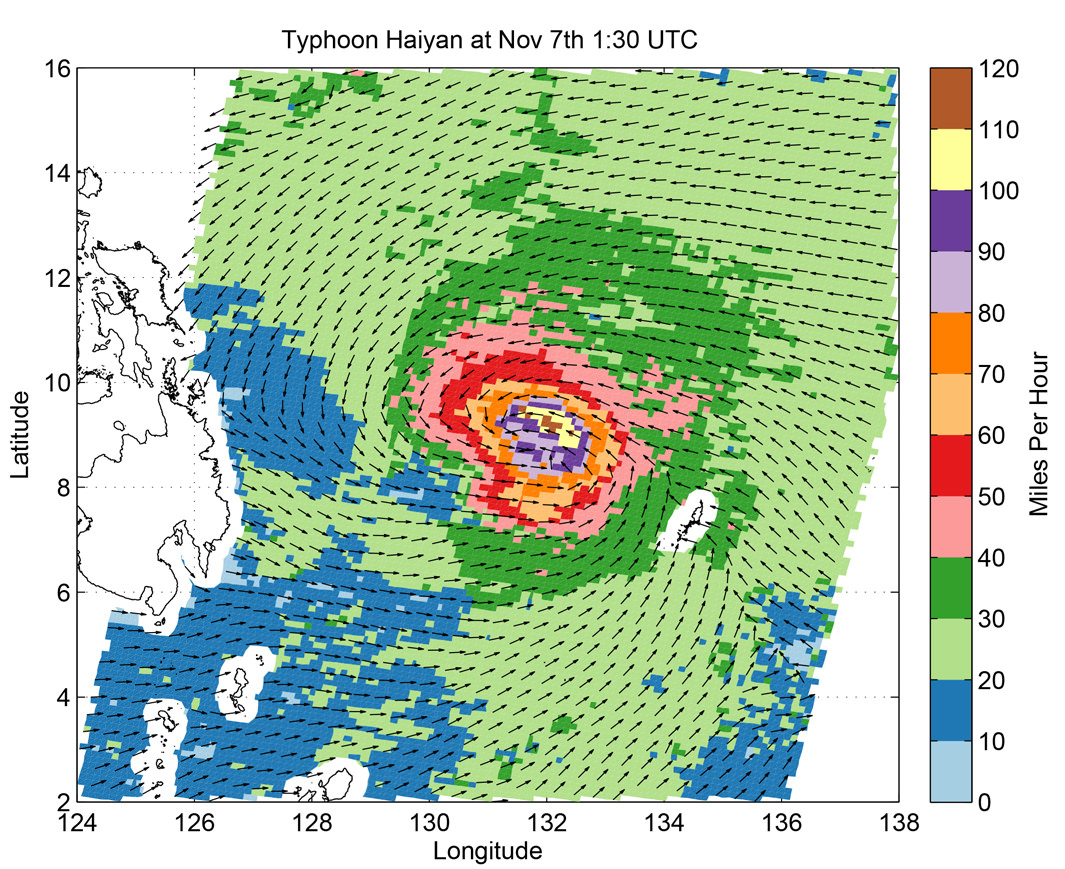
Super Typhoon Haiyan’s ocean surface winds were measured by the OSCAT radar scatterometer on the Indian Space Research Organization’s (ISRO) OceanSAT-2 satellite at 5:30 p.m. PST on Nov. 6. The colors indicate wind speed and arrows indicate wind direction. Credit: ISRO/NASA/JPL-Caltech
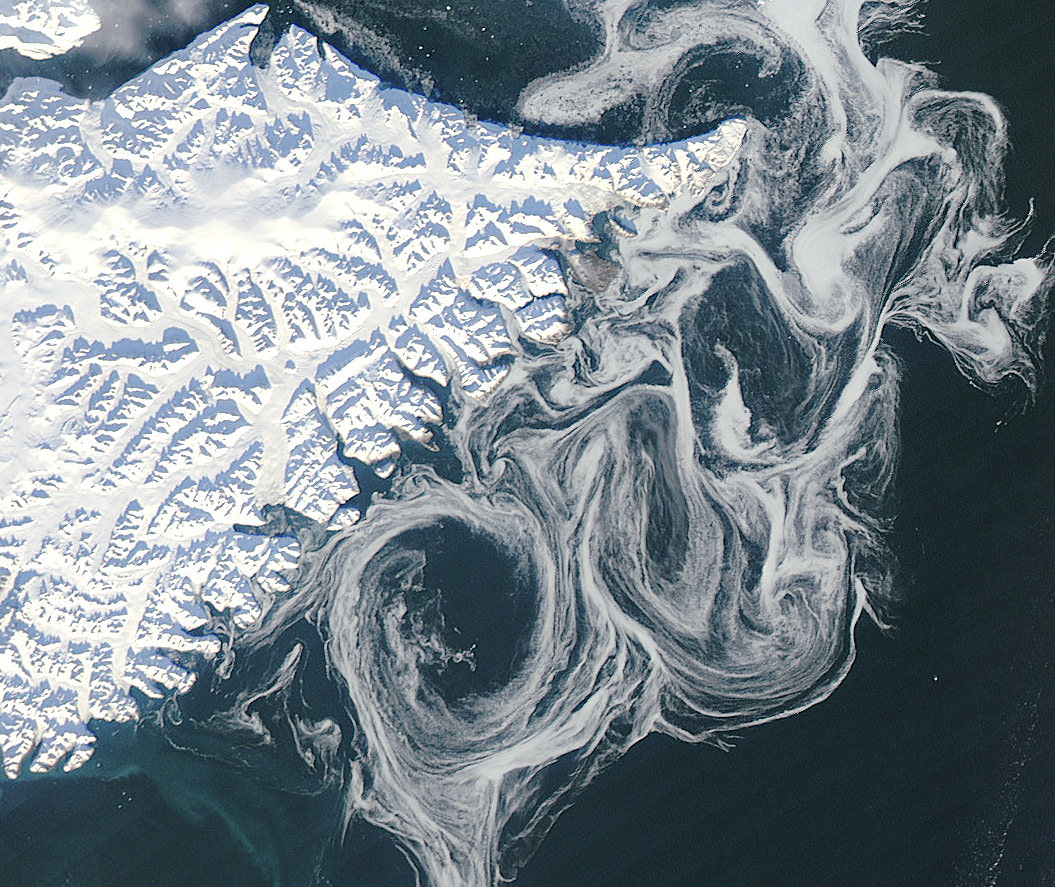
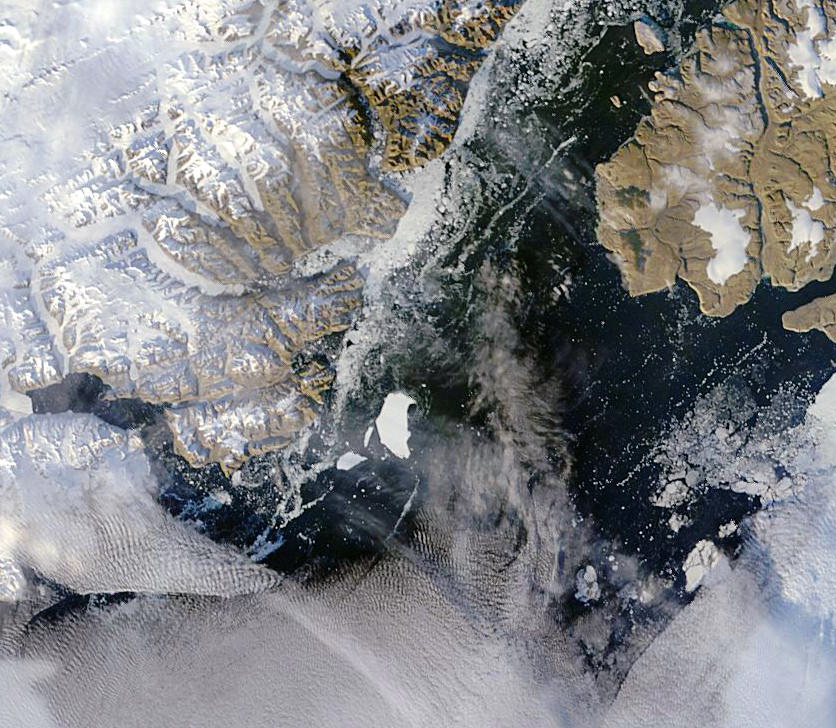
Sea ice swirls in ocean currents off the coast of Greenland (NASA/GSFC)
Spooky spectral swirls of last season’s sea ice drift in currents off the coast of eastern Greenland in this image from NASA’s Aqua satellite, acquired on October 17. Although sea ice in the Arctic will start forming again after September’s record low measurements, these ghostly wisps are likely made up of already-existing ice that has migrated south.
As global temperatures rise — both over land and in the ocean — thinner sea ice builds up during the Arctic winter and thus more of it melts during the summer, a pattern that will eventually lead to an ice-free Arctic if trends continue. The past several years saw sea ice in the Arctic below the 1979-2000 average, with this past September displaying the lowest volumes yet recorded.
The graph below, made from data modeled by the Polar Science Center at the University of Washington, show the chilling — or, perhaps, not-so-chilling — results of this century’s recent observations.
Along Greenland’s east coast, the Fram Strait serves as an expressway for sea ice moving out of the Arctic Ocean. The movement of ice through the strait used to be offset by the growth of ice in the Beaufort Gyre.
Until the late 1990s, ice would persist in the gyre for years, growing thicker and more resistant to melt. Since the start of the twenty-first century, however, ice has been less likely to survive its trip through the southern part of the Beaufort Gyre. As a result, less Arctic sea ice has been able to pile up and form multi-year ice.
Thin, free-drifting ice — as seen above — moves very easily with winds and currents.
Aqua is a NASA Earth Science satellite mission named for the large amount of information that the mission is collecting about the Earth’s water cycle, including evaporation from the oceans, water vapor in the atmosphere, clouds, precipitation, soil moisture, sea ice, land ice, and snow cover on the land and ice. Aqua was launched on May 4, 2002, and carries six Earth-observing instruments in a near-polar low-Earth orbit. MODIS, which acquired the image above, is a 36-band spectroradiometer that measures physical properties of the atmosphere, oceans and land.
NASA image courtesy Jeff Schmaltz, LANCE MODIS Rapid Response Team at NASA GSFC. Graph by Jesse Allen based on modeled ice volume data from the Polar Science Center, University of Washington. Caption portions by Michon Scott with information from Ted Scambos, National Snow and Ice Data Center.
An “ice island” that calved from the Petermann Glacier in July is seen by NASA satellite (MODIS/Terra)
Remember that enormous slab of ice that broke off Greenland’s Petermann Glacier back in July? It’s now on its way out to sea, a little bit smaller than it was a couple of months ago — but not much. At around 10 miles long and 4.6 miles across (16.25 x 7.5 km) this ice island is actually a bit shorter than Manhattan, but is fully twice as wide.
The image above was acquired on September 14 by the Moderate Resolution Imaging Spectroradiometer (MODIS) aboard NASA’s Terra satellite.
Although the calving of this particular ice island isn’t thought to be a direct result of increasing global temperatures, climate change is thought to be a major factor in this year’s drop in Arctic sea ice extent, which is now below 4.00 million square kilometers (1.54 million square miles). Compared to September conditions in the 1980s and 1990s, this represents a 45% reduction in the area of the Arctic covered by sea ice.
Arctic sea ice extent data for June-July 2012 (NSIDC)
This year sea ice in the Arctic Ocean dropped below the previous all-time record, set in 2007. 2012 also marks the first time that there has been less than 4 million square kilometers (1.54 million square miles) of sea ice since satellite observations began in 1979.
The animation below, released today by the NOAA, shows the 2012 time-series of ice extent using data from the DMSP SSMI/S satellite sensor:
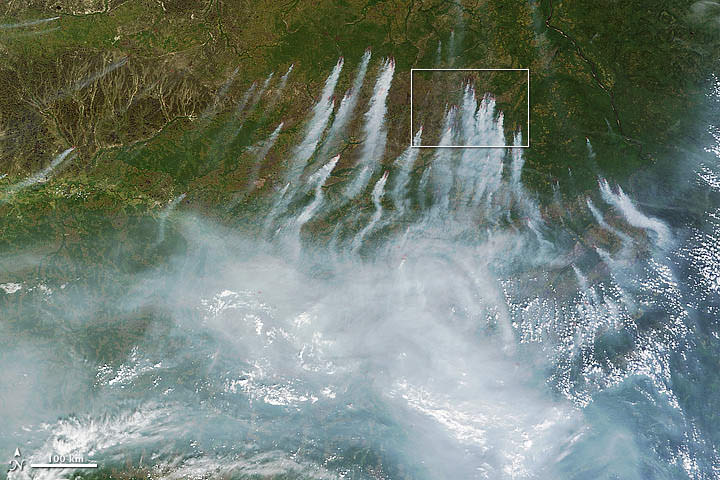
The latest views of Earth from NASA’s Aqua and Terra satellites are looking a bit hazy from wildfires burning in wilderness areas of the United States and Siberia.
The above image acquired July 18 from the Moderate Resolution Imaging Spectroradiometer, or MODIS, aboard the Terra satellite, shows a whopping 198 wildfires burning across Siberia. You can view more of this huge fire at NASA’s Earth Observatory website. The fires have charred an area of more than 83 square kilometers. Some of the fires were started by people who lost control of agricultural fires but some fires were started by lightning.
Another NASA earth-observing satellite, Aqua, has taken dramatic images of the High Park Fire just west of Fort Collins, Colorado and the Whitewater-Baldy Complex Fire in southwestern New Mexico. The High Park Fire has grown to more than 235 square kilometers, burning 180 structures and leading to the death of one person. It has become one of the most destructive and largest fires in Colorado history. Thankfully, the
Besides measuring the smoke plume and fire extent, much can be learned using satellite images of wildfires. Types of vegetation can affect the type and color of smoke emitted by the wildfire. Grassland fires tend to burn quickly and give off carbon-rich black smoke. Forest fires where moisture is higher give off thicker smoke; a combination of organic rich ash and water vapor, that ranges in color from brown to bright white.
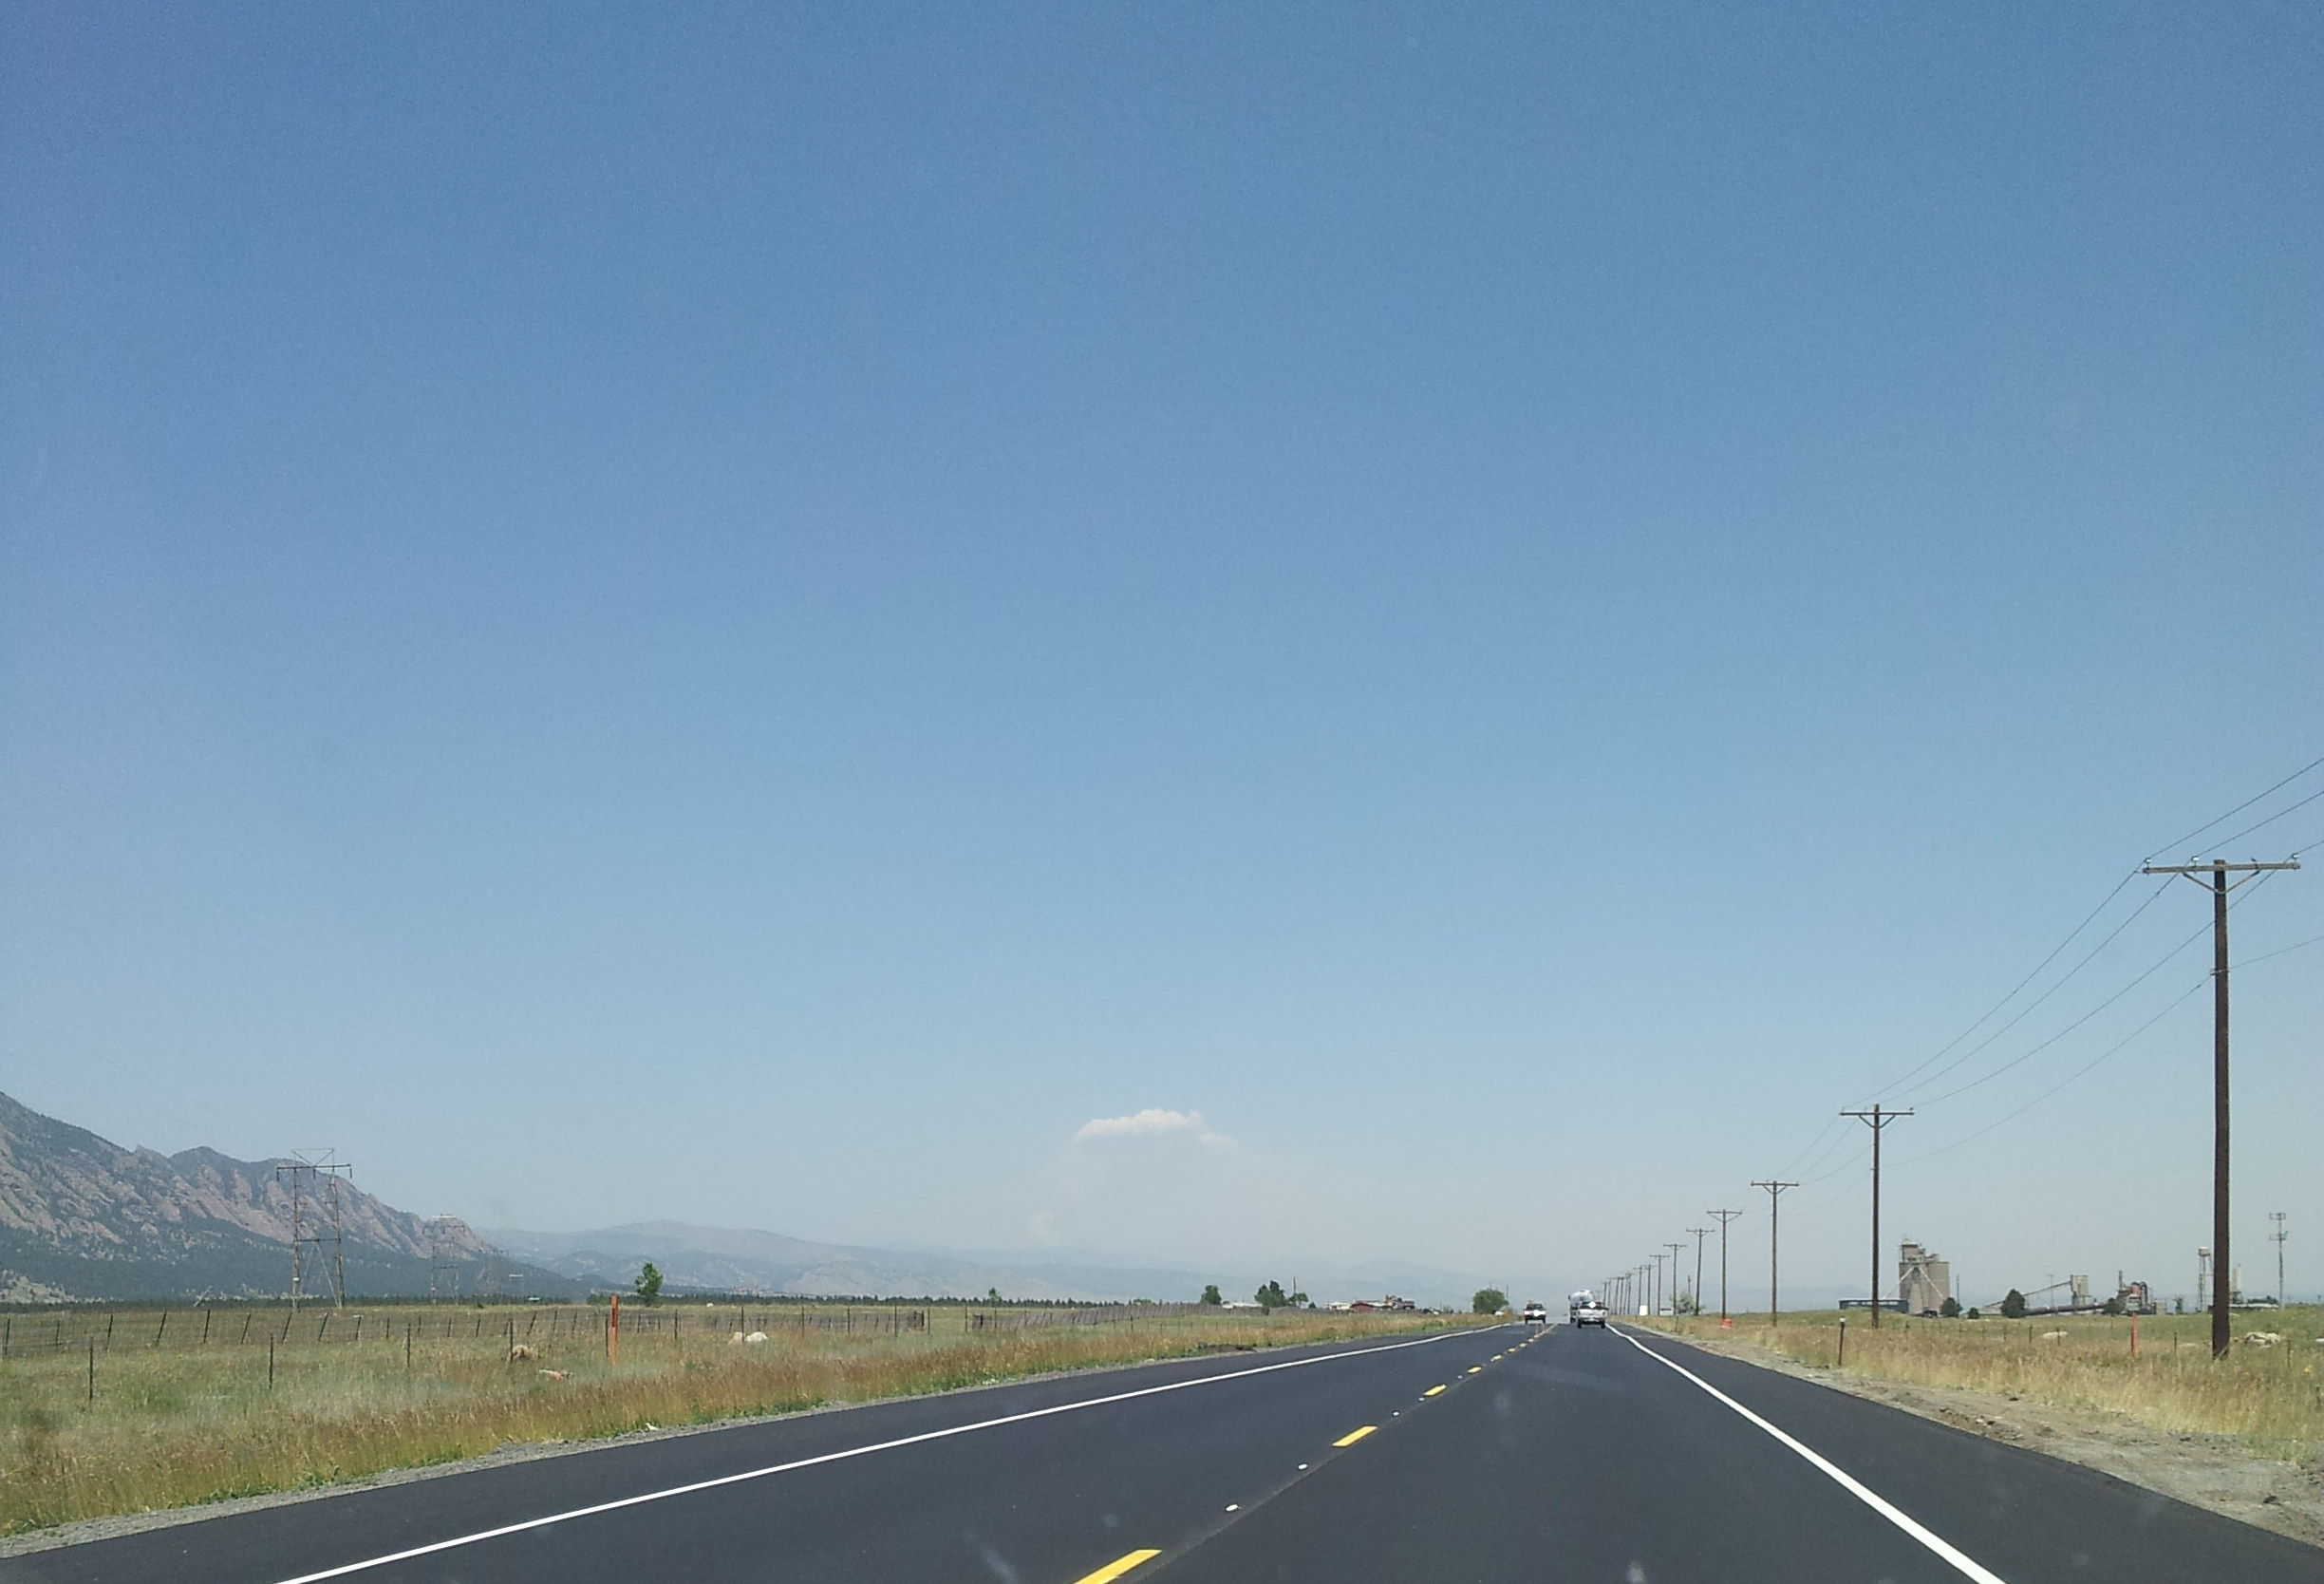
On the plus side for weather buffs, each of the fires have produced rare pyrocumulus, or fire clouds. Wildfires and volcanos can produce these dramatic clouds as intense heating causes the air to rise. As the rising air cools, water vapor in the ash cloud condenses just like a normal cloud. The ash particles provide nuclei for water to condense. Sometimes this moisture will fall back on the fire as rain. Dave Lipson, a meteorologist with the National Oceanic and Atmospheric Administration told the Denver Post that calm and clear weather along Colorado’s Front Range made the towering pyrocumulus cloud look especially menacing Tuesday. Tuesday afternoon, the lone fire cloud could be seen from 40 miles away from Denver.
Lead image caption: NASA image courtesy Jeff Schmaltz, LANCE MODIS Rapid Response. Instrument: Terra – MODIS
Second image caption: High Park Fire, Colorado from NASA’s Aqua MODIS
Third image caption: Looking north near Boulder, Colorado at the pyrocumulus cloud produced from the High Park Fire. Photo: John Williams
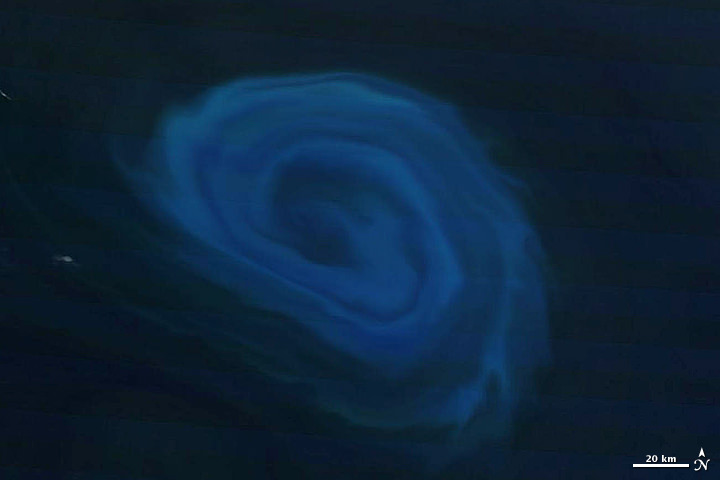
A 150-km (93-mile) - wide eddy in the southern Indian Ocean. (NASA/Terra-MODIS)
[/caption]
A serpentine eddy swirls in the southern Indian Ocean several hundred kilometers off the coast of South Africa in this natural-color image, acquired by NASA’s Terra satellite on December 26, 2011.
The blue color is created by blooms of phytoplankton, fertilized by the nutrient-rich deep water drawn up by the 150-km-wide eddy.
The counter-clockwise anticyclonic structure of the eddy may resemble a hurricane or typhoon, but unlike those violent storms eddies bring nourishment rather than destruction.
“Eddies are the internal weather of the sea,” said Dennis McGillicuddy, an oceanographer at the Woods Hole Oceanographic Institution in Massachusetts.
And also unlike atmospheric storms, ocean eddies can last for months, even up to a year. The largest ones can contain up to 1,200 cubic miles (5,000 cubic kilometers) of water.
The nutrient-drawing power of eddies can supply the relatively barren waters of the open ocean with nutrients, creating “oases in the oceanic desert,” according to McGillicuddy.
The eddy imaged here likely peeled off from the Agulhas Current, which flows along the southeastern coast of Africa and around the tip of South Africa. Agulhas eddies tend to be among the largest in the world.
The image below shows the eddy in context with the surrounding area:
Eddy off the coast of South Africa. December 26, 2011. (NASA/Terra-MODIS)
MODIS (or Moderate Resolution Imaging Spectroradiometer) is a key instrument aboard NASA’s Terra (EOS AM) satellite. Terra MODIS views the entire Earth’s surface every 1 to 2 days, acquiring data in 36 spectral bands. These data improve our understanding of global dynamics and processes occurring on the land, in the ocean, and in the lower atmosphere.
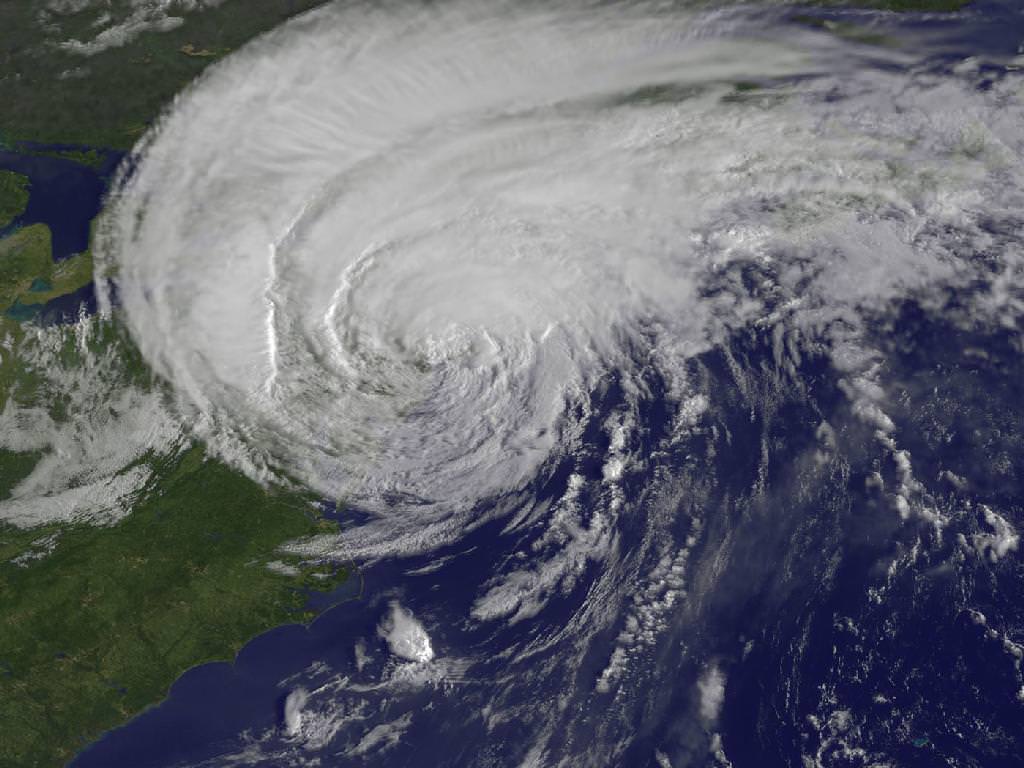
Irene Makes Landfall Over New York. This GOES-13 satellite image is of Hurricane Irene just 28 minutes before the storm made landfall in New York City. The image shows Irene's huge cloud cover blanketing New England, New York and over Toronto, Canada. Shadows in Irene's clouds indicate the bands of thunderstorms that surrounded the storm. Credit: NASA/NOAA GOES Project
NASA Video Caption: The Life of Hurricane Irene from the Caribbean to Canada from August 21 through August 29 seen by NASA/NOAA satellites. Credit: NASA/NOAA/GOES/MODIS
The new NASA animation above shows the birth and subsequent destructive and deadly path followed by Hurricane Irene from August 21 through August 29, 2011 starting in the Caribbean, and then tracking along the US East Cost and up into Canada. The observations combine images taken by NASA and NOAA Earth orbiting satellites.
The cloud images were captured by the NASA/NOAA GOES-13 satellite and overlaid on a true-color NASA MODIS map. Irene followed a lengthy course over Puerto Rico, Hispaniola, the Bahamas, and then along the entire US East with landfalls over North Carolina, New Jersey and New York.
NASA ISS astronaut Ron Garan and cameras flying overhead aboard the International Space Station (ISS) also photographed vivid images showing the magnitude of Irene slamming into the US East coast.
Irene caused widespread property damage. Massive and raging flooding in several US states destroyed houses, crushed businesses and washed away bridges and roads and more. The worst flooding is yet to come to some inland portions of Vermont, New Jersey, New York, Pennsylvania and elsewhere as uncontrollable waters continue to rise at numerous rivers, lakes and even ponds, threatening even more misery in their wake.
[/caption]
So far 41 fatalities in 12 states have been attributed to Irene and more may be expected as searches continue. Some communities have been entirely cut off due to washed out access. Airlifts of food and water have begun. More people are being evacuated from New Jersey towns today, Aug 30.
Brave emergency rescue workers have put their own lives at peril and saved the lives of countless others of all ages from babies to the elderly. Some 8 million customers, including my area, lost power due to extensive flooding, downed trees and electrical wires, and devastated infrastructure.
Hurricane Irene twitpic from the International Space Station on 8/27/11 by NASA Astronaut Ron Garan
Irene From Space and the ISS as it crossed the coast on August 27, 2011 at 3:32pm EST. Hope everyone is OK wrote NASA Astronaut Ron Garan with his twitpic from the ISS. Credit: NASA/Ron Garan aboard the ISS
Emergency crews are hard at work to restore power as quickly as possible, but many thousands of homes and businesses could be without power for up to a week or more. About 3.3 million customers are still without power today.
NASA’s GOES-13 satellite captured a dramatic view of Hurricane Irene just 28 minutes prior to making landfall over New York City. Today’s NASA Image of the day shows the humongous cloud cover spanning the US East coast from the Mid-Atlantic States up to New Jersey, New York, Pennsylvania, and New England and into Toronto, Canada.
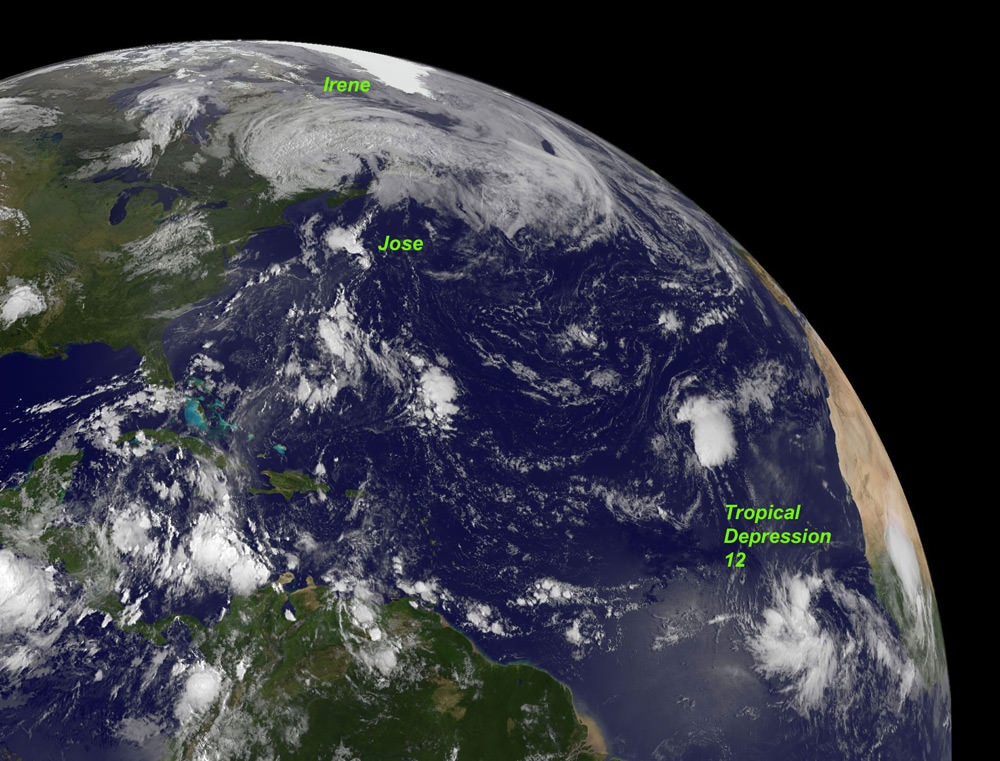
This GOES-13 image from Monday, August 29 at 7:45 a.m. EDT shows an active Atlantic Ocean with the remnants of Hurricane Irene moving into Quebec and Newfoundland (left), Tropical Storm Jose (center) and newly formed Tropical Depression 12 (right). Credit: NASA/NOAA GOES Project
Irene slams into North Carolina. The GOES-13 satellite saw Hurricane Irene on August 27, 2011 at 10:10 a.m. EDT after it made landfall at 8 a.m. in Cape Lookout, North Carolina. Irene's outer bands had already extended into New England. Credit: NASA/NOAA GOES Project
Many transit systems and airports in Irene’s path were shutdown ahead of the storm.
Send me your photos of Irene’s destruction to post at Universe Today.