One Bonus From the Gaia Data Release: the Rotation of the Large Magellanic Cloud

Rotation of the Large Magellanic Cloud, as revealed by the ESA's Gaia spacecraft. Copyright: ESA/Gaia/DPAC

On December 19th, 2013, the European Space Agency’s (ESA) Gaia spacecraft took to space with for a very ambitious mission. Over the course of its planned 5-year mission (which was recently extended), this space observatory would map over a billion stars, planets, comets, asteroids and quasars in order to create the largest and most precise 3D catalog of the Milky Way ever created.

Since that time, the ESA has made two data releases that cover the first three years of the Gaia mission. The second data release, which took on April 25th, 2018, has already proven to be a treasure trove for astronomers. In addition to the positions, distance indicators and motions of over a billion stars and celestial objects in the Milky Way Galaxy, it also contained a hidden gem – the proper motions of stars within the Large Magellanic Cloud (LMC).

Located about 200,000 light-years from Earth, the LMC has dense clouds of dust that results in it experiencing high rates of star formation. In addition, it’s central bar is warped (where the east and west ends are nearer to the Milky Way), suggesting that it was once a barred dwarf spiral galaxy who’s spiral arms were disrupted by interaction with the Small Magellanic Cloud (SMC) and the Milky Way.

The proper motions of the stars in the LMC, as captured by the Gaia spacecraft (without color). Copyright: ESA/Gaia/DPAC

For these reasons, astronomers have been hoping to derive the orbits of dwarf galaxies (and globular clusters) that revolve around the Milky Way. In so doing, they hope to learn more about how our galaxy evolved due to mergers with clusters and other galaxies. By determining the proper motions of the LMC’s stars, the Gaia mission has provided clues as to how the Milky Way and its largest satellite galaxy have interacted over time.

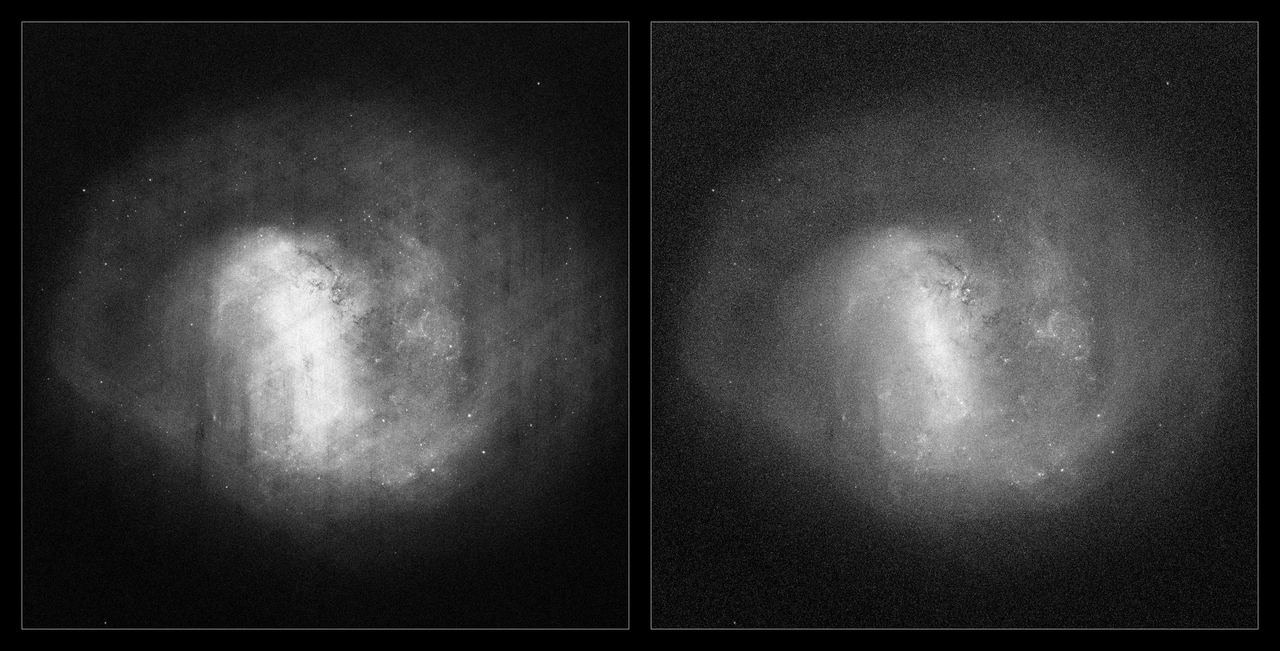
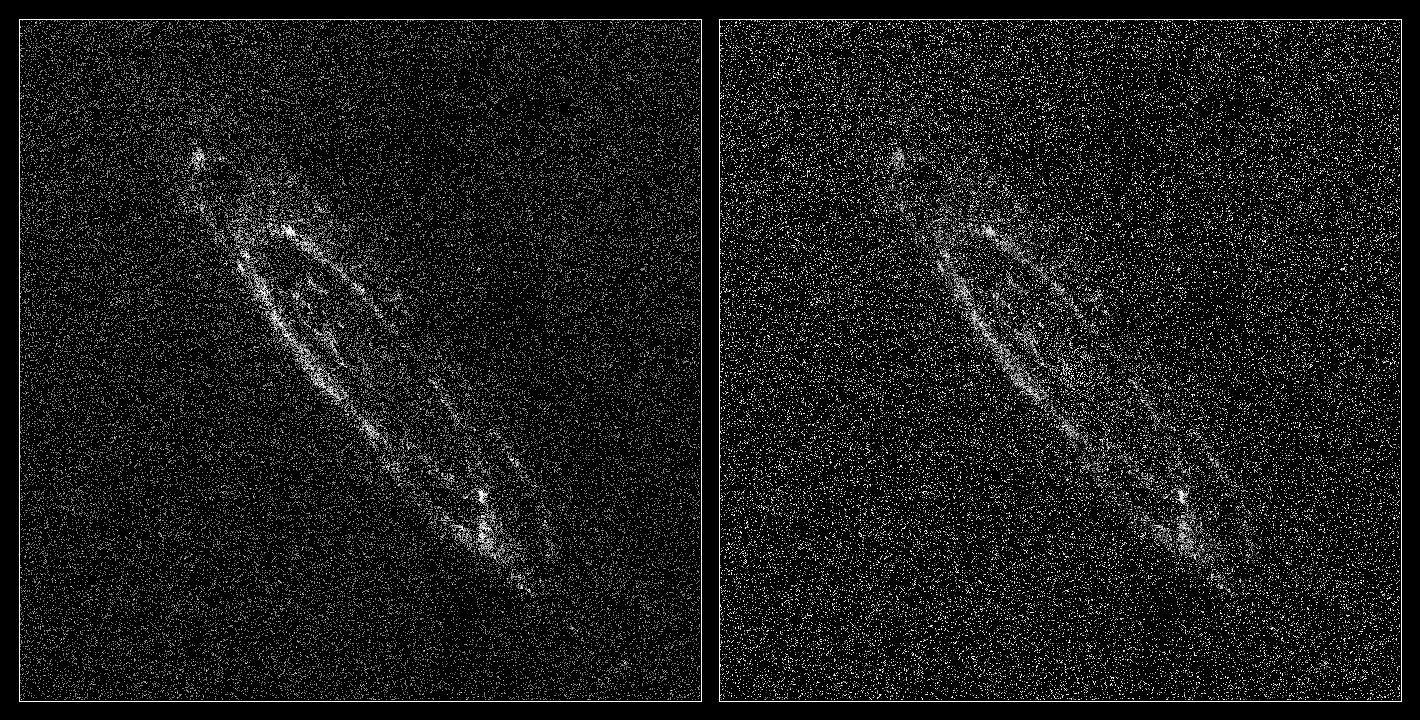
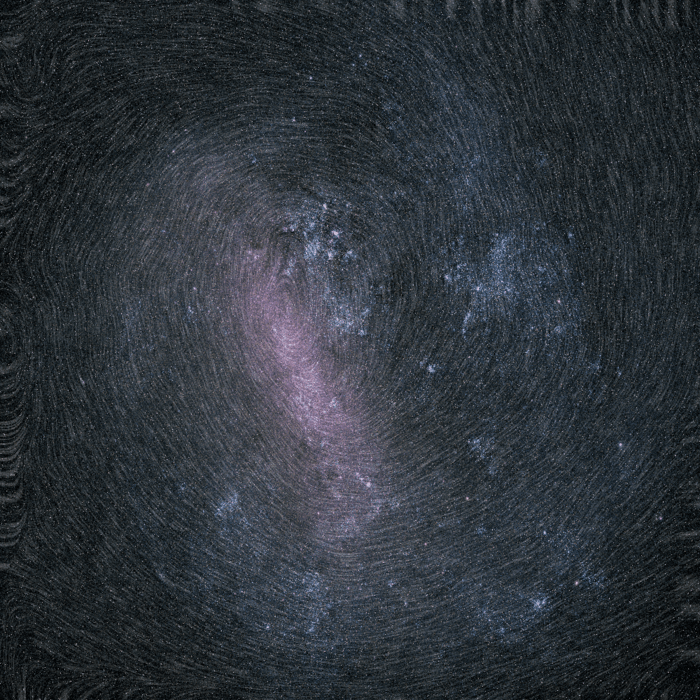
As you can see from the image (at top), the bar of the LMC is outlined in great detail, along with individual star-forming regions like the Tarantula Nebula (aka. 30 Doradus, which is visible just above the center of the galaxy). The image combines the total amount of radiation detected by the observatory in each pixel. The radiation measurements were then taken through different filters on the spacecraft to generate color information.

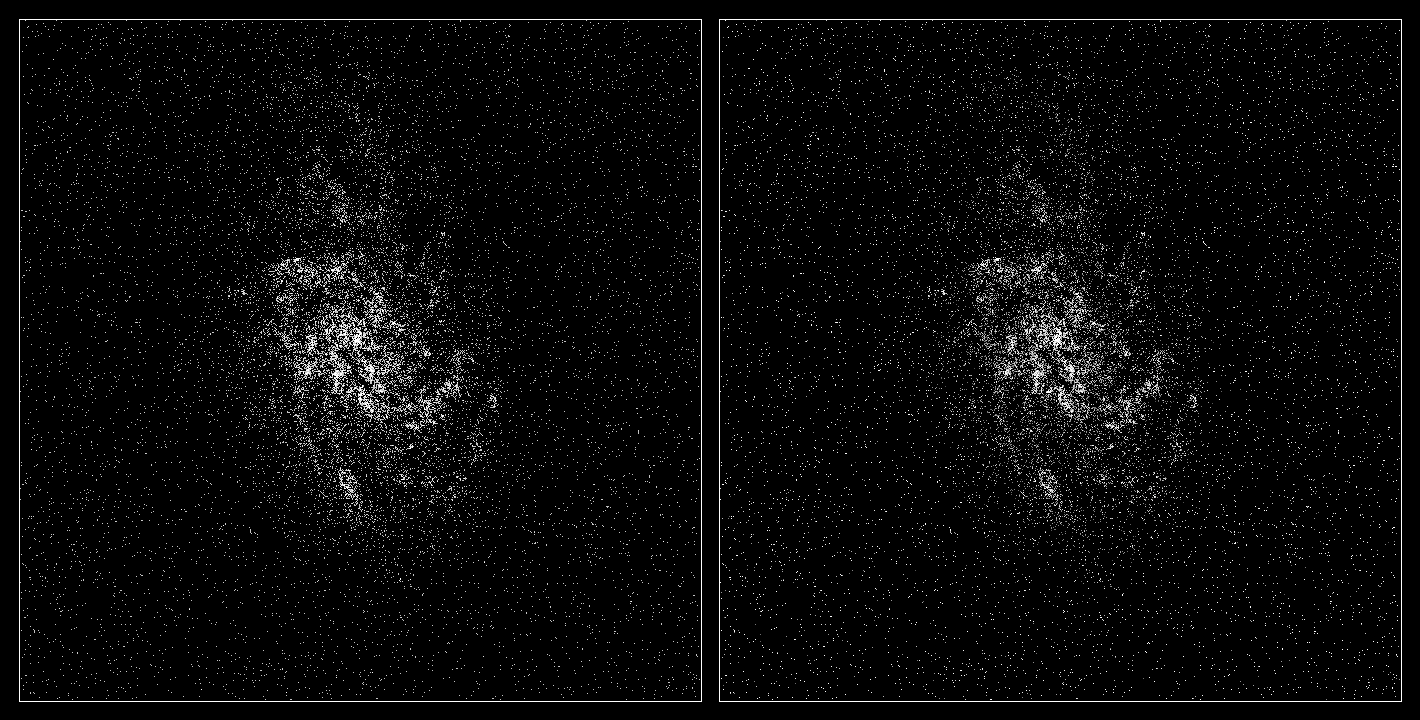
This allowed Gaia to obtain information about the total density of stars within the LMC as well as their proper motions. As you can see, the image is dominated by the brightest, most massive stars, which greatly outshine their fainter, lower-mass counterparts. The proper motions of the stars observed is represented as the texture of the image – which looks a lot like a fingerprint.

The Large Magellanic Cloud (LMC), one of the nearest galaxies to our Milky Way, as viewed by ESA’s Gaia satellite using information from the mission’s second data release. Copyright ESA/Gaia/DPAC

From this, scientists were able to see an imprint of the stars rotating clockwise around the center of the galaxy. Using this information, astronomers will be able to create new models on how the LMC, SMC, and Milky Way evolved together over time. This, in turn, could shed light on how galaxies like our own, formed and evolved over the course of billions of years.

As with other information contained in the first and second data releases, this latest discovery demonstrates that the Gaia mission is fulfilling its intended purpose. The third release of Gaia data is scheduled to take place in late 2020, with the final catalog being published in the 2020s. Meanwhile, an extension has already been approved for the Gaia mission, which will now remain in operation until the end of 2020 (to be confirmed at the end of this year).

And be sure to enjoy this animated view of the LMC’s rotation, courtesy of the ESA:

Further Reading: ESA

Gaia Looks Beyond our Galaxy to Other Islands of Stars

Color view of M31 (The Andromeda Galaxy), with M32 (a satellite galaxy) shown to the lower left. Credit and copyright: Terry Hancock.

The European Space Agency’s (ESA) Gaia mission is an ambitious project. Having launched in December of 2013, the purpose of this space observatory has been to measure the position and distances of 1 billion objects – including stars, extra-solar planets, comets, asteroids and even quasars. From this, astronomers hope to create the most detailed 3D space catalog of the cosmos ever made.

Back in 2016, the first batch of Gaia data (based on its first 14 months in space) was released. Since then, scientists have been poring over the raw data to obtain clearer images of the neighboring stars and galaxies that were studied by the mission. The latest images to be released, based on Gaia data, included revealing pictures of the Large Magellanic Cloud (LMC), the Andromeda galaxy, and the Triangulum galaxy.

The first catalog of Gaia data consisted of information on 1.142 billion stars, including their precise position in the night sky and their respective brightness. Most of these stars are located in the Milky Way, but a good fraction were from galaxies beyond ours, which included about ten million belonging to the LMC. This satellite galaxy, located about 166 000 light-years away, has about 1/100th the mass of the Milky Way.

Gaia’s view of the Large Magellanic Cloud. Click here for further details, full credits, and larger versions of the image. Credit: ESA/Gaia/DPAC

The two images shown above display composite data obtained by the Gaia probe. The image on the left, which was compiled by mapping the total density of stars detected by Gaia, shows the large-scale distribution of stars in the LMC. This image also delineates the extent of the LMC’s spiral arms, and is peppered with bright dots that represent faint clusters of stars.

The image on the right, on the other hand, reveals other aspects of the LMC and its stars. This image was created by mapping radiation flux in the LMC and is dominated by the brightest and most massive stars. This allows the bar of the LMC to be more clearly defined and also shows individual regions of star-formation – like 30 Doradus, which is visible just above the center of the galaxy in the picture.

The next set of images (shown below), which were also obtained using data from the first 14 months of the Gaia mission, depict two nearby spiral galaxies – the Andromeda galaxy (M31) and its neighbor, the Triangulum galaxy (M33). The Andromeda galaxy, located 2.5 million light-years away, is the largest galaxy in our vicinity and slightly more massive than our own. It is also destined to merge with the Milky Way in roughly 4 billion years.

The Triangulum galaxy, meanwhile, is a fraction the size of the Milky Way (with an estimated fifty billion stars) and is located slightly farther from us than Andromeda – about 2.8 million light-years distant. As with the LMC images, the images on the left are based on the total density of stars and show stars of all types, while images on the right are based on the radiation flux of each galaxy and mainly show the bright end of the stellar population.

Gaia’s view of the Andromeda galaxy. Credit: ESA/Gaia/DPAC

Another benefit of the images on the right is that they indicate the regions where the most intense star formation is taking place. For many years, astronomers have known that the LMC boasts a significant amount of star-forming activity, forming stars at five times the rate of the Milky Way Galaxy. Andromeda, meanwhile, has reached a point of near-inactivity in the past 2 billion years when it comes to star formation.

In comparison, the Triangulum Galaxy still shows signs of star formation, at a rate that is about four and a half times that of Andromeda. Thanks to the Gaia images, which indicate the relative rates of star formation from elevated levels of radiation flux and brightness, these differences between Andromeda, Triangulum and the LMC is illustrated quite beautifully.

What’s more, by analyzing the motions of individual stars in external galaxies like the LMC, Andromeda, or Triangulum, it will be possible to learn more about the overall rotation of stars within these galaxies. It will also be possible to determine the orbits of the galaxies themselves, which are all part of the larger structure known as the Local Group.

This region of space, which the Milky Way is part of, measures roughly 10 million light-years across and has an estimated 1.29 billion Solar masses. This, in turn, is just one of several collections of galaxies in the even larger Virgo Supercluster. Measuring how stars and galaxies orbit about these larger structures is key to determining cosmic evolution, how the Universe came to be as it is today and where it is heading.

The Triangulum galaxy (M33), based on data compiled by the Gaia mission. Credit: ESA/Gaia/DPAC

An international team of astronomers recently attempted to do just that using the CosmicFlows surveys. These studies, which were conducted between 2011 and 2016, calculated the distance and speed of neighboring galaxies. By pairing this data with other distance estimates and data on the galaxies gravity fields, they were able to chart the motions of almost 1,400 galaxies within 100 million light years over the course of the past 13 billion years.

In the case of the LMC, another team of astronomers recently attempted to measure its orbit using a subset of data from the first Gaia release – the Tycho–Gaia Astrometric Solution (TGAS). Combined with additional parallax and proper motion data from the Hipparcos mission, the team was able to identify 29 stars in the LMC and measure their proper motion, which they then used to estimate the rotation of the galaxy.

Gaia’s observations of the LMC and the Small Magellanic Cloud (SMC) are also important when it comes to studying Cepheid and RR Lyrae variables. For years, astronomers have indicated that these stars could be used as indicators of cosmic distances for galaxies beyond our own. In addition, astronomers working at the Gaia Data Processing and Analysis Consortium (DPAC) tested this method on hundreds of LMC variable stars in order to validate data from the first release.

Astronomers are eagerly awaiting the second release of Gaia data, which is scheduled for April of 2018. This will also contain measurements on stellar distances and their motions across the sky, and is expected to reveal even more about our galaxy and its neighbors. But in the meantime, there are still plenty of revelations to be found from the first release, and scientists expect to be busy with it for many years to come.

Further Reading: ESA

The Rosy Remains of a Star’s Final Days

Hubble image of SNR 0519, the remains of a Type Ia supernova in the Large Magellanic Cloud

Stars like our Sun can last for a very long time (in human terms, anyway!) somewhere in the neighborhood of 10-12 billion years. Already over 4.6 billion years old, the Sun is entering middle age and will keep on happily fusing hydrogen into helium for quite some time. But eventually even stars come to the end of their lives, and their deaths are some of the most powerful — and beautiful — events in the Universe.

The wispy, glowing red structures above are the remains of a white dwarf in the neighboring Large Magellanic Cloud 150,000 light-years away. Supernova remnant SNR 0519 was created about 600 years ago (by our time) when a star like the Sun, in the final stages of its life, gathered enough material from a companion to reach a critical mass and then explode, casting its outer layers far out into space to create the cosmic rose we see today.

As the hydrogen material from the star plows outwards through interstellar space it becomes ionized, glowing bright red.

SNR 0519 is the result of a Type Ia supernova, which are the result of one white dwarf within a binary pair drawing material onto itself from the other until it undergoes a core-collapse and blows apart violently. The binary pair can be two white dwarfs or a white dwarf and another type of star, such as a red giant, but at least one white dwarf is thought to always be the progenitor.

Read more: A New Species of Type Ia Supernova?

A recent search into the heart of the remnant found no surviving post-main sequence stars, suggesting that SNR 0519 was created by two white dwarfs rather than a mismatched pair. Both stars were likely destroyed in the explosion, as any non-degenerate partner would have remained.

Read more here.

This image was chosen as ESA/Hubble’s Picture of the Week. See the full-sized version here.

Credit: ESA/Hubble & NASA. Acknowledgement: Claude Cornen

Blowing a Super-duper Celestial Bubble

Image credit: X-ray: NASA/CXC/U.Mich./S.Oey, IR: NASA/JPL, Optical: ESO/WFI/2.2-m. Zoom by John Williams/TerraZoom using Zoomify

When NASA combines images from different telescopes, they create dazzling scenes of celestial wonder and in the process we learn a few more things. Behold this wonder of combined light, known as LHA 120-N 44, or N 44 for short. Zoom into the scene using the toolbar at the bottom of the image. Click the farthest button on the right of the toolbar to see this wonder in full-screen. (Hint: press the “Esc” key to get back to work)

Continue reading “Blowing a Super-duper Celestial Bubble”