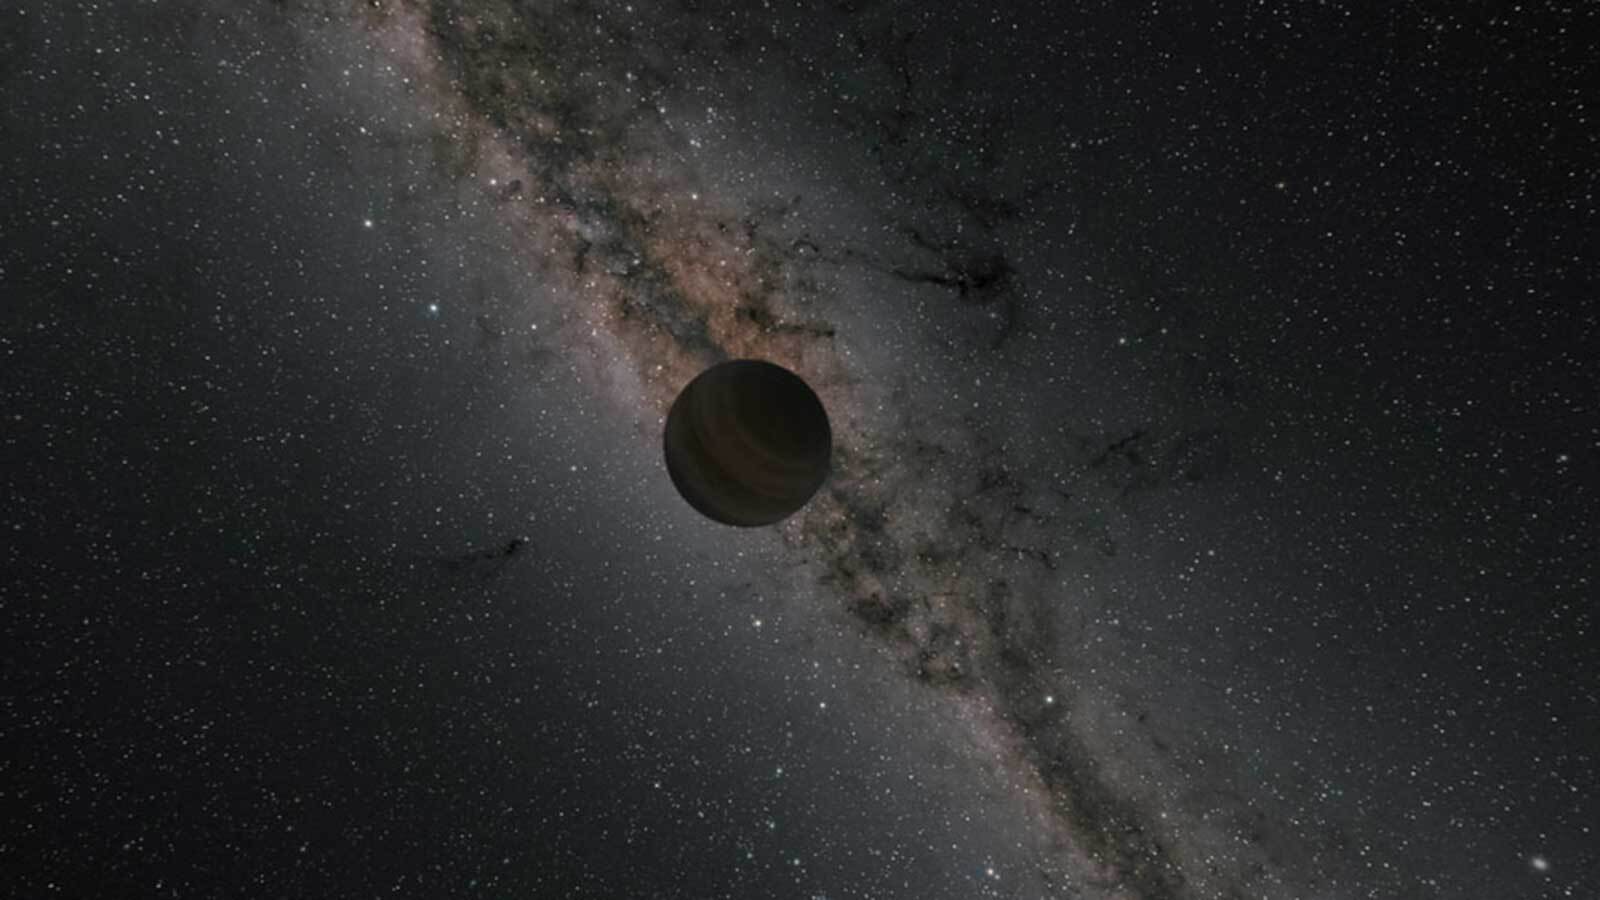
An artist's illustration of a rogue planet, dark and mysterious. Image Credit: NASA
Scientists have found what appear to be rogue planets hidden in old survey data. Their results are starting to define the poorly-understood rogue planet population. In the near future, the Nancy Grace Roman Space Telescope will conduct a search for more free-floating planets, and the team of researchers developed some methods that will aid that search.
NASA's Exoplanet Watch allows citizen scientists to participate in exoplanet research. Credit: NASA
It’s no secret that the study of extrasolar planets has exploded since the turn of the century. Whereas astronomers knew less than a dozen exoplanets twenty years ago, thousands of candidates are available for study today. In fact, as of January 13th, 2023, a total of 5,241 planets have been confirmed in 3,916 star systems, with another 9,169 candidates awaiting confirmation. While opportunities for exoplanet research have grown exponentially, so too has the arduous task of sorting through the massive amounts of data involved.
Hence why astronomers, universities, research institutes, and space agencies have come to rely on citizen scientists in recent years. With the help of online resources, data-sharing, and networking, skilled amateurs can lend their time, energy, and resources to the hunt for planets beyond our Solar System. In recognition of their importance, NASA has launched Exoplanet Watch, a citizen science project sponsored by NASA’s Universe of Learning. This project lets regular people learn about exoplanets and get involved in the discovery and characterization process.
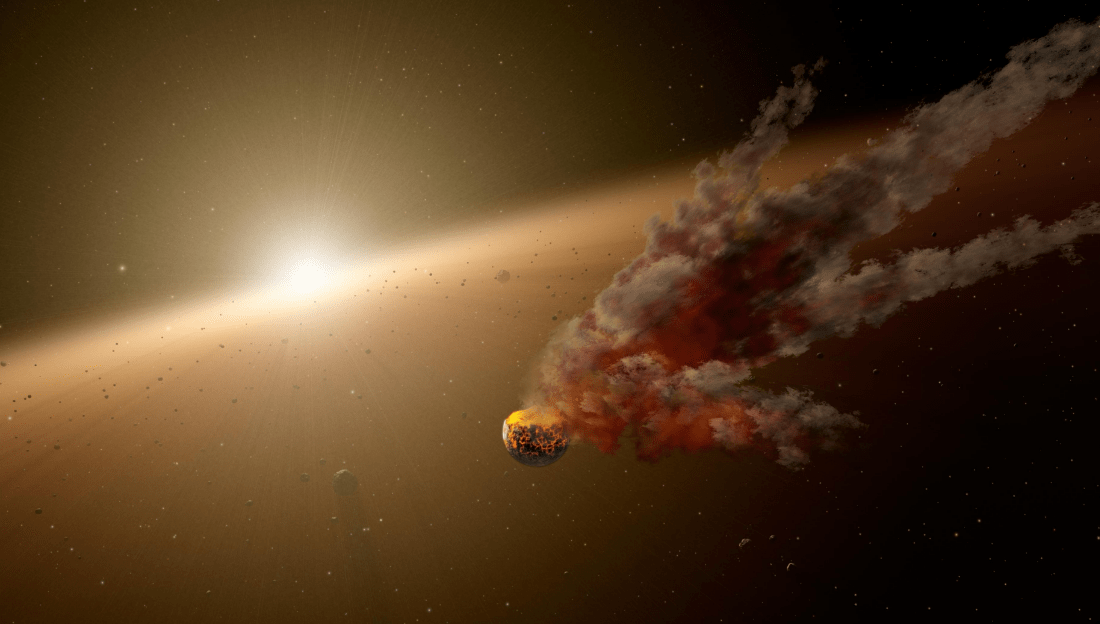
Artist's concept of KIC 8462852, which has experienced unusual changes in luminosity over the past few years. Credit: NASA, JPL-Caltech
Last fall, astronomers were surprised when the Kepler mission reported some anomalous readings from KIC 8462852 (aka. Tabby’s Star). After noticing a strange and sudden drop in brightness, speculation began as to what could be causing it – with some going so far as to suggest that it was an alien megastructure. Naturally, the speculation didn’t last long, as further observations revealed no signs of intelligent life or artificial structures.
But the mystery of the strange dimming has not gone away. What’s more, in a paper posted this past Friday to arXiv, Benjamin T. Montet and Joshua D. Simon (astronomers from the Cahill Center for Astronomy and Astrophysics at Caltech and the Carnegie Institute of Science, respectively) have shown how an analysis of the star’s long-term behavior has only deepened the mystery further.
To recap, dips in brightness are quite common when observing distant stars. In fact, this is one of the primary techniques employed by the Kepler mission and other telescopes to determine if planets are orbiting a star (known as Transit Method). However, the “light curve” of Tabby’s Star – named after the lead author of the study that first detailed the phenomena (Tabetha S. Boyajian) – was particularly pronounced and unusual.
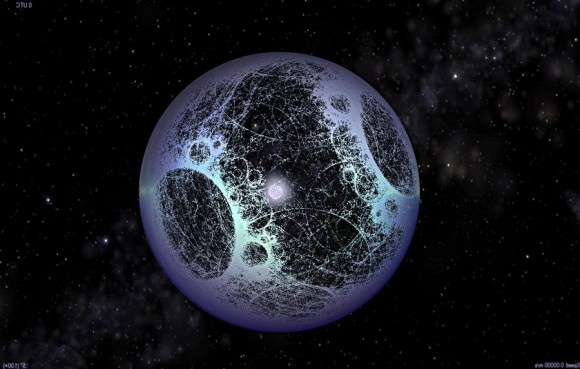
Freeman Dyson theorized that eventually, a civilization would be able to build a megastructure around its star to capture all its energy. Credit: SentientDevelopments.com
According to the study, the star would experience a ~20% dip in brightness, which would last for between 5 and 80 days. This was not consistent with a transitting planet, and Boyajian and her colleagues hypothesized that it was due to a swarm of cold, dusty comet fragments in a highly eccentric orbit accounted for the dimming.
However, others speculated that it could be the result of an alien megastructure known as Dyson Sphere (or Swarm), a series of structures that encompass a star in whole or in part. However, the SETI Institute quickly weighed in and indicated that radio reconnaissance of KIC 8462852 found no evidence of technology-related radio signals from the star.
Other suggestions were made as well, but as Dr. Simon of the Carnegie Institute of Science explained via email, they fell short. “Because the brief dimming events identified by Boyajian et al. were unprecedented, they sparked a wide range of ideas to explain them,” he said. “So far, none of the proposals have been very compelling – in general, they can explain some of the behavior of KIC 8462852, but not all of it.”
To put the observations made last Fall into a larger context, Montet and Simon decided to examine the full-frame photometeric images of KIC 8462852 obtained by Kepler over the last four years. What they found was that the total brightness of the star had been diminishing quite astonishingly during that time, a fact which only deepens the mystery of the star’s light curve.
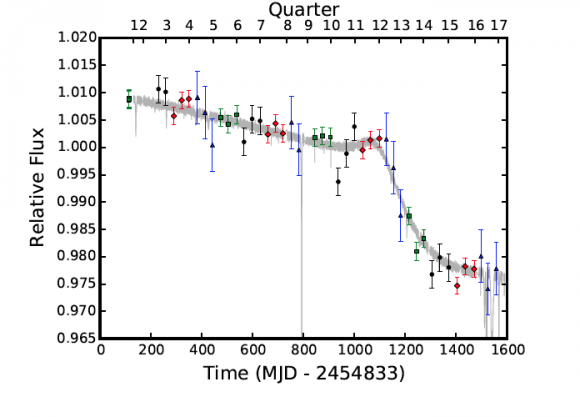
Photometry of KIC8462852 obtained by the Kepler mission, showing a period of more rapid decline during the later period of observation. Credit: Montet & Simon 2016
As Dr. Montet told Universe Today via email:
“Every 30 minutes, Kepler measures the brightness of 160,000 stars in its field of view (100 square degrees, or approximately as big as your hand at arm’s length). The Kepler data processing pipeline intentionally removes long-term trends, because they are hard to separate from instrumental effects and they make the search for planets harder. Once a month though, they download the full frame, so the brightness of every object in the field can be measured. From this data, we can separate the instrumental effects from astrophysical effects by seeing how the brightness of any particular star changes relative to all its neighboring stars.”
Specifically, they found that over the course of the first 1000 days of observation, the star experienced a relatively consistent drop in brightness of 0.341% ± 0.041%, which worked out to a total dimming of 0.9%. However, during the next 200 days, the star dimmed much more rapidly, with its total stellar flux dropping by more than 2%.
For the final 200 days, the star’s magnitude once again consistent and similar to what it was during the first 1000 – roughly equivalent to 0.341%. What is impressive about this is the highly anomalous nature of it, and how it only makes the star seem stranger. As Simon put it:
“Our results show that over the four years KIC 8462852 was observed by Kepler, it steadily dimmed. For the first 2.7 years of the Kepler mission the star faded by about 0.9%. Its brightness then decreased much faster for the next six months, declining by almost 2.5% more, for a total brightness change of around 3%. We haven’t yet found any other Kepler stars that faded by that much over the four-year mission, or that decreased by 2.5% in six months.”
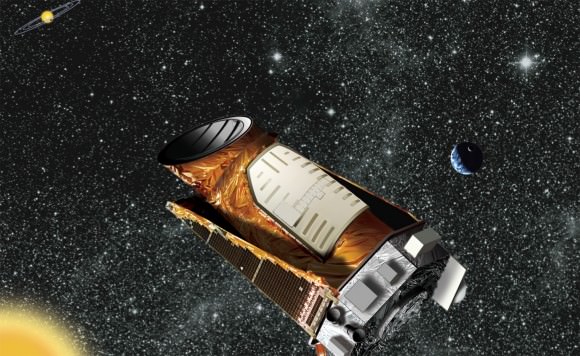
Artist’s conception of the Kepler Space Telescope. Credit: NASA/JPL-Caltech
Of the over 150,000 stars monitored by the Kepler mission, Tabby’s Starr is the only one known to exhibit this type of behavior. In addition, Monetet and Cahill compared the results they obtained to data from 193 nearby stars that had been observed by Kepler, as well as data obtained on 355 stars with similar stellar parameters.
From this rather large sampling, they found that a 0.6% change in luminosity over a four year period – which worked out to about 0.341% per year – was quite common. But none ever experienced the rapid decline of more than 2% that KIC 8462852 experienced during that 200 days interval, or the cumulative fading of 3% that it experienced overall.
Montet and Cahill looked for possible explanations, considering whether the rapid decline could be caused by a cloud of transiting circumstellar material. But whereas some phenomena can explain the long-term trend, and other the short-term trend, no one explanation can account for it all. As Montet explained:
“We propose in our paper that a cloud of gas and dust from the remnants of a planetesimal after a collision in the outer solar system of this star could explain the 2.5% dip of the star (as it passes along our line of sight). Additionally, if some clumps of matter from this collision were collided into high-eccentricity comet-like orbits, they could explain the flickering from Boyajian et al., but this model doesn’t do a nice job of explaining the long-term dimming. Other researchers are working to develop different models to explain what we see, but they’re still working on these models and haven’t submitted them for publication yet. Broadly speaking, all three effects we observe cannot be explained by any known stellar phenomenon, so it’s almost certainly the result of some material along our line of sight passing between us and the star. We just have to figure out what!”
So the question remains, what accounts for this strange dimming effect around this star? Is there yet some singular stellar phenomena that could account for it all? Or is this just the result of good timing, with astronomers being fortunate enough to see a combination of a things at work in the same period? Hard to say, and the only way we will know for sure is to keep our eye on this strangely dimming star.
And in the meantime, will the alien enthusiasts not see this as a possible resolution to the Fermi Paradox? Most likely!
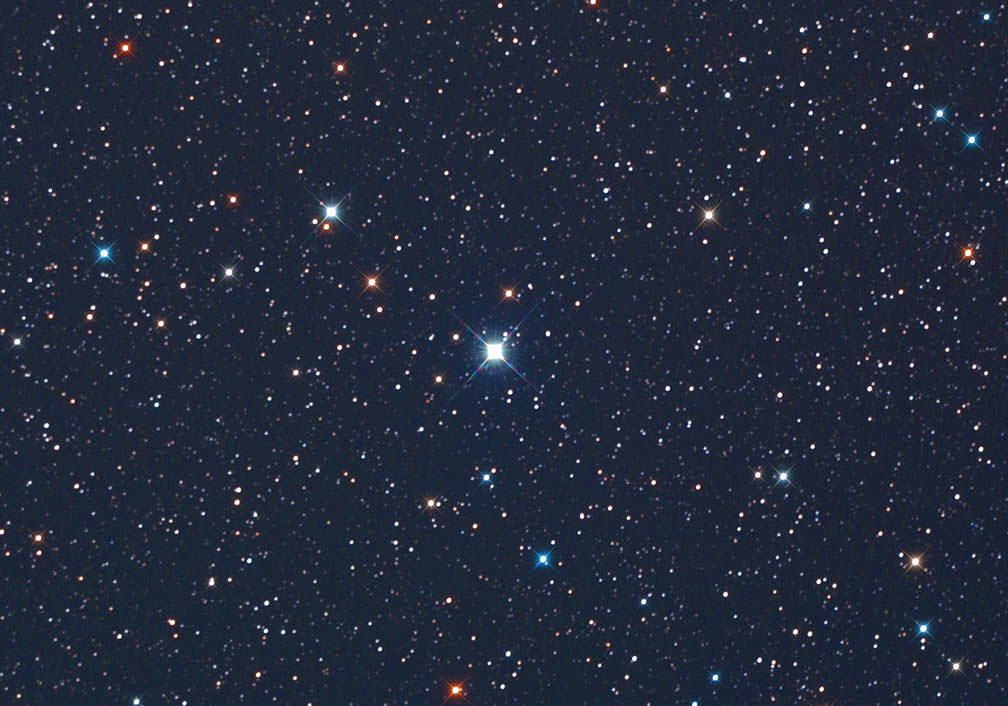
Nova Delphini (center) continues to shine brightly enough to see in binoculars and with the naked eye once the moon's out of the sky. While we still don't know its distance, novae like this one are typically between 1,000 to 1,500 light years away. Credit: John Chumack
And now for something to appeal to your inner geek. Or, if you’re like me, your outer geek. Many of you have been watching the new nova in Delphinus with the naked eye and binoculars since it burst onto the scene early Aug. 14. In a moment I’ll show how to turn your observations into a cool representation of the nova’s behavior over time.
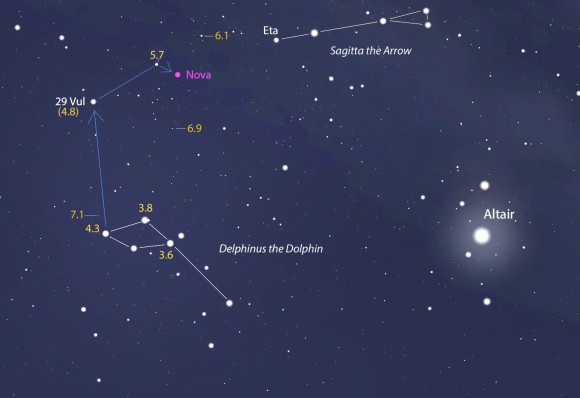
Updated Nova Delphini 2013 chart using the latest visual magnitudes from the AAVSO showing stars around the nova to magnitude 7.1. Click for larger version. Stellarium
Where I live in northern Minnesota, we’ve had a lucky run of clear nights since the outburst began. Each night I’ve gone out with my 8×40 binoculars and star chart to estimate the nova’s brightness. The procedure is easy and straightforward. You find comparison stars near the nova with known magnitudes, then select one a little brighter and one a little fainter and interpolate between the two to arrive at the nova’s magnitude.
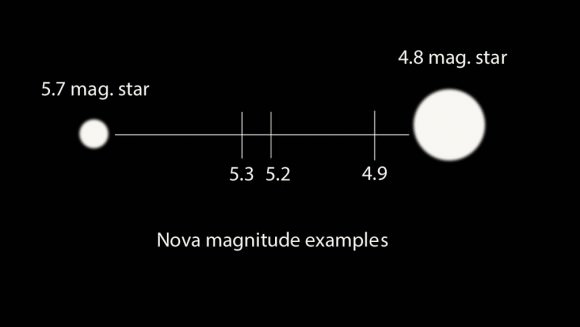
Estimating a star’s magnitude by creating a sliding scale in your mind’s eye between stars that bracket the nova in brightness. Illustration: Bob King
For example, if the nova’s brightness lies halfway between the magnitude 4.8 and 5.7 stars it’s about magnitude 5.3. The next night you might notice it’s not exactly halfway but a tad brighter or closer to the 4.8 star. Then you’d measure 5.2. Remember that the smaller the number, the brighter the object. I’ve found that defocusing the stars into disks makes it a bit easier to estimate these differences.
In time, you’ll come up with a list of magnitudes or brightness estimates for Nova Delphini. Here’s mine to date:
* Aug. 14: 5.8
* Aug. 15: 4.9
* Aug. 16: 5.0
* Aug. 17: 5.0
* Aug. 18: 5.0
* Aug. 19: 5.2
* Aug. 20: 5.5
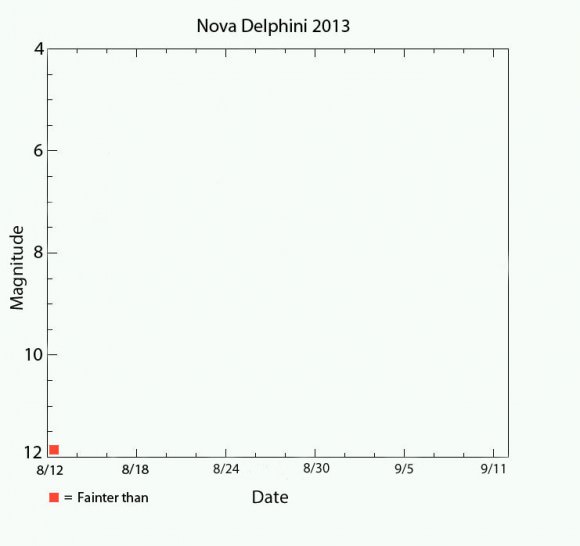
Template you can use to plot your own estimates of Nova Delphini 2013’s night by night brightness through Sept. 11. Click for larger version.
So far just numbers, but there’s a way to turn this into a satisfying visual picture of the nova’s long-term behavior. Graph it! That’s what astronomers do, and they call it a light curve.
I dug around and came up with this very basic template. The horizontal or x-axis measures time in days, the vertical or y-axis plots the nova’s brightness measured in magnitudes. You can either right-click and save the image above or grab the higher-res version HERE.
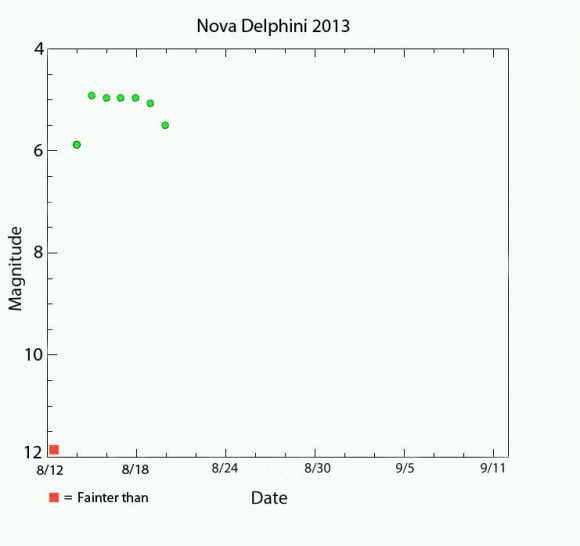
I plotted my own brightness estimates of the nova using Photoshop Elements. You can do it on computer or with paper and pencil.
Next, print out a copy and lay in your data points with pencil and ruler the old-fashioned way or use an imaging program like Photoshop or Paint to do the same on the computer. I use a very basic version of Photoshop Elementsto plot my observations. Once your observations are marked, connect them to build your light curve.
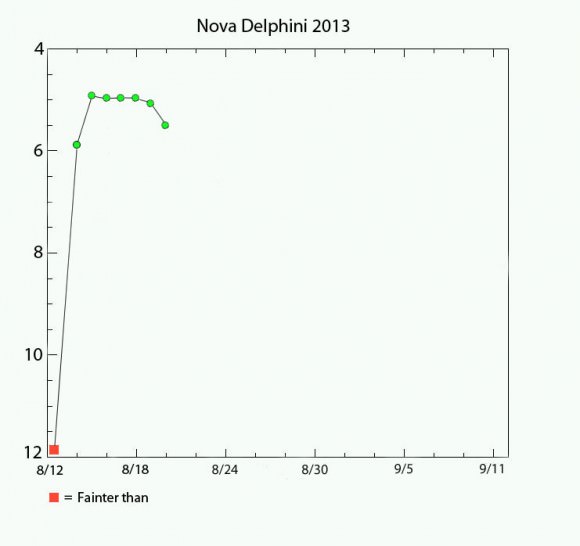
Connecting the dots, we can start to see how the nova behaves over time. The sudden jump from obscurity as well as the brief plateau before fading are obvious.
Right away you’ll notice a few interesting things. The nova shot up from approximately 17th magnitude on Aug. 13 to 6.8 on Aug. 14 – a leap of more than 10 magnitudes, which translates to a nearly 10,000 fold increase in brightness.
I wasn’t able to see the Nova Del top out at around 4.4 magnitude – that happened when I was asleep the next morning – but I did catch it at 4.9. The next few days the nova hits a plateau followed by what appears for the moment like a steady decline in brightness. Will it rocket back up or continue to fade? That’s for you and your binoculars to find out the next clear night.
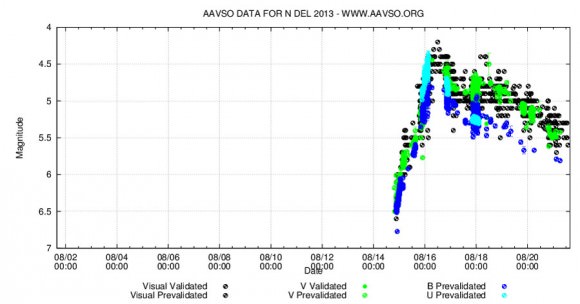
AAVSO light curve to date for Nova Delphini 2013 created using their light curve generator. The plot includes observations from many observers. Copyright: AAVSO
If you’d like to take the next step and contribute your observations for scientific use, head over to the AAVSO (American Assn. of Variable Star Observers) and become a member. Even if you don’t sign up, access to data, charts and light curves of novae and other variable stars is completely free.
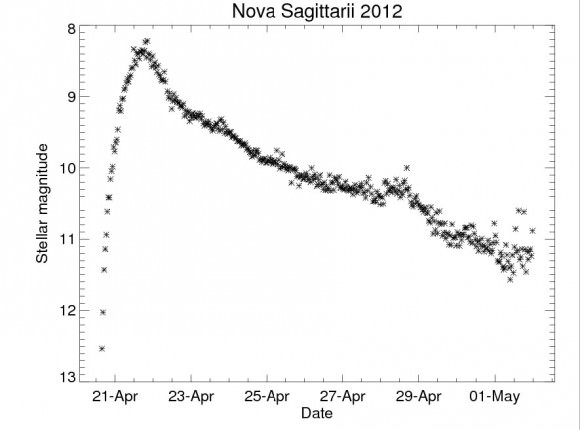
Nova Sagittarii 2012 light curve. Notice the occasional plateaus as well as bumps in brightness as it faded back to minimum light. Credit: NASA
I get a kick out of comparing my basic light curves with those created with thousands of observations contributed by hundreds of observers. The basic AAVSO curve looks all scrunched up for the moment because their time scale (x-axis) is much longer term than in my simple example. But guess what? You can change the scale using their light curve generatorand open up the view a little more as I did in the curve above.
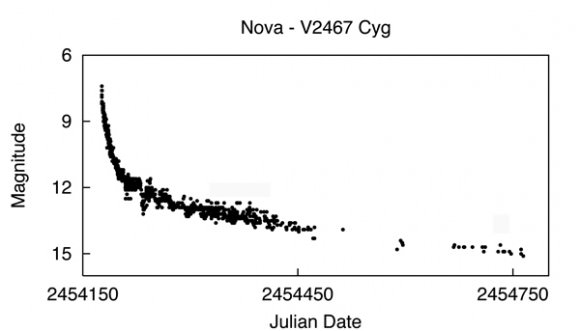
Light curve of V2467 Cygni, a nova that appeared in Cygnus in 2007. Credit: AAVSO
Here are a couple other typical novae light curves. By the time you’re done looking at the examples here as well as creating your own, you’ll gain a familiarity that may surprise you. Not only will be able to interpret trends in Nova Delphini’s brightness, but you’ll better understand the behavior of other variable stars at a glance. It’s as easy as connecting the dots.