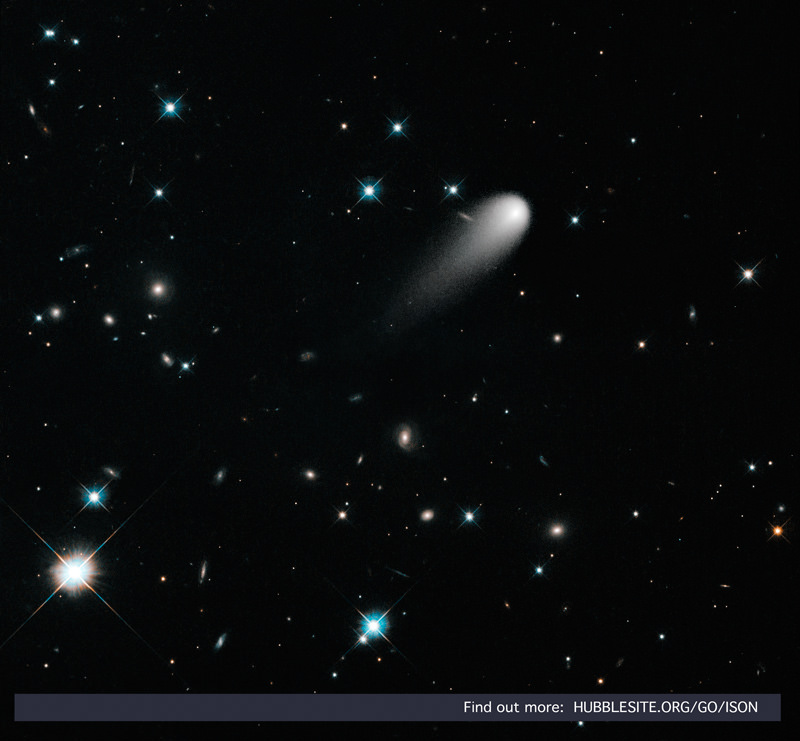
Comet ISON seen against a background of stars and galaxies (Source: /hubblesite.org)
This image of the steadily-approaching Comet ISON, made from observations with the Hubble Space Telescope on April 30, show not only the comet itself but also a rich background of stars located within our own galaxy and even the distant spirals of entire galaxies much, much farther away — as Josh Sokol describes it on HubbleSite.org’s ISONblog it’s like the astronomy stickers you’d get for your kid’s bedroom, except you’d never get to see such a scene in real life “unless, of course, you had Hubble.”
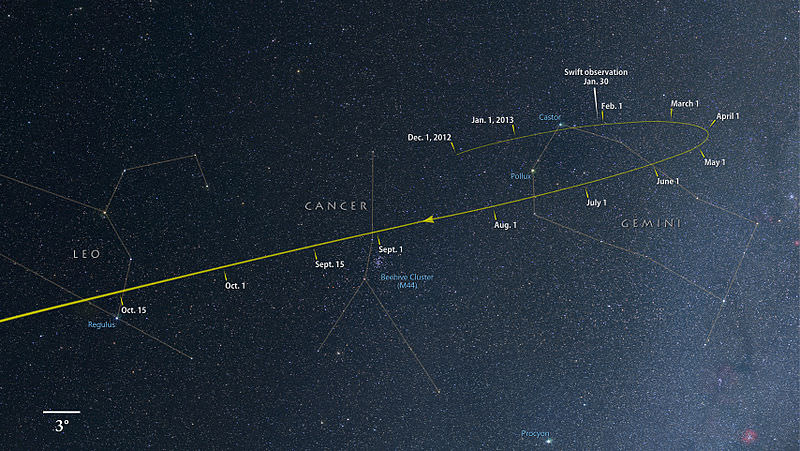
Comet C/2012 S1 (ISON) is currently on its way into the inner Solar System on course for a close encounter with the Sun, zooming along at 77,250 km/h (48,000 miles per hour). It will make its closest pass by the Sun on November 28 (coming within just .012 AU) and will hopefully put on a pretty spectacular show in the night sky — especially if it survives the trip.
Comet ISON’s projected path through the night sky prior to perihelion. (Credit: NASA/GSFC/Axel Mellinger)
The image above was created from multiple Hubble observations earlier this year, some geared toward capturing ISON and others calibrated more for distant, dimmer objects like galaxies and far-flung stars. By combining the results we get a view of a comet speeding through space with an almost too-perfect hyperrealism, courtesy of NASA’s hardest-working space telescope.
“The result is part science, part art. It’s a simulation of what our eyes, with their ability to dynamically adjust to brighter and fainter objects, would see if we could look up at the heavens with the resolution of Hubble. The result is a hodepodge of almost all the meat-and-potatoes subjects of astronomy – no glow-in-the-dark stickers required.”
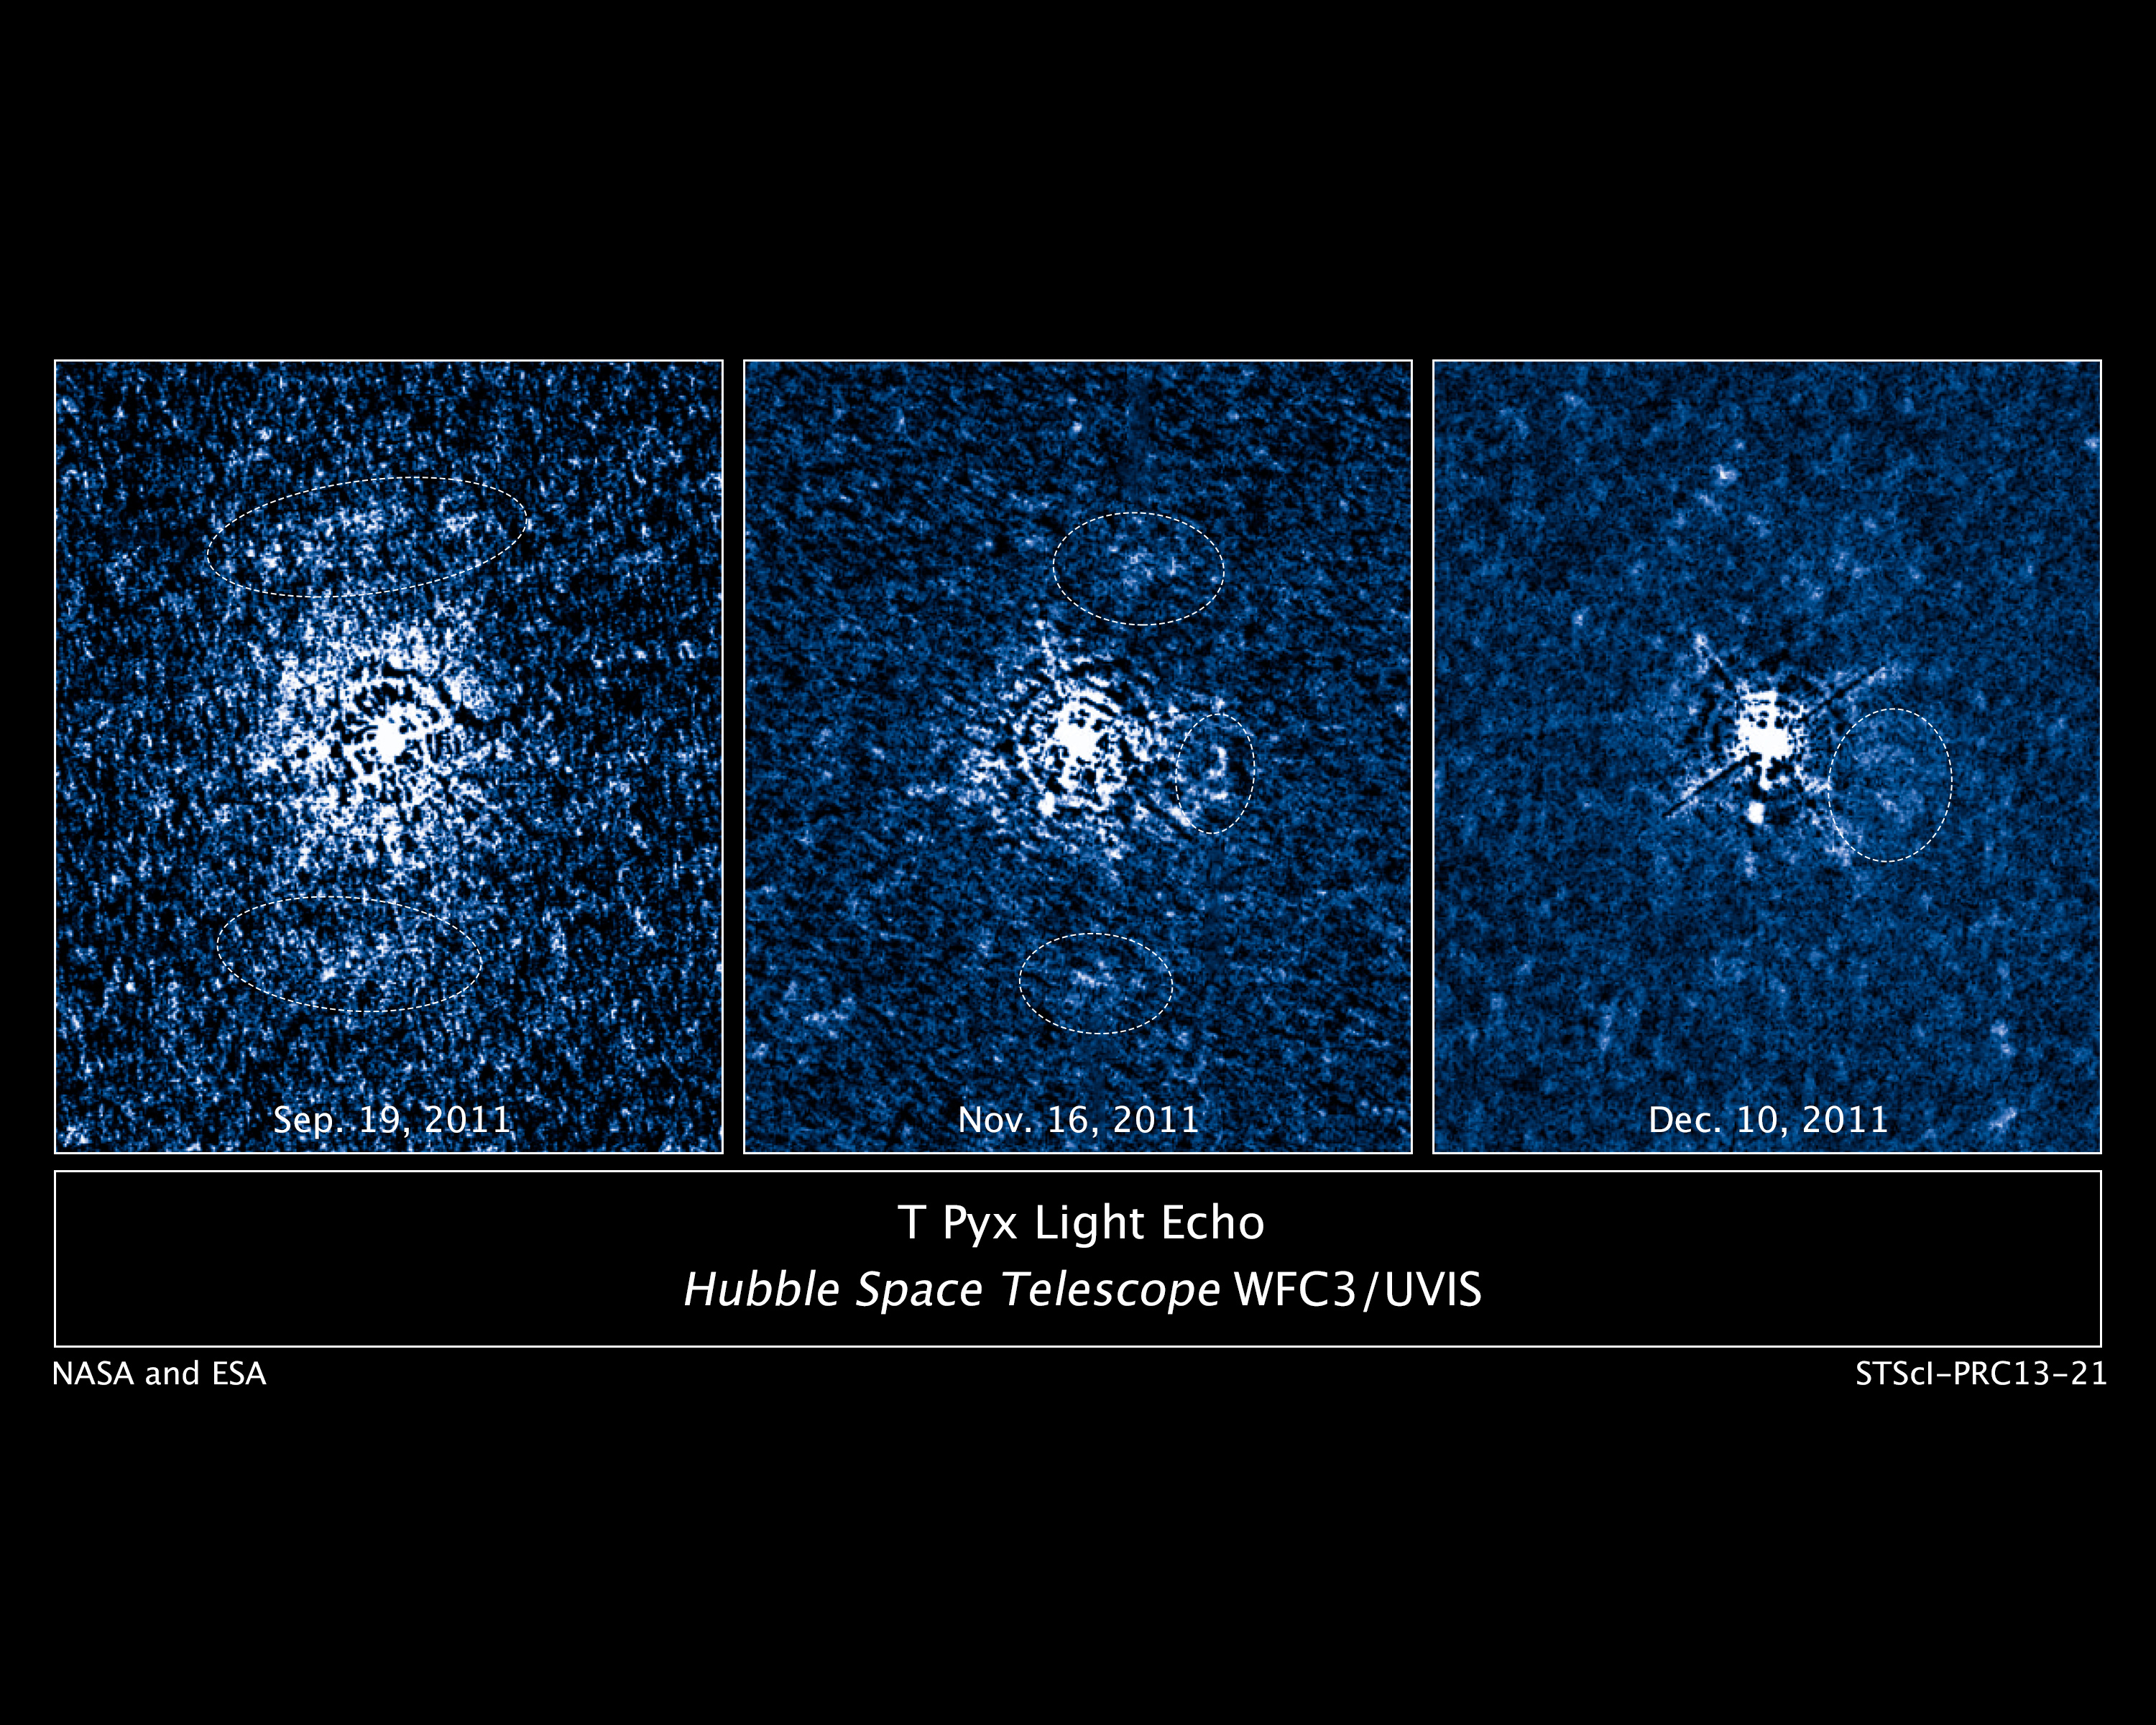
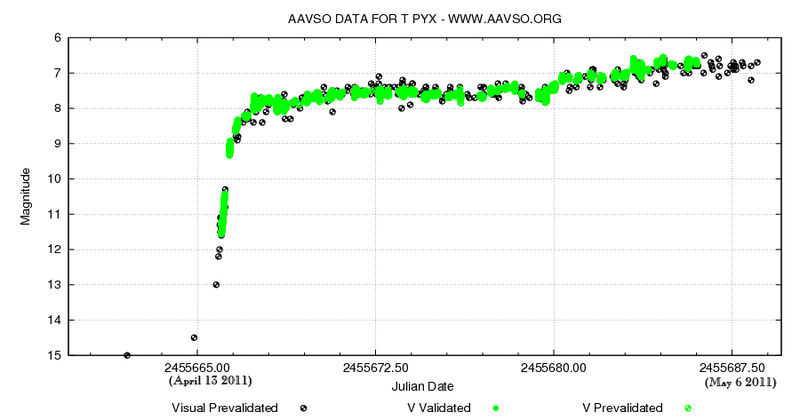
A sequence of images showing the light echo (circled) enshrouding T Pyxidis months after the April 2011 outburst. (Credit: NASA/ESA/A. Crotts/J. Sokoloski, H. Uthas & S. Lawrence).
Some of the most violent events in our Universe were the topic of discussion this morning at the 222nd meeting of the American Astronomical Society in Indianapolis, Indiana as researchers revealed recent observations of light echoes seen as the result of stellar explosions.
A light echo occurs when we see dust and ejected material illuminated by a brilliant nova. A similar phenomenon results in what is termed as a reflection nebula. A star is said to go nova when a white dwarf star siphons off material from a companion star. This accumulated hydrogen builds up under terrific pressure, sparking a brief outburst of nuclear fusion.
A very special and rare case is a class of cataclysmic variables known as recurrent novae. Less than dozen of these types of stars are known of in our galaxy, and the most famous and bizarre case is that of T Pyxidis.
Located in the southern constellation of Pyxis, T Pyxidis generally hovers around +15th magnitude, a faint target even in a large backyard telescope. It has been prone, however, to great outbursts approaching naked eye brightness roughly every 20 years to magnitude +6.4. That’s a change in brightness almost 4,000-fold.
But the mystery has only deepened surrounding this star. Eight outbursts were monitored by astronomers from 1890 to 1966, and then… nothing. For decades, T Pyxidis was silent. Speculation shifted from when T Pyxidis would pop to why this star was suddenly undergoing a lengthy phase of silence.
Could models for recurrent novae be in need of an overhaul?
T Pyxidis finally answered astronomers’ questions in 2011, undergoing its first outburst in 45 years. And this time, they had the Hubble Space Telescope on hand to witness the event.
Light curve of the 2011 eruption of T Pyxidis. (Credit: AAVSO).
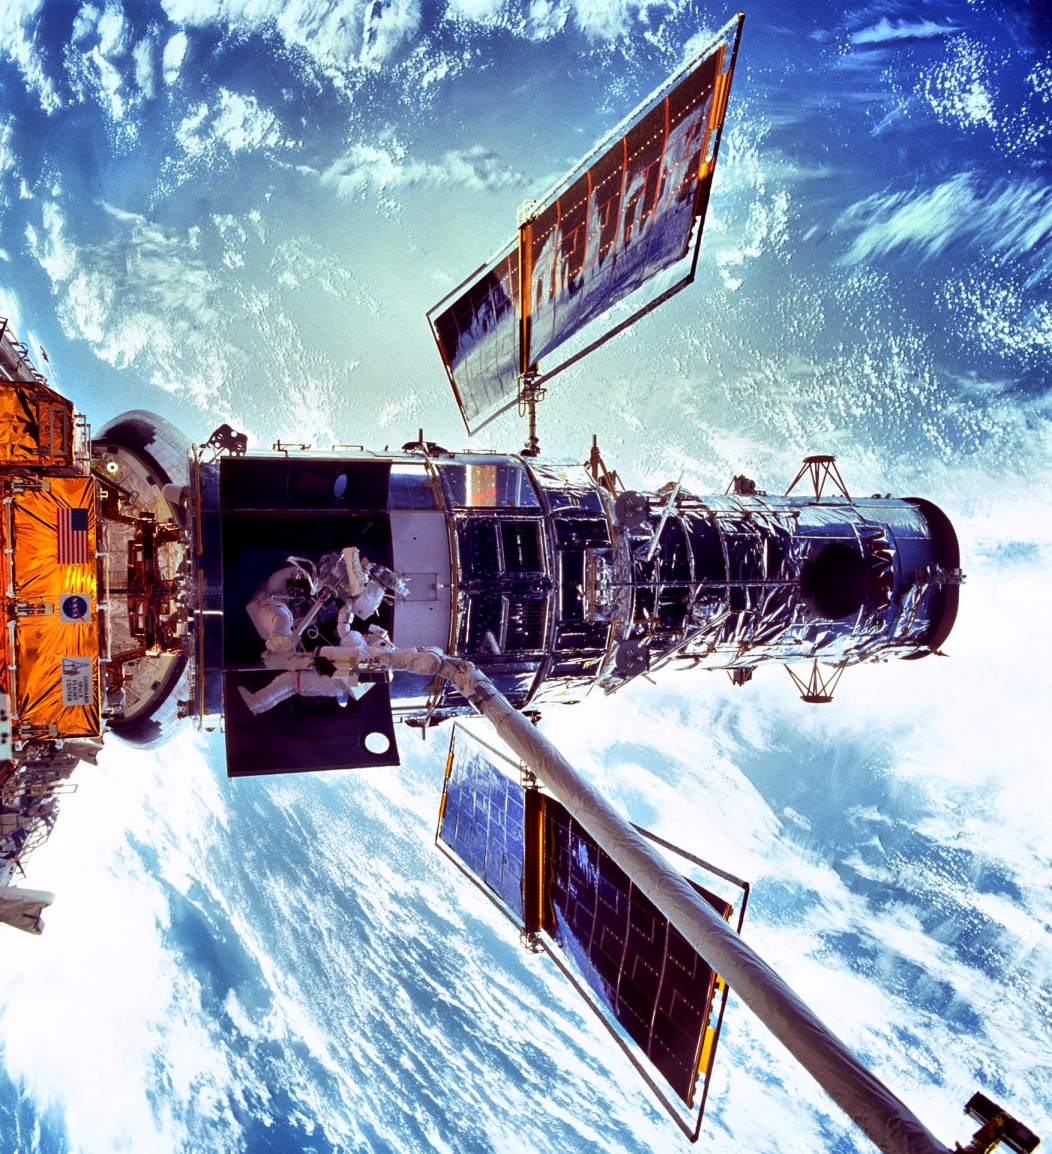
In fact, Hubble had just been refurbished during the final visit of the space shuttle Atlantis to the orbiting observatory in 2009 on STS-125 with the installation of its Wide Field Camera 3, which was used to monitor the outburst of T Pyxidis.
The Hubble observation of the light echo provided some surprises for astronomers as well.
“We fully expected this to be a spherical shell,” Said Columbia University’s Arlin Crotts, referring to the ejecta in the vicinity of the star. “This observation shows it is a disk, and it is populated with fast-moving ejecta from previous outbursts.”
Indeed, this discovery raises some exciting possibilities, such as providing researchers with the ability to map the anatomy of previous outbursts from the star as the light echo evolves and illuminates the 3-D interior of the disk like a Chinese lantern. The disk is inclined about 30 degrees to our line of sight, and researchers suggest that the companion star may play a role in the molding of its structure from a sphere into a disk. The disk of material surrounding T Pyxidis is huge, about 1 light year across. This results in an apparent ring diameter of 6 arc seconds (about 1/8th the apparent size of Jupiter at opposition) as seen from our Earthly vantage point.
Paradoxically, light echoes can appear to move at superluminal speeds. This illusion is a result of the geometry of the path that the light takes to reach the observer, crossing similar distances but arriving at different times.
And speaking of distance, measurement of the light echoes has given astronomers another surprise. T Pyxidis is located about 15,500 light years distant, at the higher 10% end of the previous 6,500-16,000 light year estimated range. This means that T Pyxidis is an intrinsically bright object, and its outbursts are even more energetic than thought.
Light echoes have been studied surrounding other novae, but this has been the first time that scientists have been able to map them extensively in 3 dimensions.
An artist’s conception of the disk of material surrounding T Pyxidis. (Credit: ESA/NASA & A. Feild STScl/AURA).
“We’ve all seen how light from fireworks shells during the grand finale will light up the smoke and soot from the shells earlier in the show,” said team member Stephen Lawrence of Hofstra University. “In an analogous way, we’re using light from T Pyx’s latest outburst and its propagation at the speed of light to dissect its fireworks displays from decades past.”
Researchers also told Universe Today of the role which amateur astronomers have played in monitoring these outbursts. Only so much “scope time” exists, very little of which can be allocated exclusively to the study of light echoes. Amateurs and members of the American Association of Variable Star Observers (AAVSO) are often the first to alert the pros that an outburst is underway. A famous example of this occurred in 2010, when Florida-based backyard observer Barbara Harris was the first to spot an outburst from recurrent novae U Scorpii.
And although T Pyxidis may now be dormant for the next few decades, there are several other recurrent novae worth continued scrutiny:
Name
Max brightness
Right Ascension
Declination
Last Eruption
Period(years)
U Scorpii
+7.5
16H 22’ 31”
-17° 52’ 43”
2010
10
T Pyxidis
+6.4
9H 04’ 42”
-32° 22’ 48”
2011
20
RS Ophiuchi
+4.8
17H 50’ 13”
-6° 42’ 28”
2006
10-20
T Coronae Borealis
+2.5
15H 59’ 30”
25° 55’ 13”
1946
80?
WZ Sagittae
+7.0
20H 07’ 37”
+17° 42’ 15”
2001
30
Clearly, recurrent novae have a tale to tell us of the role they play in the cosmos. Congrats to Lawrence and team on the discovery… keep an eye out from future fireworks from this rare class of star!
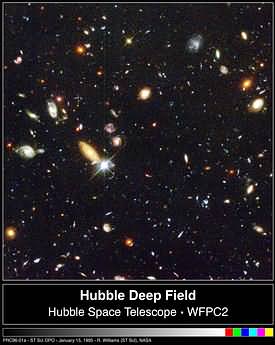
“Hubble: Galaxies Across Space and Time” is an award-winning IMAX Super Short film. In less than 3 minutes you can explore 10 billion years of cosmic history as you fly through one of Hubble’s iconic images, the Hubble Deep Field. These galaxies were photographed by the Hubble Space Telescope as part of the Great Observatory Origins Deep Survey (GOODS) project. Hubble scientists and imaging specialists worked for months to extract individual galaxy images, placing them in a 3-D model according to their approximate true distances.
If you ever have the chance to see the big screen version of “Hubble 3-D IMAX,” do it. It’s an incredible cinematic view that portrays the immensity and gloriousness of our Universe like no other film I’ve seen. You can read my review of it here.
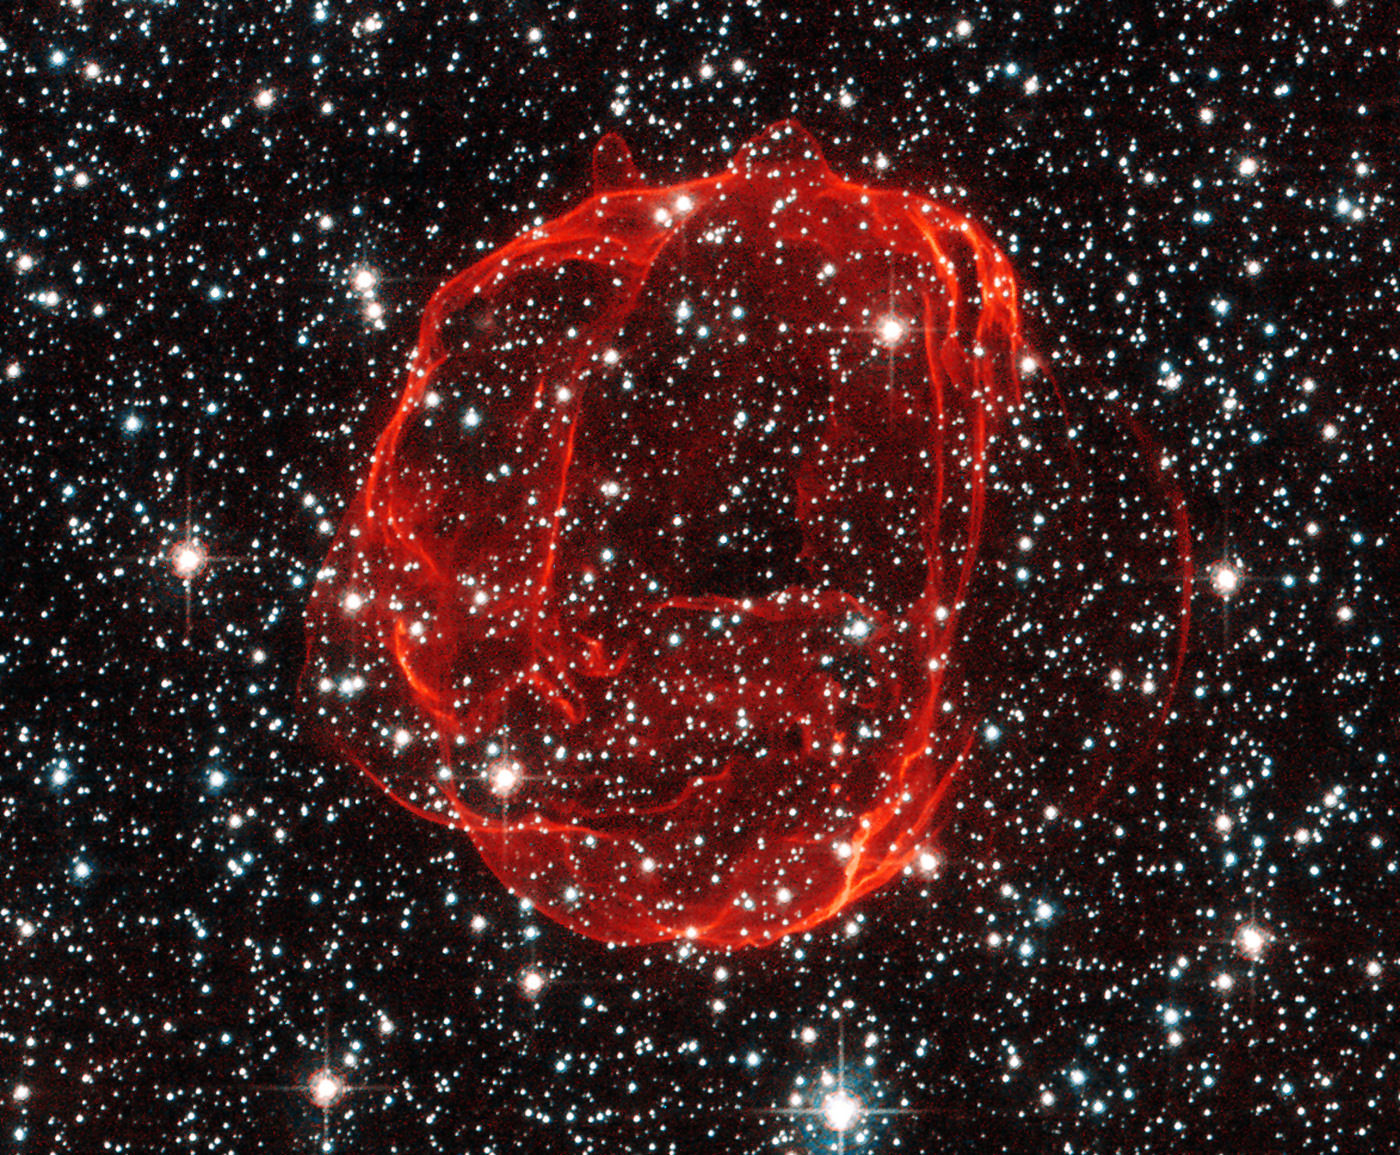
Hubble image of SNR 0519, the remains of a Type Ia supernova in the Large Magellanic Cloud
Stars like our Sun can last for a very long time (in human terms, anyway!) somewhere in the neighborhood of 10-12 billion years. Already over 4.6 billion years old, the Sun is entering middle age and will keep on happily fusing hydrogen into helium for quite some time. But eventually even stars come to the end of their lives, and their deaths are some of the most powerful — and beautiful — events in the Universe.
The wispy, glowing red structures above are the remains of a white dwarf in the neighboring Large Magellanic Cloud 150,000 light-years away. Supernova remnant SNR 0519 was created about 600 years ago (by our time) when a star like the Sun, in the final stages of its life, gathered enough material from a companion to reach a critical mass and then explode, casting its outer layers far out into space to create the cosmic rose we see today.
As the hydrogen material from the star plows outwards through interstellar space it becomes ionized, glowing bright red.
SNR 0519 is the result of a Type Ia supernova, which are the result of one white dwarf within a binary pair drawing material onto itself from the other until it undergoes a core-collapse and blows apart violently. The binary pair can be two white dwarfs or a white dwarf and another type of star, such as a red giant, but at least one white dwarf is thought to always be the progenitor.
A recent search into the heart of the remnant found no surviving post-main sequence stars, suggesting that SNR 0519 was created by two white dwarfs rather than a mismatched pair. Both stars were likely destroyed in the explosion, as any non-degenerate partner would have remained.
We record the Weekly Space Hangout every Friday at 12 pm Pacific / 3 pm Eastern. You can watch us live on Google+, Cosmoquest or listen after as part of the Astronomy Cast podcast feed (audio only).
“No scientific discovery is named after its discoverer,” – Stigler/Merton.
Edwin Hubble’s contributions to astronomy earned him the honor of having his name bestowed upon arguably the most famous space telescope (the Hubble Space Telescope, HST). Contributions that are often attributed to him include the discovery of the extragalactic scale (there exist countless other galaxies beyond the Milky Way), the expanding Universe (the Hubble constant), and a galaxy classification system (the Hubble Tuning Fork). However, certain astronomers are questioning Hubble’s pre-eminence in those topics, and if all the credit is warranted.
“[The above mentioned] discoveries … are well-known … and most astronomers would associate them solely with Edwin Hubble; yet this is a gross oversimplification. Astronomers and historians are beginning to revise that standard story and bring a more nuanced version to the public’s attention,” said NASA scientist Michael J. Way, who just published a new study entitled “Dismantling Hubble’s Legacy?”
Has history clouded our view of Hubble the man? Or are his contributions seminal to where we are today in astronomy?
Assigning credit for a discovery is not always straightforward, and Way 2013 notes, “How credit is awarded for a discovery is often a complex issue and should not be oversimplified – yet this happens time and again. Another well-known example in this field is the discovery of the Cosmic Microwave Background.” Indeed, controversy surrounds the discovery of the Universe’s accelerated expansion, which merely occurred in the late 1990s. Conversely, the discoveries attributed to Hubble transpired during the ~1920s.
The Hubble Space Telescope (image credit: NASA, tweaked by D. Majaess).
Prior to commencing this discussion, it’s emphasized that Hubble cannot defend his contribution since he died long ago (1889-1953). Moreover, we can certainly highlight the efforts of other individuals whose seminal contributions were overlooked without mitigating Hubble’s pertinence. The first topic discussed here is the discovery of the extragalactic scale. Prior to the 1920s it was unclear whether the Milky Way galaxy and the Universe were synonymous. In other words, was the Milky Way merely one among countless other galaxies?
Astronomers H. Shapley and H. Curtis argued the topic in the famed Island Universe debate (1920). Curtis believed in the extragalactic Universe, whereas Shapley took the opposing view (see also Trimble 1995 for a review). In the present author’s opinion, Hubble’s contributions helped end that debate a few years later and changed the course of astronomy, namely since he provided evidence of an extragalactic Universe using a distance indicator that was acknowledged as being reliable. Hubble used stars called Cepheid variables to help ascertain that M31 and NGC 6822 were more distant than the estimated size of the Milky Way, which in concert with their deduced size, implied they were galaxies. Incidentally, Hubble’s distances, and those of others, were not as reliable as believed (e.g., Fernie 1969, Peacock 2013). Peacock 2013 provides an interesting comparison between distance estimates cited by Hubble and Lundmark with present values, which reveals that both authors published distances that were flawed in some manner. Having said that, present-day estimates are themselves debated.
Hubble’s evidence helped convince even certain staunch opponents of the extragalactic interpretation such as Shapley, who upon receiving news from Hubble concerning his new findings remarked (1924), “Here is the letter that has destroyed my universe.” Way 2013 likewise notes that, “The issue [concerning the extragalactic scale] was effectively settled by two papers from Hubble in 1925 in which he derived distances from Cepheid variables found in M31 and M33 (Hubble 1925a) of 930,000 light years and in NGC 6822 (Hubble 1925c) of 700,000 light years.”
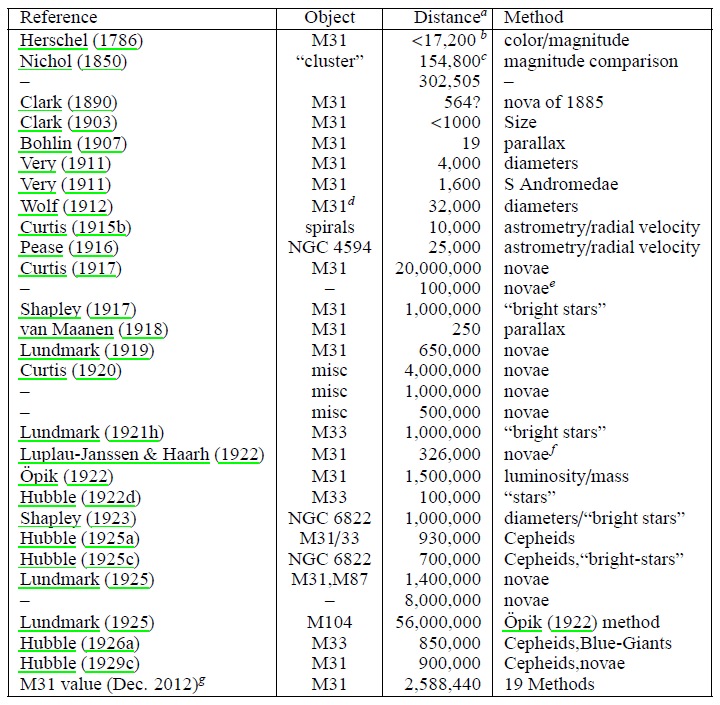
However, as table 1 from Way 2013 indicates (shown below), there were numerous astronomers who published distances that implied there were galaxies beyond the Milky Way. Astronomer Ian Steer, who helps maintain the NASA/IPAC Extragalactic Database of Redshift-Independent Distances (NED-D), has also compiled a list of 290 distances to galaxies published before 1930. Way 2013 added that, “Many important contributions to this story have been forgotten and most textbooks in astronomy today, if they discuss the “Island Universe” confirmation at all, bestow 100% of the credit on Hubble with scant attention to the earlier observations that clearly supported his measurements.”
Thus Hubble did not discover the extragalactic scale, but his work helped convince a broad array of astronomers of the Universe’s enormity. However, by comparison to present-day estimates, Hubble’s distances are too short owing partly to the existing Cepheid calibration he utilized (Fernie 1969, Peacock 2013 also notes that Hubble’s distances were flawed for other reasons). That offset permeated into certain determinations of the expansion rate of the Universe (the Hubble constant), making the estimate nearly an order of magnitude too large, and the implied age for the Universe too small.
Way 2013 notes, “Table 1 lists all of the main distance estimates to spiral nebulae (known to this author) from the late 1800s until 1930 when standard candles began to be found in spiral nebulae [galaxies].” (image credit: Way 2013/arXiv).Hubble’s accreditation as the discoverer of the expanding Universe (the Hubble constant) has generated considerable discussion, which is ultimately tied to the discovery of a relationship between a galaxy’s velocity and its distance. An accusation even surfaced that Hubble may have censored the publication of another scientist to retain his pre-eminence. That accusation has since been refuted, but provides the reader an indication of the tone of the debate (see Livio 2012 (Nature), and references therein).
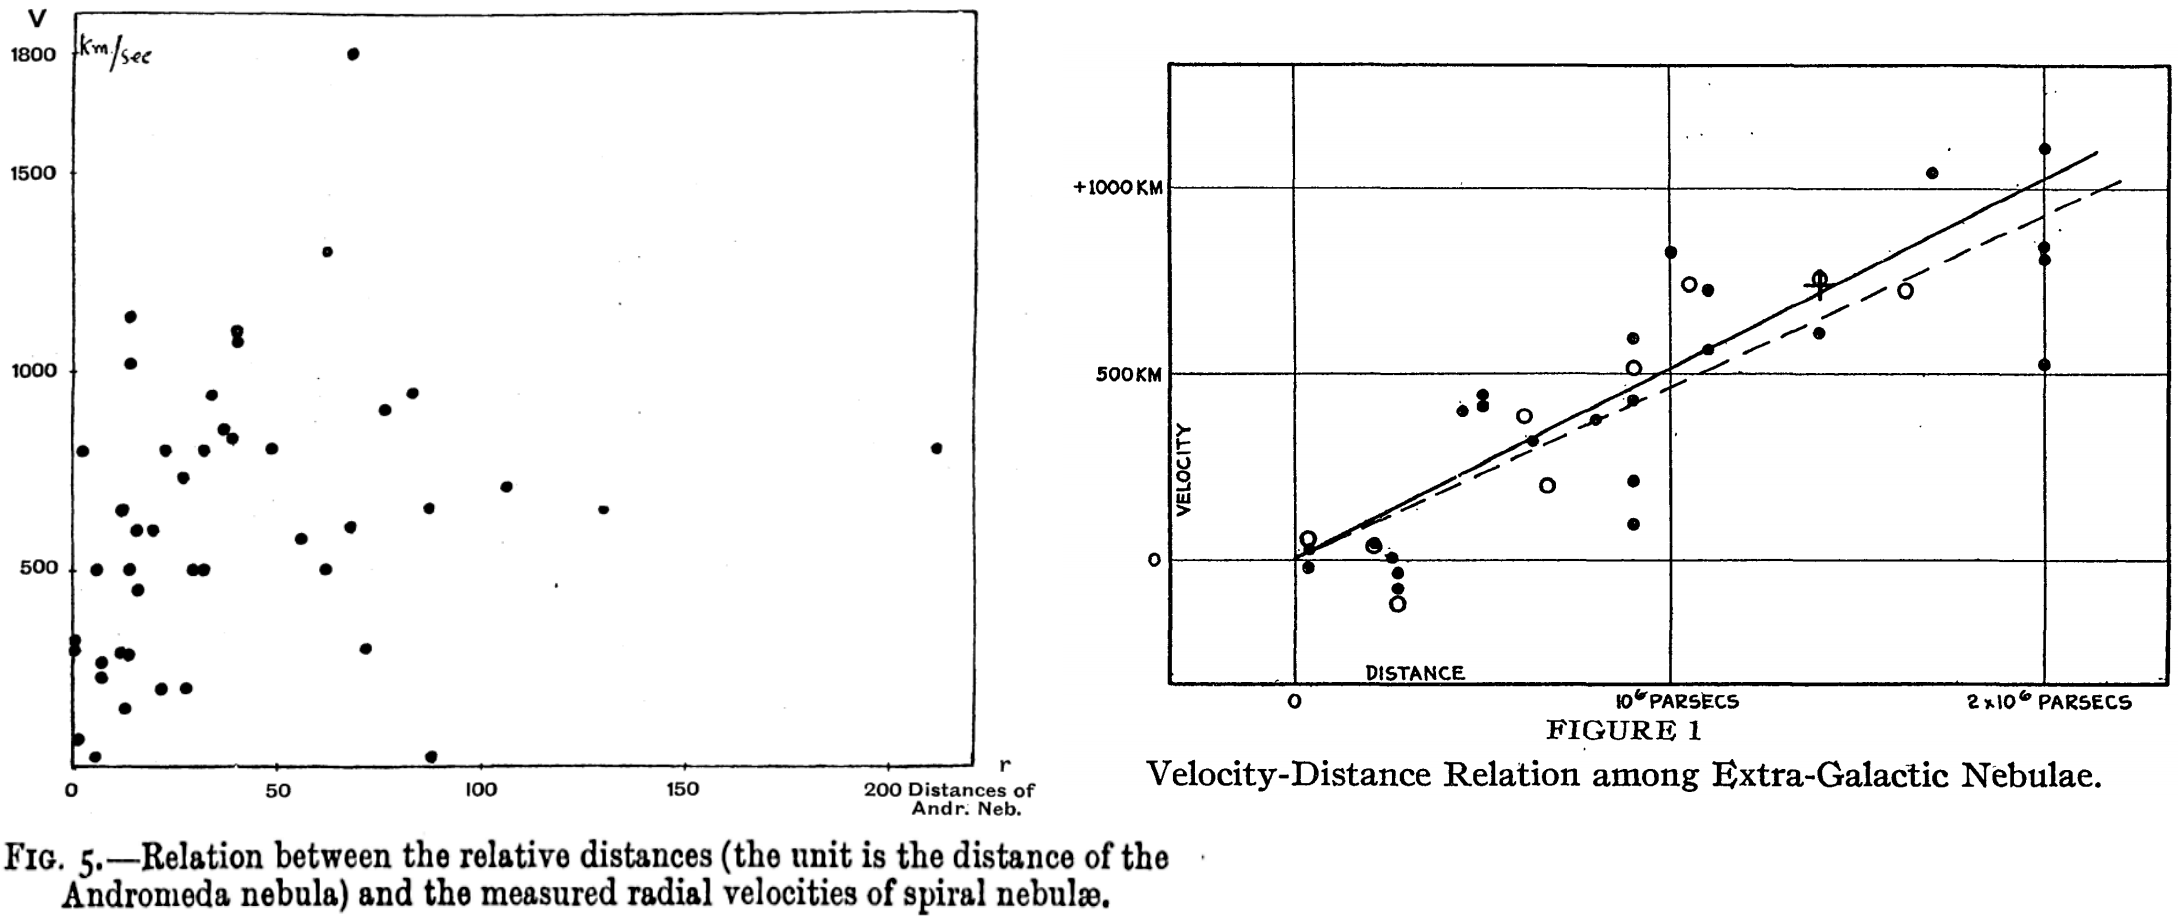
Hubble published his findings on the velocity-distance relation in 1929, under the unambiguous title, “A Relation Between Distance and Radial Velocity Among Extra-Galactic Nebulae”. Hubble 1929 states at the outset that other investigations have sought, “a correlation between apparent radial velocities and distances, but so far the results have not been convincing.” The key word being convincing, clearly a subjective term, but which Hubble believes is the principal impetus behind his new effort. In Lundmark 1924, where a velocity versus distance diagram is plotted for galaxies (see below), that author remarks that, “Plotting the radial velocities against these relative distances, we find that there may be a relation between the two quantities, although not a very definite one.” However, Hubble 1929 also makes reference to a study by Lundmark 1925, where Lundmark underscores that, “A rather definite correlation is shown between apparent dimensions and radial velocity, in the sense that the smaller and presumably more distant spirals have the higher space velocity.”
Hubble 1929 provides a velocity-distance diagram (featured below) and also notes that, “the data indicate a linear correlation between distances and velocities”. However, Hubble 1929 explicitly cautioned that, “New data to be expected in the near future may modify the significance of the present investigation, or, if confirmatory, will lead to a solution having many times the weight. For this reason it is thought premature to discuss in detail the obvious consequences of the present results … the linear relation found in the present discussion is a first approximation representing a restricted range in distance.” Hubble implied that additional effort was required to acquire observational data and place the relation on firm (convincing) footing, which would appear in Hubble and Humason 1931. Perhaps that may partly explain, in concert with the natural tendency of most humans to desire recognition and fame, why Hubble subsequently tried to retain credit for the establishment of the velocity-distance relation.
Hubble 1929 conveyed that he was aware of prior (but unconvincing to him) investigations on the topic of the velocity-distance relation. That is further confirmed by van den Bergh 2011, who cites the following pertinent quote recounted by Hubble’s assistant (Humason) for an oral history project, “The velocity-distance relationship started after one of the IAU meetings, I think it was in Holland [1928]. And Dr. Hubble came home rather excited about the fact that two or three scientists over there, astronomers, had suggested that the fainter the nebulae were, the more distant they were and the larger the red shifts would be. And he talked to me and asked if I would try and check that out.”
The velocities of galaxies plotted as a function of their distance, from Lundmark 1924 (left) and Hubble 1929 (right). Note the separate scales on the x-axis. Peacock 2013 demonstrates that distances cited by both authors were ultimately flawed, and problems (albeit less acute) likewise exist with modern distances (image credit: Lundmark/MNRAS/Hubble/PNAS, assembled by D. Majaess).
Hubble 1929 elaborated that, “The outstanding feature, however, is the possibility that the velocity-distance relation may represent the de Sitter effect, and hence that numerical data may be introduced into discussions of the general curvature of space.” de Sitter had proposed a model for the Universe whereby light is redshifted as it travels further from the emitting source. Hubble suspected that perhaps his findings may represent the de Sitter effect, however, Way 2013 notes that, “Thus far historians have unearthed no evidence that Hubble was searching for the clues to an expanding universe when he published his 1929 paper (Hubble 1929b).” Indeed, nearly two decades after the 1929 publication, Hubble 1947 remarks that better data may indicate that, “redshifts may not be due to an expanding universe, and much of the current speculation on the structure of the universe may require re-examination.” It is thus somewhat of a paradox that, in tandem with the other reasons outlined, Hubble is credited with discovering that the Universe is expanding.
The term redshift stems from the fact that when astronomers (e.g., V. Slipher) examined the spectra of certain galaxies, they noticed that although a particular spectral line should have appeared in the blue region of the spectrum (as measured in a laboratory): the line was actually shifted redward. Hubble 1947 explained that, “light-waves from distant nebulae [galaxies] seem to grow longer in proportion to the distance they have travelled It is as though the stations on your radio dial were all shifted toward the longer wavelengths in proportion to the distances of the stations. In the nebular [galaxy] spectra the stations (or lines) are shifted toward the red, and these redshifts vary directly with distance–an approximately linear relation. This interpretation lends itself directly to theories of an expanding universe. The interpretation is not universally accepted, but even the most cautious of us admit that redshifts are evidence either of an expanding universe or of some hitherto unknown principle of nature.”
Top, spectra for galaxies that are redshifted (image credit: JPL/Caltech/Planck).
As noted above, Hubble was not the first to deduce a velocity-distance relation for galaxies, and Way 2013 notes that, “Lundmark (1924b): first distance vs. velocity plot for spiral nebulae [galaxies] …Georges Lemaitre (1927): derived a non–static solution to Einstein’s equations and coupled it to observations to reveal a linear distance vs. redshift relation with a slope of 670 or 575 km/s/Mpc (depending on how the data is grouped) …” Although Hubble was aware of Lundmark’s research, he and numerous other astronomers were likely unaware of the now famous 1927 Lemaitre study, which was published in an obscure journal (see Livio 2012 (Nature), and discussion therein). Steer 2013 notes that, “Lundmark’s [1924] distance estimates were consistent with a Hubble constant of 75 km/s/Mpc [which is close to recent estimates].” (see also the interpretation of Peacock 2013). Certain distances established by Lundmark appear close to present determinations (e.g., M31, see the table above).
So why was Hubble credited with discovering the expanding Universe? Way 2013 suggests that, “Hubble’s success in gaining credit for his … linear distance-velocity relation may be related to his verification of the Island Universe hypothesis –after the latter, his prominence as a major player in astronomy was affirmed. As pointed out by Merton (1968) credit for simultaneous (or nearly so) discoveries is usually given to eminent scientists over lesser-known ones.” Steer told Universe Today that, “Lundmark in his own words did not find a definite relation between redshift and distance, and there is no linear relation overplotted in his redshift-distance graph. Where Lundmark used a single unproven distance indicator (galaxy diameters), cross-checked by a single unproven distance to the Andromeda galaxy, Hubble used multiple indicators including one still in use (brightest stars), cross-checked with distances to multiple galaxies based on Cepheids variables stars.”
Concerning assigning credit for the discovery of the expansion of the Universe, Way 2013 concludes that, “Overall we find that Lemaitre was the first to seek and find a linear relation between distance and velocity in the context of an expanding universe, but that a number of other actors (e.g. Carl Wirtz, Ludwik Silberstein, Knut Lundmark, Edwin Hubble, Willem de Sitter) were looking for a relation that fit into the context of de Sitter’s [Universe] Model B world with its spurious radial velocities [the redshift].” A partial list of the various contributors highlighted by van den Bergh 2011 is provided below.
“The history of the discovery of the expansion of the Universe may be summarized [above],” van den Bergh 2011 (image credit: van den Bergh/JRASC/arXiv).Way and Nussbaumer 2011 assert that, “It is still widely held that in 1929 Edwin Hubble discovered the expanding Universe … that is incorrect. There is little excuse for this, since there exists sufficient well-supported evidence about the circumstances of the discovery.”
In sum, the author’s personal opinion is that Hubble’s contributions to astronomy were seminal. Hubble helped convince astronomers of the extragalactic distance scale and that a relationship existed between the distance to a galaxy and its velocity, thus propelling the field and science forward. His extragalactic distances, albeit flawed, were also used to draw important conclusions (e.g., by Lemaitre 1927). However, it is likewise clear that other individuals are meritorious and deserve significant praise. The contributions of those scientists should be highlighted in parallel to Hubble’s research, and astronomy textbooks should be revised to emphasize those achievements A fuller account should be cited of the admirable achievements made by numerous astronomers working in synergy during the 1920s.
There are a diverse set of opinions on the topics discussed, and the reader should remain skeptical (of the present article and other interpretations), particularly since knowledge of the topic is evolving and more is yet to emerge. Two talks from the “Origins of the Expanding Universe: 1912-1932” conference are posted below (by H. Nussbaumer and M. Way), in addition to a talk by I. Steer from a separate event.
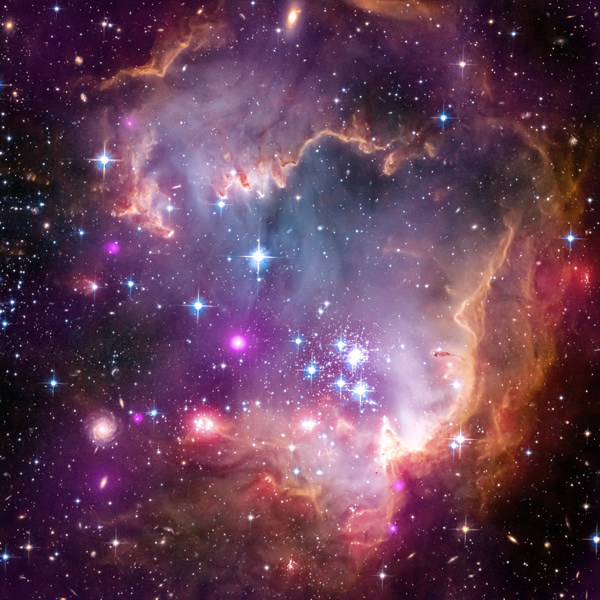
A part of the Small Magellanic Cloud galaxy is dazzling in this new view from NASA's Great Observatories. The Small Magellanic Cloud, or SMC, is a small galaxy about 200,000 light-years way that orbits our own Milky Way spiral galaxy. Credit: NASA.
This is just pretty! NASA’s Great Observatories — the Hubble Space Telescope, the Chandra X-Ray Observatory and the Spitzer Infrared Telescope — have combined forces to create this new image of the Small Magellanic Cloud. The SMC is one of the Milky Way’s closest galactic neighbors. Even though it is a small, or so-called dwarf galaxy, the SMC is so bright that it is visible to the unaided eye from the Southern Hemisphere and near the equator.
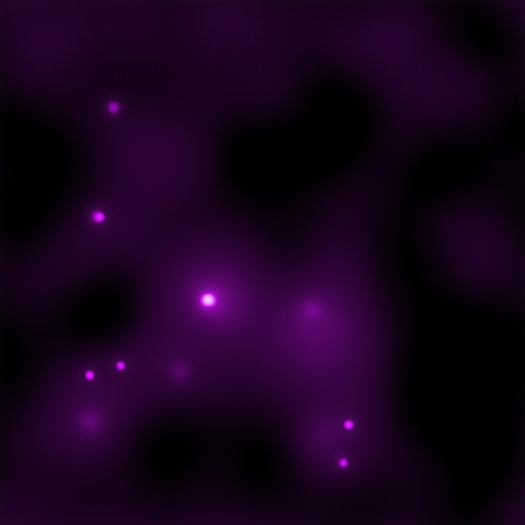
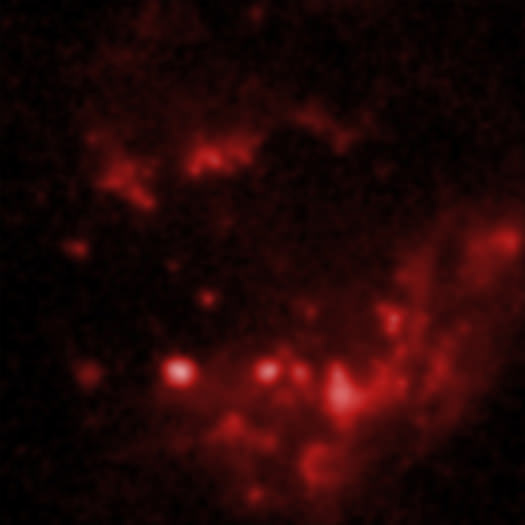
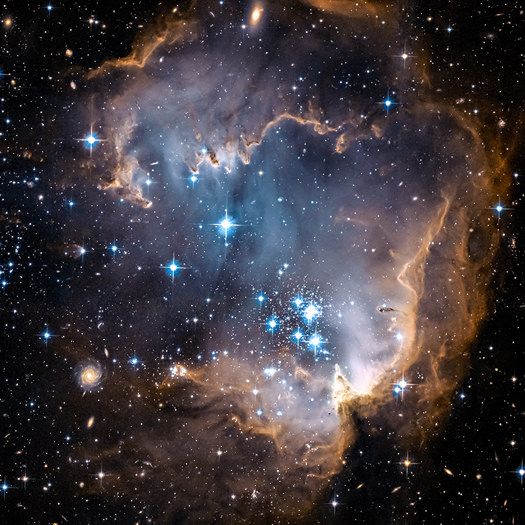
What did it take to create this image? Let’s take a look at the images from each of the observatories:
The Small Magellenic Cloud in X-Ray from the Chandra X-Ray Observatory. Credit: NASA.The Small Magellenic Cloud in infrared, from the Spitzer Infrared Telescope. Credit: NASA.The Small Magellenic Cloud as seen in optical wavelengths from the Hubble Space Telescope. Credit: NASA.
The various colors represent wavelengths of light across a broad spectrum. X-rays from NASA’s Chandra X-ray Observatory are shown in purple; visible-light from NASA’s Hubble Space Telescope is colored red, green and blue; and infrared observations from NASA’s Spitzer Space Telescope are also represented in red.
The three telescopes highlight different aspects of this lively stellar community. Winds and radiation from massive stars located in the central, disco-ball-like cluster of stars, called NGC 602a, have swept away surrounding material, clearing an opening in the star-forming cloud.
Find out more at this page from Chandra, and this one from JPL.
This artist's conception illustrates what a "hot jupiter" might look like.
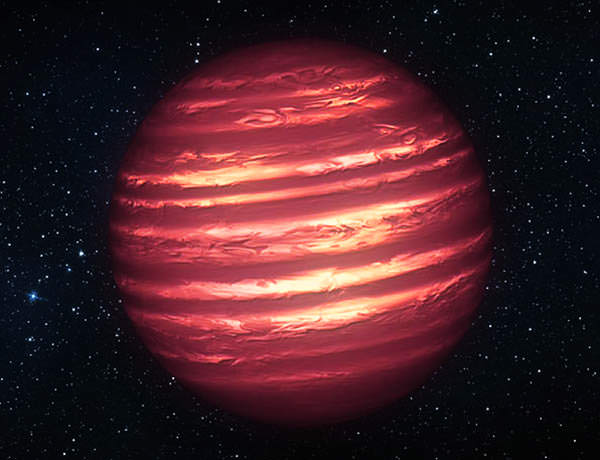
Artist’s concept of brown dwarf 2MASSJ22282889-431026 (NASA/JPL-Caltech)
The complex weather patterns within the atmosphere of a rapidly-rotating brown dwarf have been mapped in the highest detail ever by researchers using the infrared abilities of NASA’s Spitzer and Hubble space telescopes… talk about solar wind!
Sometimes referred to as failed stars, brown dwarfs form from condensing gas and dust like regular stars but never manage to gather enough mass to ignite full-on hydrogen fusion in their cores. As a result they more resemble enormous Jupiter-like planets, radiating low levels of heat while possessing bands of wind-driven eddies in their upper atmospheric layers.
Although brown dwarfs are by their nature very dim, and thus difficult to observe in visible wavelengths of light, their heat can be detected by Hubble and the Spitzer Space Telescope — both of which can “see” just fine in near- and far-infrared, respectively.
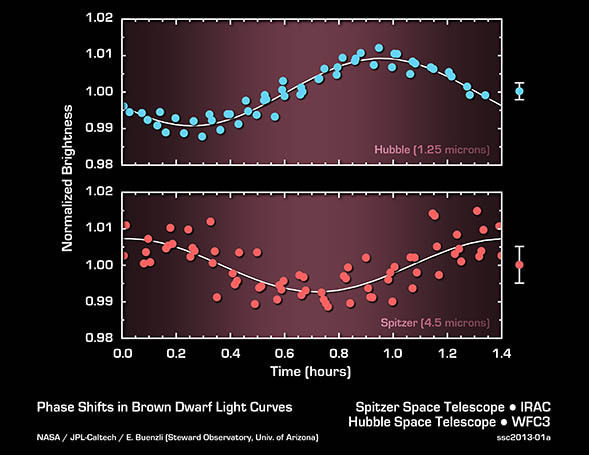
Led by researchers from the University of Arizona, a team of astronomers used these orbiting observatories on July 7, 2011 to measure the light curves from a brown dwarf named 2MASSJ22282889-431026 (2M2228 for short.) What they found was that while 2M2228 exhibited periodic brightening in both near- and far-infrared over the course of its speedy 1.43-hour rotation, the amount and rate of brightening varied between the different wavelengths detected by the two telescopes.
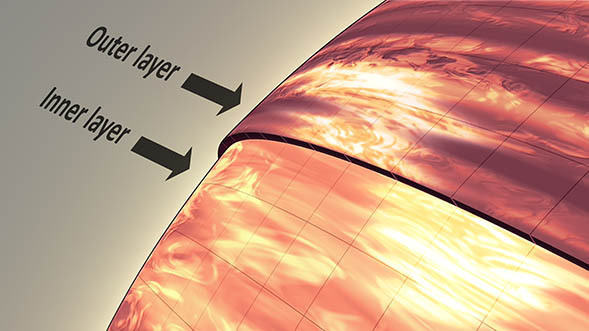
“With Hubble and Spitzer, we were able to look at different atmospheric layers of a brown dwarf, similar to the way doctors use medical imaging techniques to study the different tissues in your body.”
– Daniel Apai, principal investigator, University of Arizona
This unexpected variance — or phase shift — most likely indicates different layers of cloud material and wind velocities surrounding 2M2228, swirling around the dwarf star in very much the same way as the stormy cloud bands seen on Jupiter or Saturn.
But while the clouds on Jupiter are made of gases like ammonia and methane, the clouds of 2M2228 are made of much more unusual stuff.
“Unlike the water clouds of Earth or the ammonia clouds of Jupiter, clouds on brown dwarfs are composed of hot grains of sand, liquid drops of iron, and other exotic compounds,” said Mark Marley, a research scientist at NASA’s Ames Research Center and co-author of the paper. “So this large atmospheric disturbance found by Spitzer and Hubble gives a new meaning to the concept of extreme weather.”
While it might seem strange to think about weather on a star, remember that brown dwarfs are much more gas planet-like than “real” stars. Although the temperatures of 1,100–1,600 ºF (600–700 ºC) found on 2M2228 might sound searingly hot, it’s downright chilly compared to even regular stars like our Sun, which has an average temperature of nearly 10,000 ºF (5,600 ºC). Different materials gather at varying layers of its atmosphere, depending on temperature and pressure, and can be penetrated by different wavelengths of infrared light — just like gas giant planets.
“What we see here is evidence for massive, organized cloud systems, perhaps akin to giant versions of the Great Red Spot on Jupiter,” said Adam Showman, a theorist at the University of Arizona involved in the research. “These out-of-sync light variations provide a fingerprint of how the brown dwarf’s weather systems stack up vertically. The data suggest regions on the brown dwarf where the weather is cloudy and rich in silicate vapor deep in the atmosphere coincide with balmier, drier conditions at higher altitudes — and vice versa.”
The team’s results were presented today, January 8, during the 221st meeting of the American Astronomical Society in Long Beach, CA.
Read more on the Spitzer site, and find the team’s paper in PDF form here.
Inset image: the anatomy of a brown dwarf’s atmosphere (NASA/JPL).
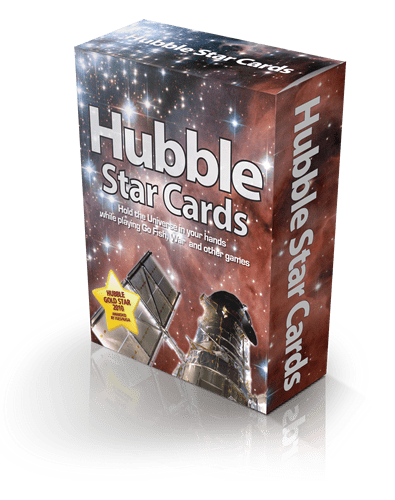
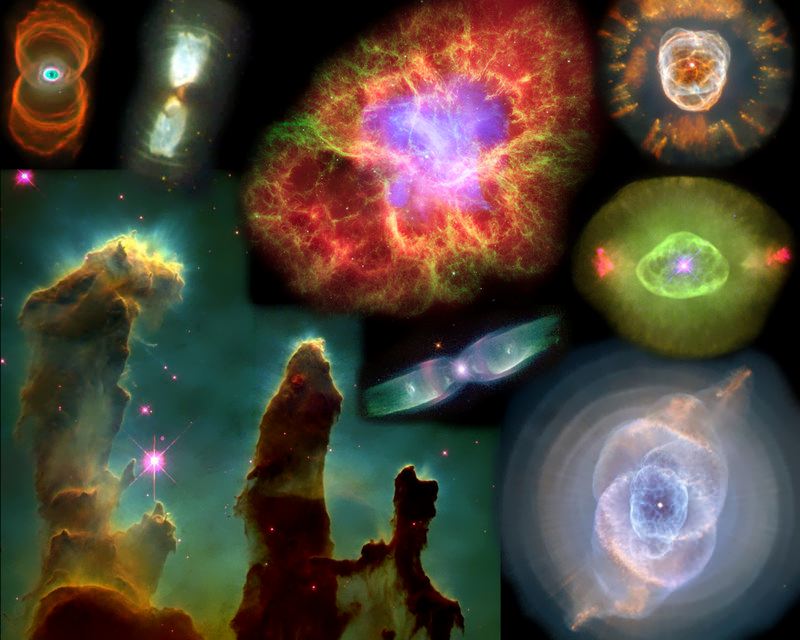
A couple of years ago Universe Today writer John Williams created a card game called Hubble Star Cards, and the game won a Hubble Gold Star award in 2010 from NASA and the Institute for Global Environmental Strategies for its inspiring use of the amazing imagery from the Hubble Space Telescope. As the description says, “the vivid, stunning images motivate and engage children of all ages to learn about objects in space. Now, thanks to John, Universe Today is giving away two decks of these beautiful cards!
In order to be entered into the drawing, just put your email address into the box below before Tuesday, December 25nd, 2012. We’ll send you a confirmation email, so you’ll need to click that to be successfully entered.
Hubble Star Cards are a high-quality, stunningly beautiful printed card set that are just a bit larger than a normal card deck, at 3 inches by 5×5 inches, so the beautiful Hubble images are bigger and better.
“Hubble has a unique ability to draw the public into exploring space,” says John. “Through beautiful images of planets, star clusters, pillars of dust, and galaxies, Hubble provides a crucial stepping stone in the process of scientific inquiry. Hubble Star Cards create a hand-held experience that opens the door to new questions and answers. You can actually hold the Universe, all of creation, in the palm of your hand and have fun learning about it at the same time.”
The game includes 60 cards categorized by planets, planetary nebulae, supernovae remnants, nebulae, star clusters and galaxies. The cards include an image, a basic description, a key to the type of object, location in the sky, constellation, and distance from Earth. Possible games include War, Go Fish, Sorting, Distances and Matching. Although targeted for students 8 and older, preschoolers have played many of the games just by using the amazing imagery as a guide.
If you are not a winner, these cards sell for $24.95, but Universe Today readers can get 15% off using UNIVERSE as a coupon code. Check them out at the Hubblestarcards.com website.
We’re only going to use these email addresses for Universe Today giveaways/contests and announcements. We won’t be using them for any other purpose, and we definitely won’t be selling the addresses to anyone else. Once you’re on the giveaway notification list, you’ll be able to unsubscribe any time you like.
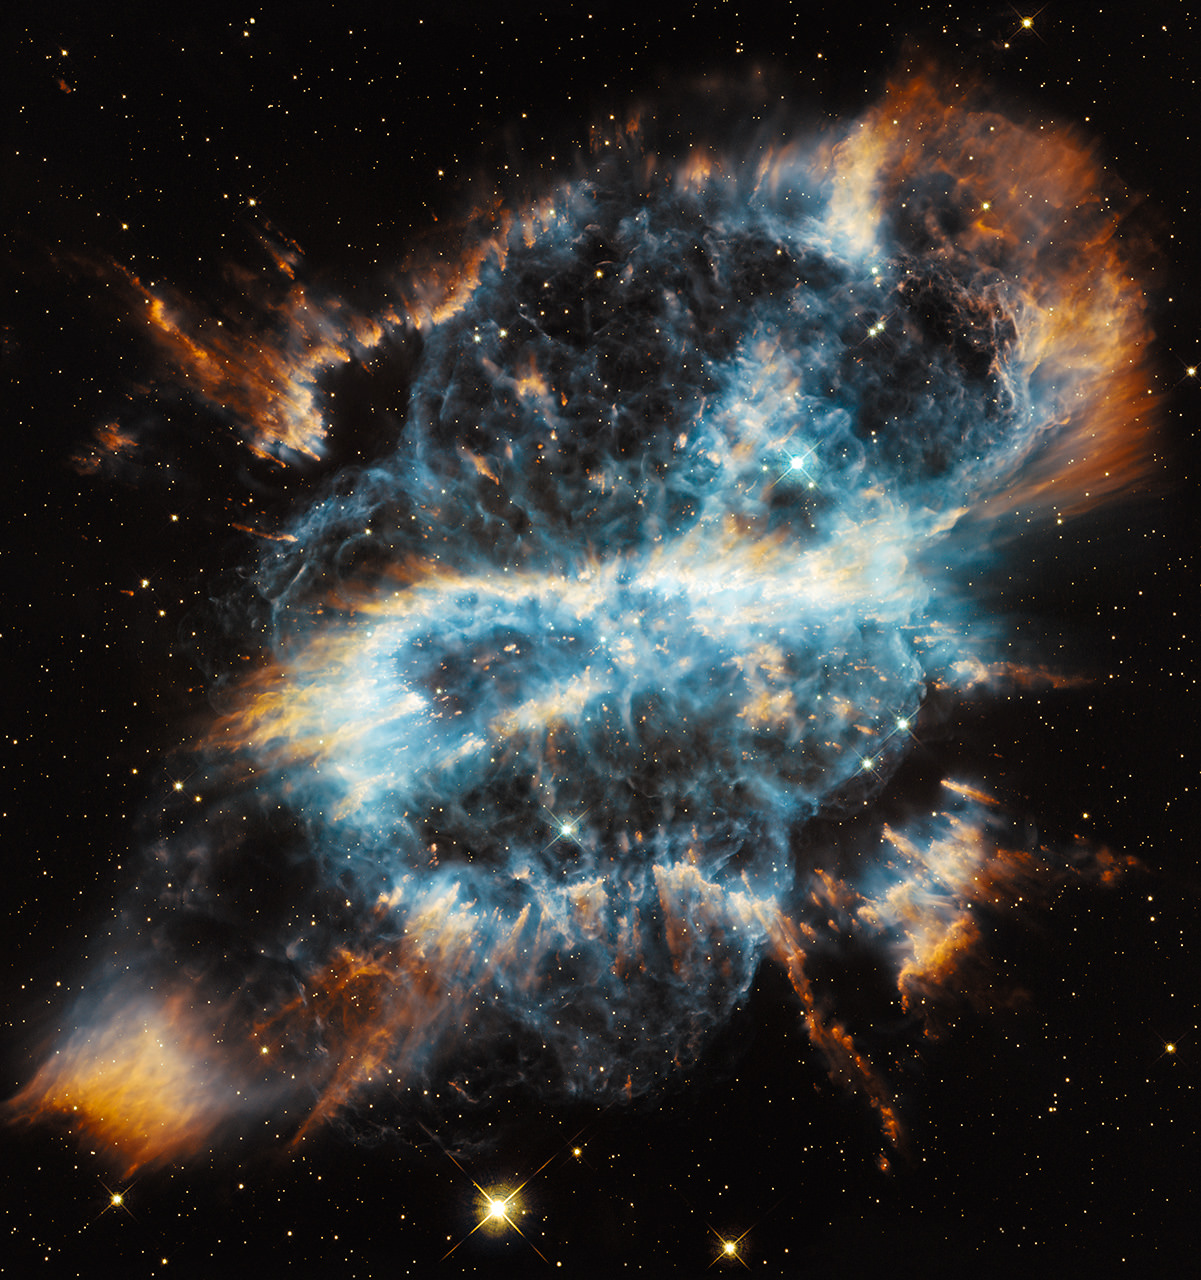
Planetary nebula NGC 5189 as seen by Hubble’s Wide Field Camera 3. Credit: NASA, ESA, and the Hubble Heritage Team (STScI/AURA)
It may be just a tad too big to hang on your tree but this bright, twisted planetary nebulawould make a beautiful holiday ornament… if scaled a bit down to size, of course.
(Click the image to see it in its full festive glory!)
NGC 5189 is a planetary nebula that lies 1,800 light-years away in the southern constellation Musca. The gorgeous image above, acquired by Hubble’s Wide Field Camera 3 on October 8, 2012, shows the glowing streamers of oxygen, sulfur and hydrogen that are being blown far into space from the hot star star at its heart — HD 117622 (at right.)
The expelled gas forms a double structure, with a series of central blue lobes surrounded by a twisted helix of bright streamers, called radial filaments. These filaments are the result of fast-moving material from the star impacting previously expelled, slower-moving gas, which becomes visible due to ionizing radiation.
The twisted shapes — as opposed to the circular or spherical structures found in many planetary nebulae — may be the result of an unseen binary partner to HD 117622, which over time would affect its rotational orientation.
“The likely mechanism for the formation of this planetary nebula is the existence of a binary companion to the dying star,” said scientist Kevin Volk in a Gemini Observatory article from 2006. “Over time the orbits drift due to precession and this could result in the complex curves on the opposite sides of the star.”


!["The history of the discovery of the expansion of the Universe may be summarized [above]", S. van den Bergh 2011. Image credit: S. van den Bergh/JRASC/arXiv.](https://www.universetoday.com/wp-content/uploads/2013/04/history.jpg)