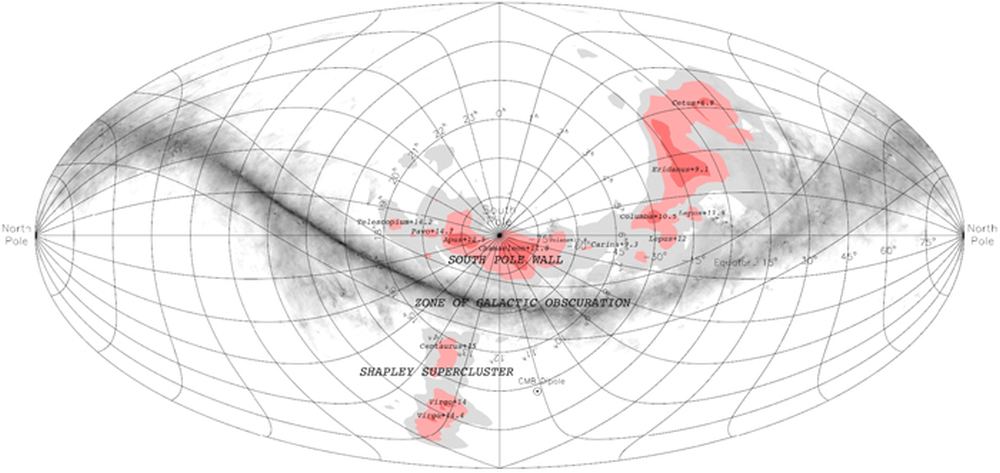
A projection of the South Pole Wall in celestial coordinates. Image Credit: Pomarède et al, 2020.
Galaxies aren’t spread evenly throughout space. They exist in groups, clusters, and superclusters. Our own Milky Way galaxy exists in an impossibly vast structure called the Laniakea supercluster. Laniakea was defined in 2014, and it contains over 100,000 galaxies.
Now a team of astronomers have discovered another immense feature beyond Laniakea, called the South Pole Wall.
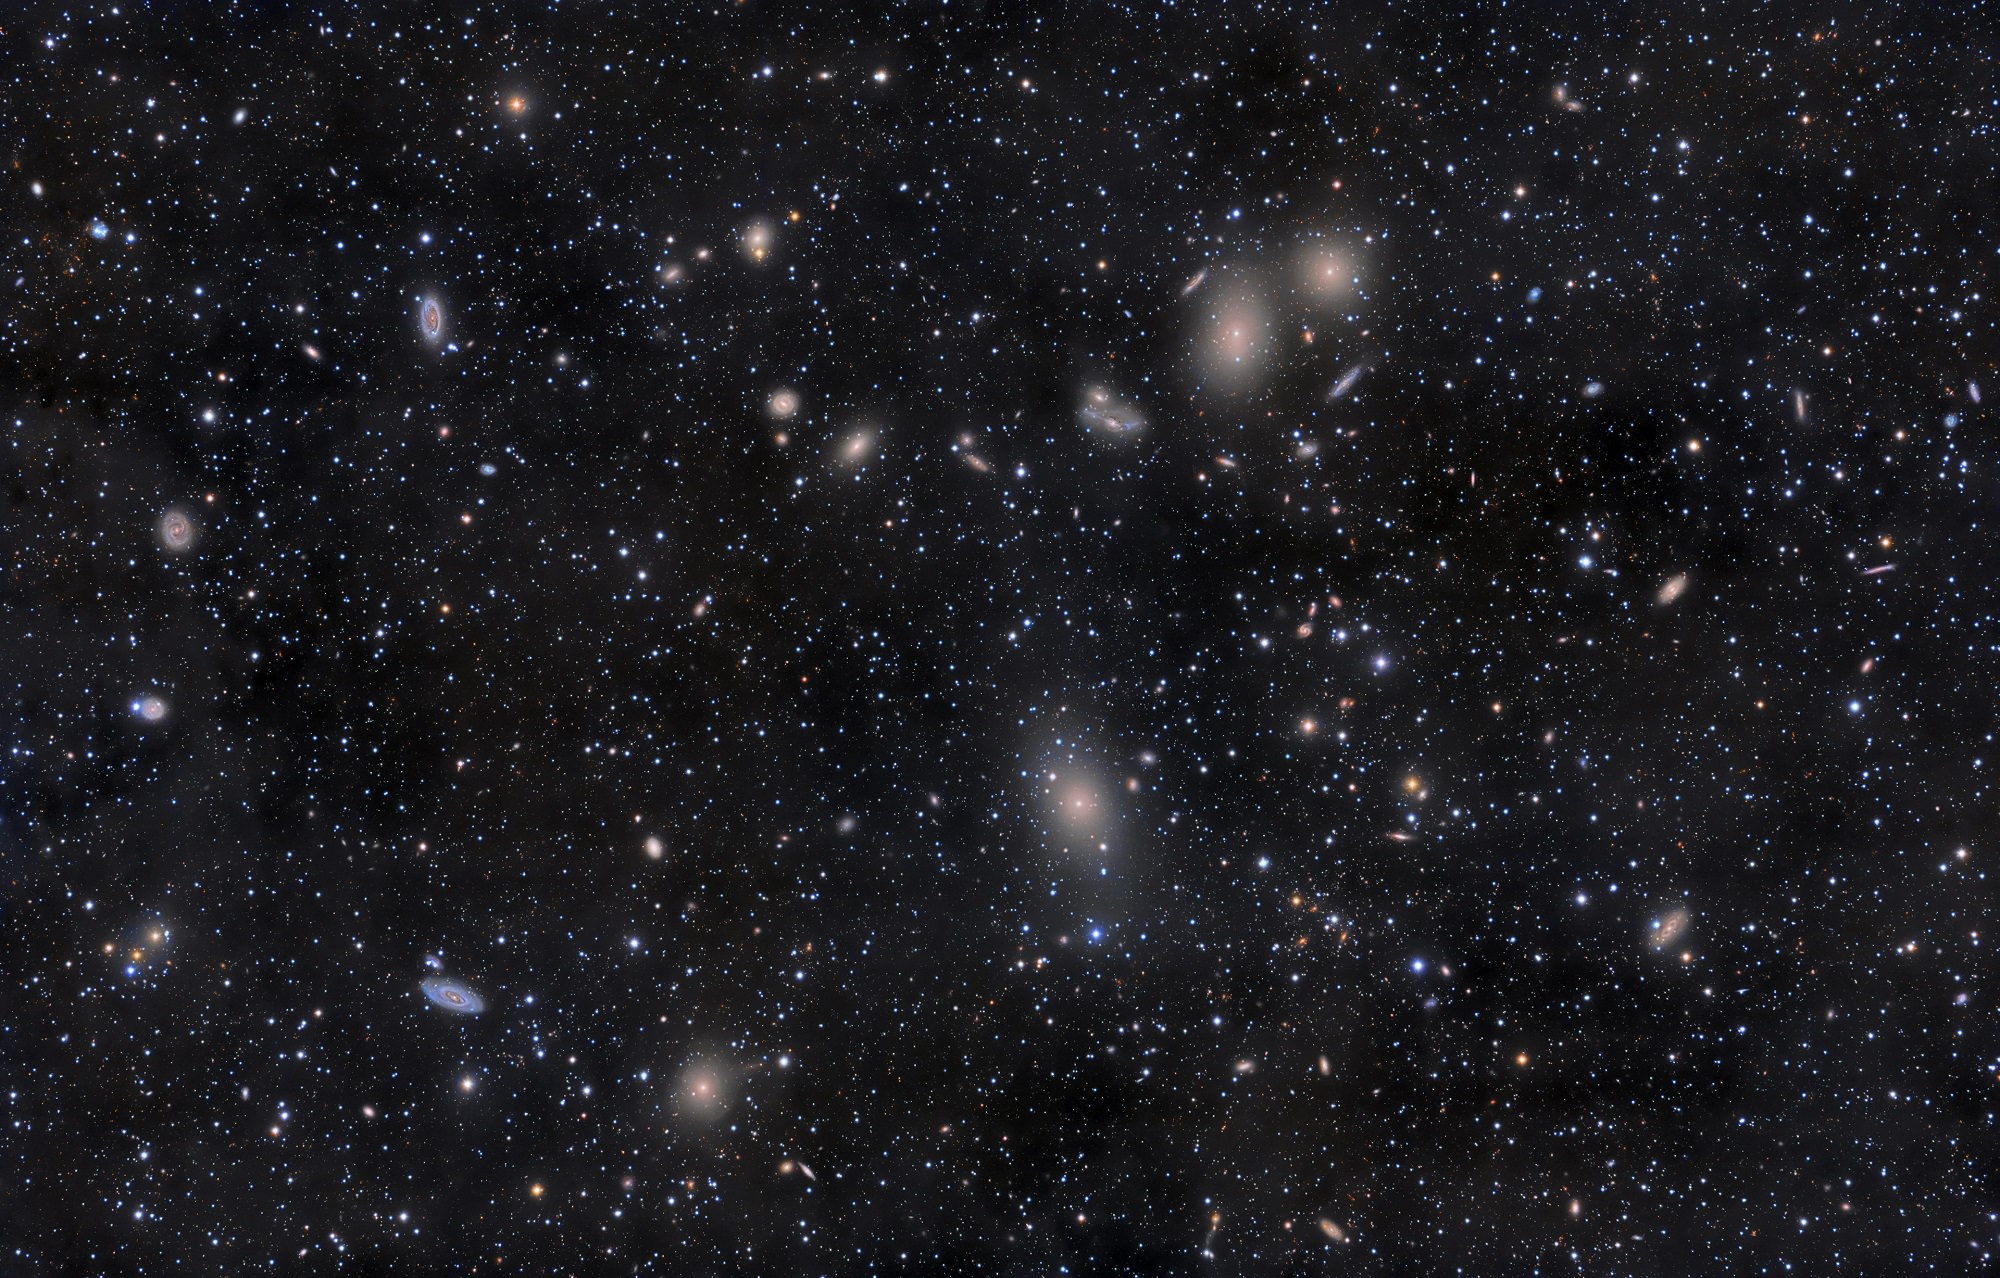
A mosaic of telescopic images showing the galaxies of the Virgo Supercluster. It's part of the cosmic web in which a galaxy can exist during part of its evolution. Credit: NASA/Rogelio Bernal Andreo
For almost a century, astronomers have understood that the Universe is in a state of expansion. This is a consequence of General Relativity, and the rate at which it is expanding is known as the Hubble Constant – named after the man who first noticed the phenomena. However, astronomers have also learned that withing the large-scale structures of the Universe, galaxies and clusters have also been moving closer and relative to one other.
For decades, astronomers have sought to track how these movements have taken place over the course of cosmic history. And thanks to the efforts of international team of astronomers, the most detailed map to date of the orbits of galaxies that lie within the Virgo Supercluster has been created. This map encompasses the past motions of almost 1,400 galaxies within 100 million light years of space, showing how our cosmic neighborhood has changed.
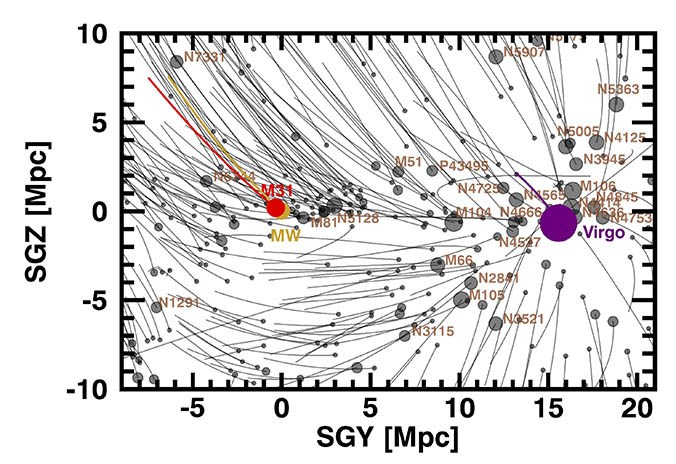
Orbits of galaxies in the Local Supercluster. Credit: Brent Tully.
For the sake of their study, the team used data from the CosmicFlows surveys, a series of three studies that calculated the distance and speed of neighboring galaxies between 2011 and 2016. Several members of the study team were involved in these surveys, which they then paired with other distance and gravity field estimates to construct a massive flow study of the Virgo Supercluster.
From this, they were able to create computer models that charted the motions of almost 1,400 galaxies within 100 million light years, and over the course of 13 billion years (just 800 million years after the Big Bang). As Brent Tully, an astronomer with the UH Institute of Astronomy and a co-author on the study, explained in a UH press release:
“For the first time, we are not only visualizing the detailed structure of our Local Supercluster of galaxies but we are seeing how the structure developed over the history of the universe. An analogy is the study of the current geography of the Earth from the movement of plate tectonics.”
What they found was that their models fit the present day velocity flow well, meaning that the structures and speeds they observed in their models fit with what has been observed from galaxies in the present day. They also determined that within the area of space they mapped, the main gravitational attractor is the Virgo Cluster – which is located about 50 million light years away and contains between 1300 and 2000 galaxies.
Moreover, their study indicated that more than a thousand galaxies have fallen into the Virgo Cluster in the past 13 billion years, while all galaxies within 40 million light-years of the cluster will eventually be captured. At present, the Milky Way lies just outside this capture zone, but both the Milky Way and the Andromeda Galaxy are destined to merge in the next 4 billion years.
Once they do, the fate of the resulting massive galaxy will be similar to the rest of the galaxies in the area of study. This was another takeaway from the study, where the team determined that these merger events are merely part of a larger pattern. Basically, within the region of space they observed, there are two overarching flow patterns. Within one hemisphere of this region, all galaxies – including the Milky Way – are streaming towards a single flat sheet.
At the same time, every galaxy over the entire volume of space is moving towards gravitational attractors that are located far beyond the area of study. They determined that these outside forces are none other than the Centaurus Supercluster – a cluster of hundreds of galaxies, located approximately 170 million light years away in the Centaurus constellation – and the Great Attractor.
The Great Attractor is located 150 million light years away, and is a mysterious region that cannot be seen because of its location (on the opposite side of the Milky Way). However, for decades, scientists have known that our galaxy and other nearby galaxies are moving towards it. The region is also the core of the Laniakea Supercluster, a region that spans more than 500 million light-years and contains about 100,000 large galaxies.
In short, while the Universe is in a state of expansion, the dynamics of galaxies and galaxy clusters indicate that they still gravitate into tighter structures. Within our cosmic neighborhood, the main attractor is clearly the Virgo Cluster, which is affecting all galaxies within a 40 million light-year radius. Beyond this, it is the Centaurus Supercluster and the Great Attractor (as part of the larger Laniakea Supercluster) that is tugging at our strings.
By charting this process of attraction that has been taking place over the past 13 billion years, astronomers and cosmologists are able to see just how our Universe has evolved over the course of the majority of its history. With time, and improved instruments that are capable of looking even deeper into the cosmos (such as the James Webb Space Telescope) we are expected to be able to probe even further back towards the beginning of the cosmos.
Charting how our Universe has changed over time not only confirms our cosmological models and verifies predominant theories about how matter behaves on the largest of scales (i.e. General Relativity). It also allows scientists to predict the future of our Universe with a fair degree of certainty, modelling how galaxies and superclusters will eventually come together to form even larger structures.
The team also created a video showing the results of their study, as well as an interactive model that let’s users examine the frame of reference from multiple vantage points. Be sure to check out the video below, and head on over to the UH page to access their interactive model.
Our focus on female astronomers continues with Sandra Faber, and Professor of Astronomy at UC Santa Cruz. Faber was part of the team that turned up the Great Attractor, a mysterious mass hidden by the disk of the Milky Way. Continue reading “Astronomy Cast Ep. 358: Modern Women: Sandra Faber”
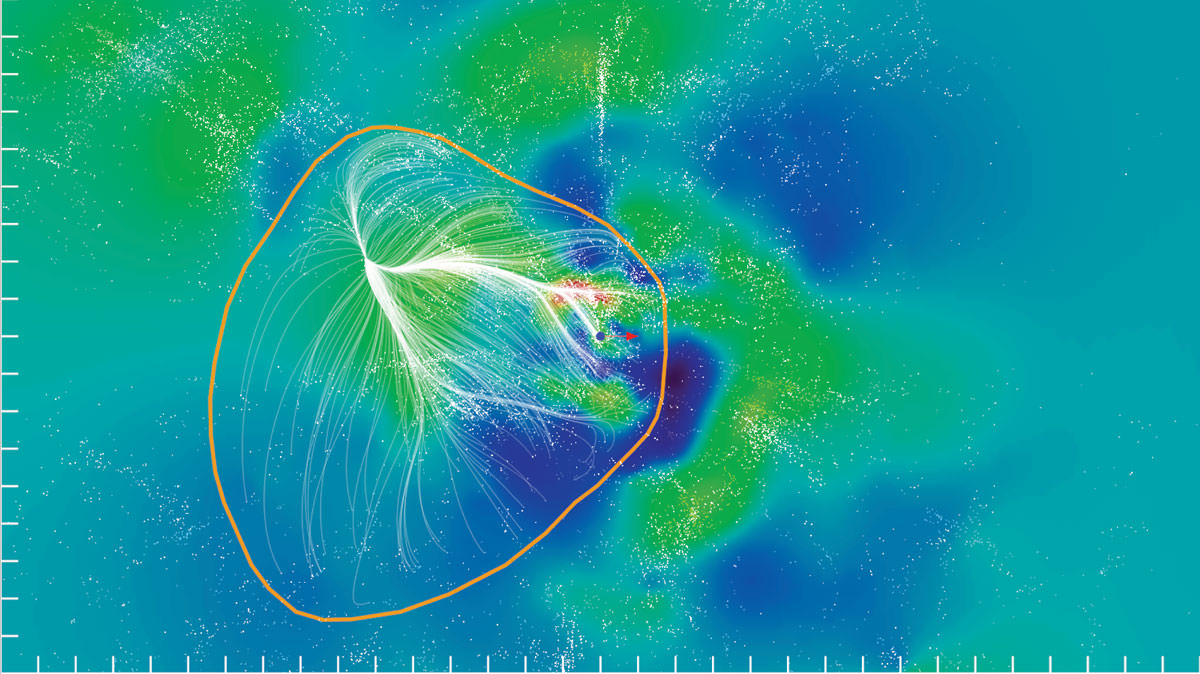
A slice of the Laniakea Supercluster -- a local basin of attraction. This structure contains many galaxies and clusters, including our own Milky Way Galaxy. Credit: SDvision interactive visualization software by DP at CEA/Saclay, France.
Our cosmic address extends well beyond Earth, past the Milky Way and toward the farthest reaches of the universe. But now astronomers are adding another line: the Laniakea Supercluster, which takes its name from the Hawaiin term “lani” meaning heaven and “akea” meaning spacious or immeasurable.
And the name is true to its meaning. The supercluster extends more than 500 million light-years and contains the mass of 100 quadrillion Suns in 100,000 large galaxies. This research is the first to trace our local supercluster on such a large scale.
“We have finally established the contours that define the supercluster of galaxies we can call home,” said lead researcher R. Brent Tully, from the University of Hawaii’s Institute for Astrophysics, in a news release. “This is not unlike finding out for the first time that your hometown is actually part of much larger country that borders other nations.”
Superclusters — aggregates of clusters of galaxies — rank among the largest structures in the universe. Although these structures are interconnected in a web of filaments, their exact outlines and boundaries are hard to define.
Large three-dimensional maps (think Sloan Digital Sky Survey) calculate a galaxy’s location based on its galactic redshift, the shifts in its spectrum due to its apparent motion as space itself expands. But Tully and colleagues used peculiar redshifts, the shifts in a galaxy’s spectrum due to the local gravitational landscape, instead.
In other words, the team is mapping the galaxies by examining their impact on the motions of other galaxies. A galaxy caught in the midst of multiple galaxies will find itself in a massive tug-of-war, where the balance of the surrounding gravitational forces will dictate its motion.
Typically this method is only viable for the local universe where the peculiar velocities are high enough compared with the expansion velocities, which increase with distance (a galaxy recedes faster the farther away it is). But Tully and colleagues used a new algorithm, which revealed the large-scale patterns created by galaxies’ motions.
Not only did this allow them to map our home supercluster, but to clarify the role of the Great Attractor, a dense region in the vicinity of Centaurus, Norma, and Hydra clusters that influences the motion of our Local Group and other groups of galaxies. They revealed that the Great Attractor is a large gravitational valley that draws all galaxies inward.
The team also discovered other structures, including a region named Shapley, toward which Laniakea is moving.
The findings have been published in the Sept. 4 issue of Nature.