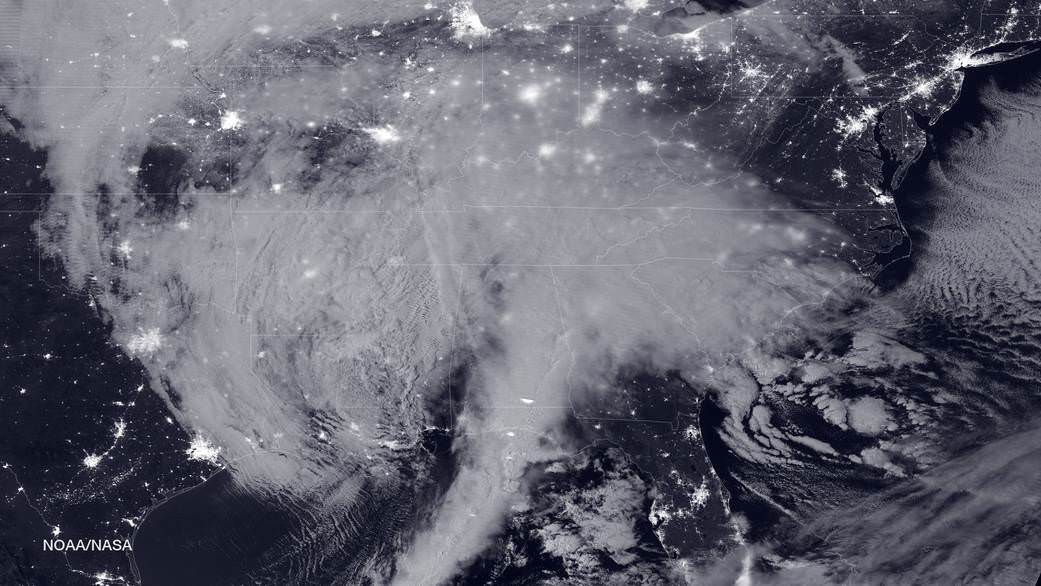
NASA-NOAA's Suomi NPP satellite snapped this image of the approaching blizzard around 2:35 a.m. EST on Jan. 22, 2016 using the Visible Infrared Imaging Radiometer Suite (VIIRS) instrument's Day-Night band. Credit: NOAA/NASA
NASA-NOAA’s Suomi NPP satellite snapped this image of the approaching blizzard around 2:35 a.m. EST on Jan. 22, 2016 using the Visible Infrared Imaging Radiometer Suite (VIIRS) instrument’s Day-Night band. Credit: NOAA/NASA
NEW JERSEY- The monstrous ‘Blizzard of 2016’ predicted by weather forecasters for days has struck a wide swath of the US East Coast from the Gulf coast to the Carolinas to New York and soon into New England, with full fury today, Friday, Jan. 22.
NASA and NOAA satellites are tracking the storm which is already inundating the biggest population centers, affecting some 85 million people in 20 states up and down the Atlantic Coast, as it moves in a northeasterly direction.
This afternoon, NASA and NOAA released a series of eyepopping satellite images showing the massive extent of the storm, which may drop historic amounts of snow on Washington DC and other cities over the next 24 to 48 hours.
The two agencies released a particularly striking image, shown above, showing the storm swarming over virtually the entire eastern half of the continental US as it was barreling towards the East coast cites.
It was taken Friday afternoon by the NASA-NOAA’s Suomi NPP satellite showing the approaching blizzard around 2:35 a.m. EST on Jan. 22, 2016 using the Visible Infrared Imaging Radiometer Suite (VIIRS) instrument’s Day-Night band.
States of Emergency have been declared by Governors of states from the mid-Atlantic to New England, including North Carolina, Virginia, Maryland, New York, Pennsylvania, New Jersey, Kentucky, Georgia, Tennessee, West Virginia, the District of Columbia and the list is growing.
The heaviest snowfall is expected in and around Washington DC with estimates of 24 inches of snow or more. 18 to 24 inches may fall along the metropolitan Northeast corridor on Baltimore, Philadelphia, Trenton and New York City.
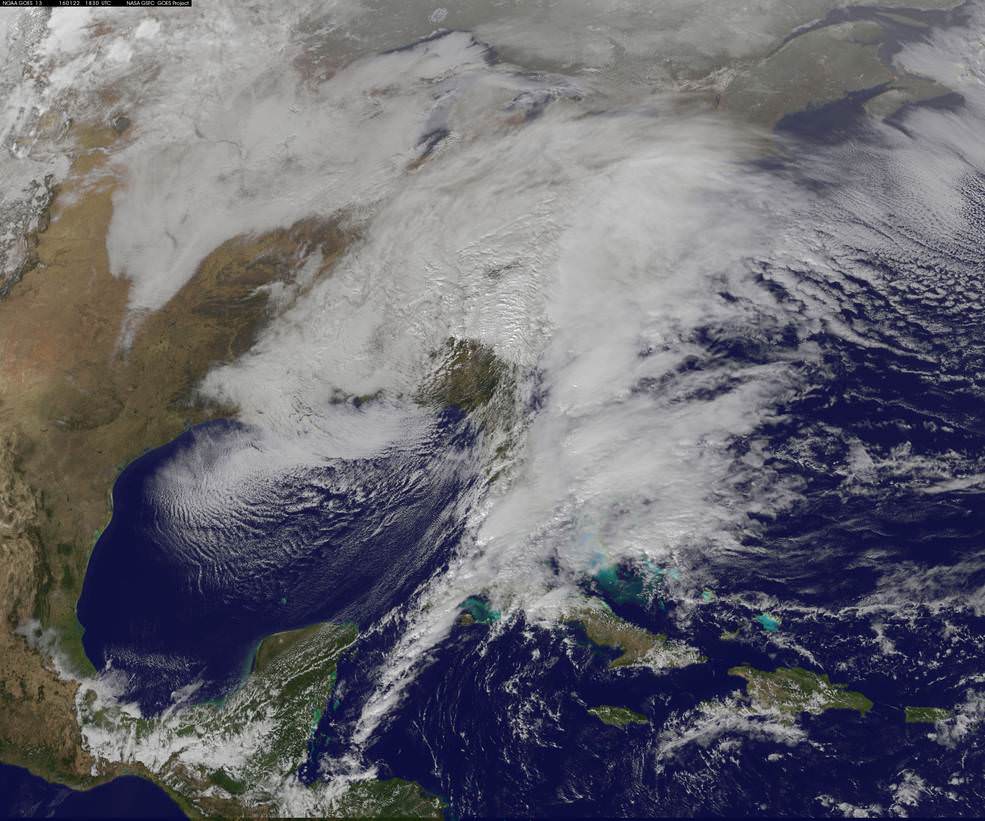
This visible image from NOAA’s GOES-East satellite at 1830 UTC (1:30 p.m. EST) on Jan. 22, 2016 shows the major winter storm now affecting the U.S. East coast. Credits: NASA/NOAA GOES Project
The heavy, blinding snow was already hitting Virginia and Washington by Friday afternoon. Governors, Mayors and Federal officials warned drivers to get off the roads by early Friday afternoon.
Stay off the roadways !!
Widespread treacherous driving with icy roads, sleet, rain, low visibility and whiteout conditions are causing numerous auto accidents as the blizzard bashes the region.
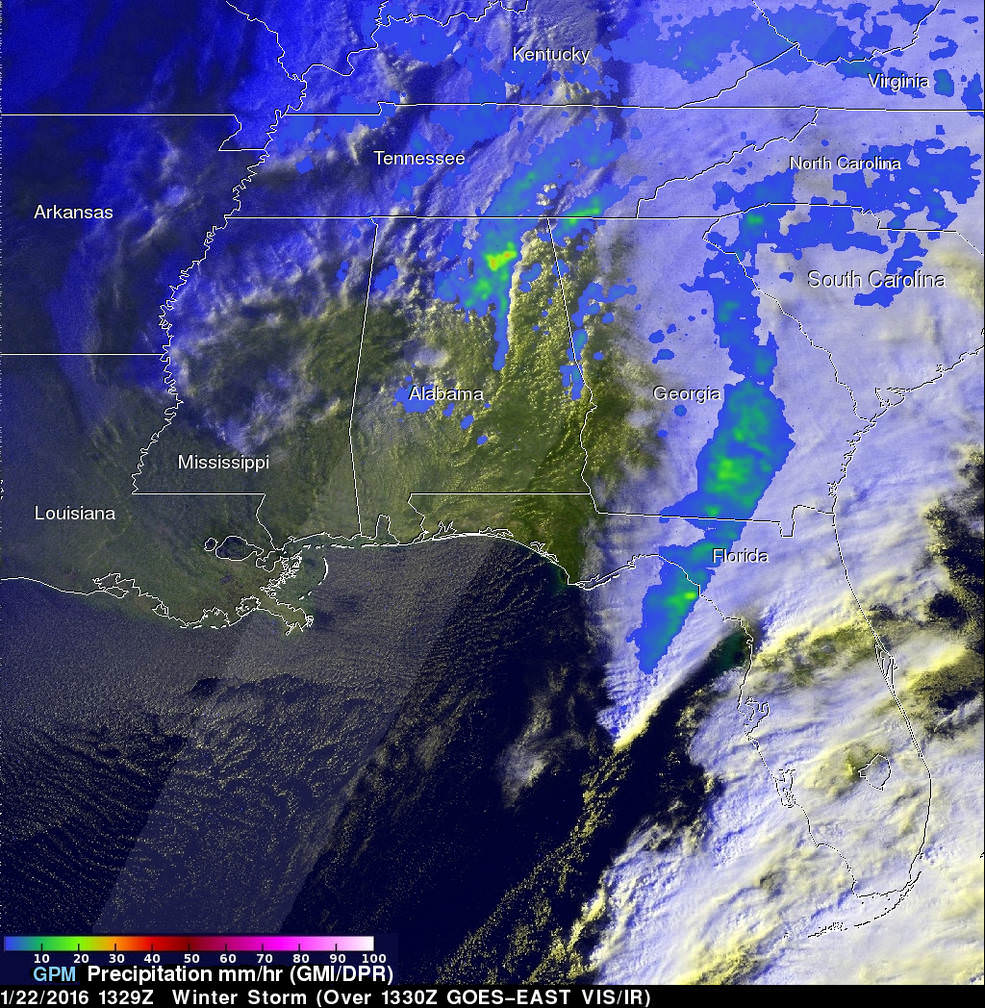
“The winter storm that caused damage during the night along the Gulf Coast has deepened and has started to spread heavy rain, freezing rain, sleet and snow northward into the Mid-Atlantic region. NASA’s GPM and NOAA’s GOES satellites are providing data on rainfall, cloud heights, extent and movement of the storm” wrote NASA’s Rob Gutro in an update on Friday.
On January 22 at 1329 UTC (8:29 a.m. EST) the GPM core satellite saw precipitation falling at a rate of over 64 mm (2.5 inches) per hour in storms over northern Alabama. Credits: SSAI/NASA/JAXA, Hal Pierce
The National Weather Service (NWS) Weather Prediction Center in College Park, Maryland said “An area of low pressure centered over the southeastern U.S. will continue developing into a major winter storm which will impact a large portion of the East Coast from the southern Appalachians through the Mid-Atlantic States from Friday into the weekend. Snowfall totals may exceed 2 feet in portions of these areas, including the Baltimore and Washington D.C. metropolitan areas.”
The monster storm has already caused at least ten deaths. Thousands of motorists are stranded.
High winds up to 55 mph are expected to batter the New Jersey shore, causing significant beach erosion, coastal flooding and property destruction in the same areas devastated by Superstorm Sandy. Thousands of people have been evacuated.
The blizzard has also impacted the US Presidential campaigns and forced New Jersey Governor Chris Christie to temporary cancel campaign appearances in New Hampshire on Friday and Saturday, to deal first hand with the storm back home.
Heavy ice and snow accumulations could cause falling tress resulting in downed power lines and days long power outages during brutally cold temperatures.
Here’s a cool supercomputer animation model:
Video caption: A NASA Center for Climate Simulation supercomputer model that shows the flow of #Blizzard2016 thru Sunday, January 24, 2015. Credit: NASA
Many airports have been closed and some seven thousand flights have also been canceled.
The storm is expected to last into Sunday, Jan. 24
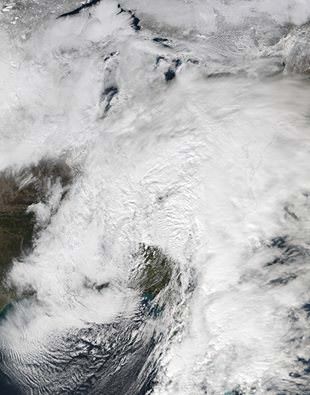
Looking massive from space…. This view of the winter storm over the eastern United States was captured on Friday, January 22, 2016 at 1:55 pm ET via the Visible Infrared Imaging Radiometer Suite (VIIRS) instrument on the Suomi NPP satellite. Credit: NASA/Goddard/Suomi NPP/VIIRS
Stay tuned here for Ken’s continuing Earth and Planetary science and human spaceflight news.
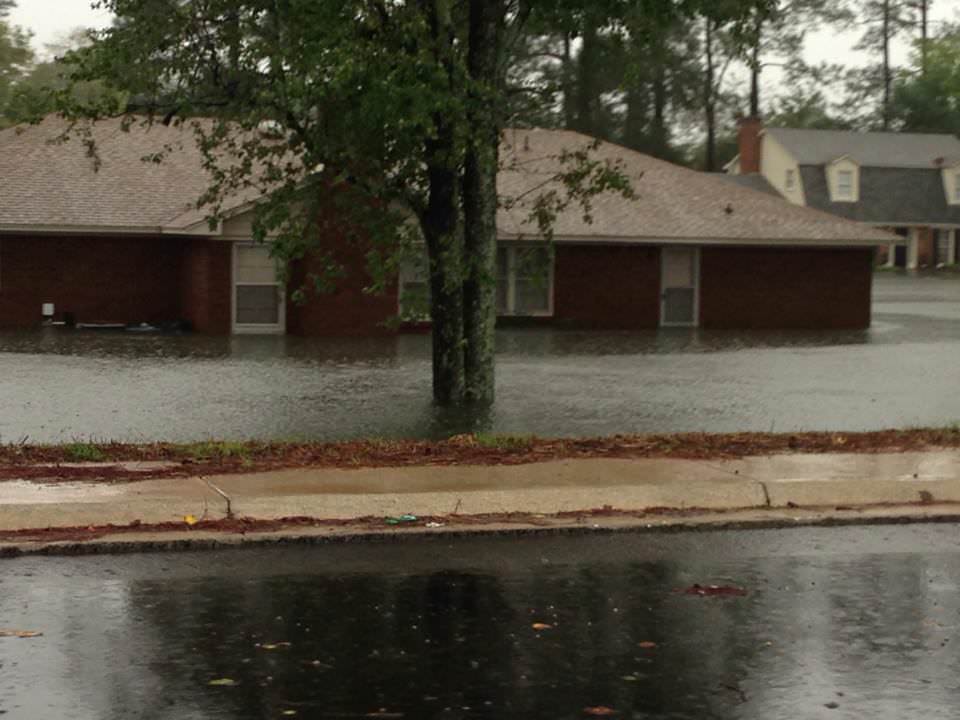
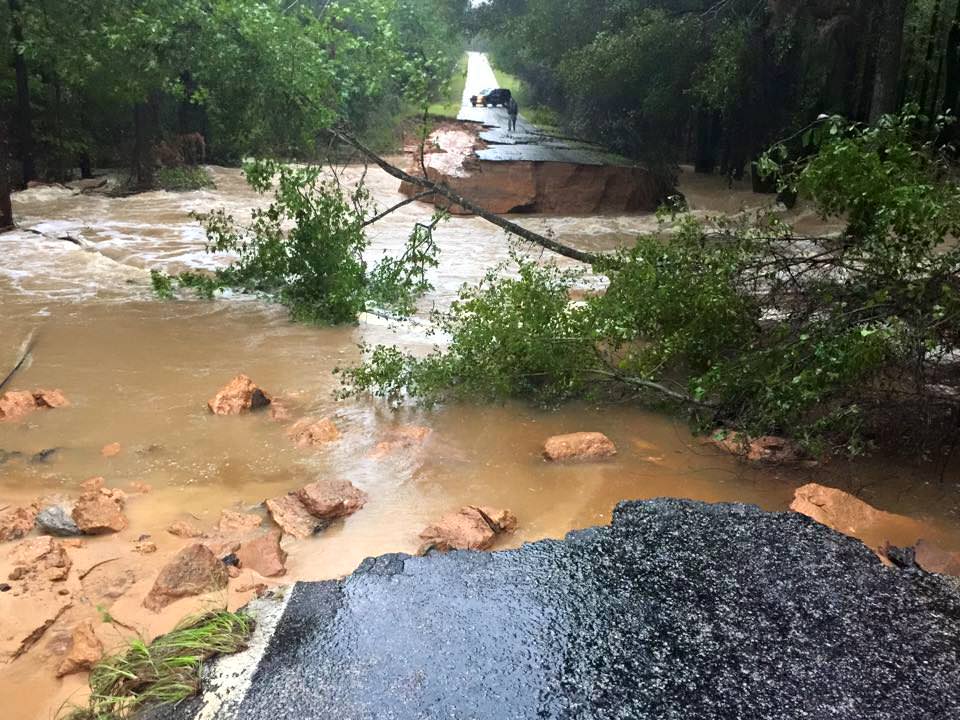
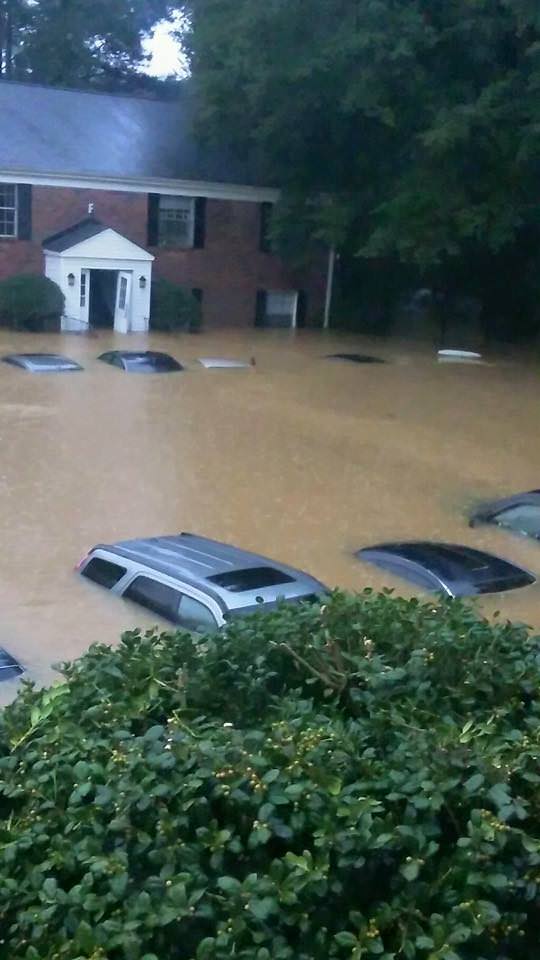
Flooded streets and houses in South Carolina. Credit: Hap Griffin
Video Caption: NASA/JAXA’s GPM satellite measured record rainfall that fell over the Carolinas from September 26 to October 5, 2015 from a plume of moisture from Hurricane Joaquin when it was located over the Bahamas and moved to Bermuda. The IMERG showed highest rainfall totals near 1,000 mm (39.3 inches) in a small area of South Carolina and rainfall between 700 and 900 mm (27.5 and 37.4 inches) over a large area of South Carolina. Credits: SSAI/NASA/JAXA, Hal Pierce See below ground level images and videos of storm devastation Story updated with additional details/imagery from NASA and South Carolina
South Carolina Gov. Nikki Haley declared the historic and torrential rain fall to be a “1000 Year event” on Sunday, Oct. 4. “We have never seen anything like this.” Governor Haley and President Obama issued a “State of Emergency.”
Although the horrendous rains in South Carolina may nearly be done, the nor’easter caused damage estimated to be in the Billions of Dollars and at least 9 storm related deaths as of today, Monday, Oct. 5.
Rainfall totals ranging from 14 to 37 inches in local areas over the past week drenched a wide swath of the Palmetto state with never before seen flooding, according to NASA and NOAA. The most intense periods of rain fell over the weekend.
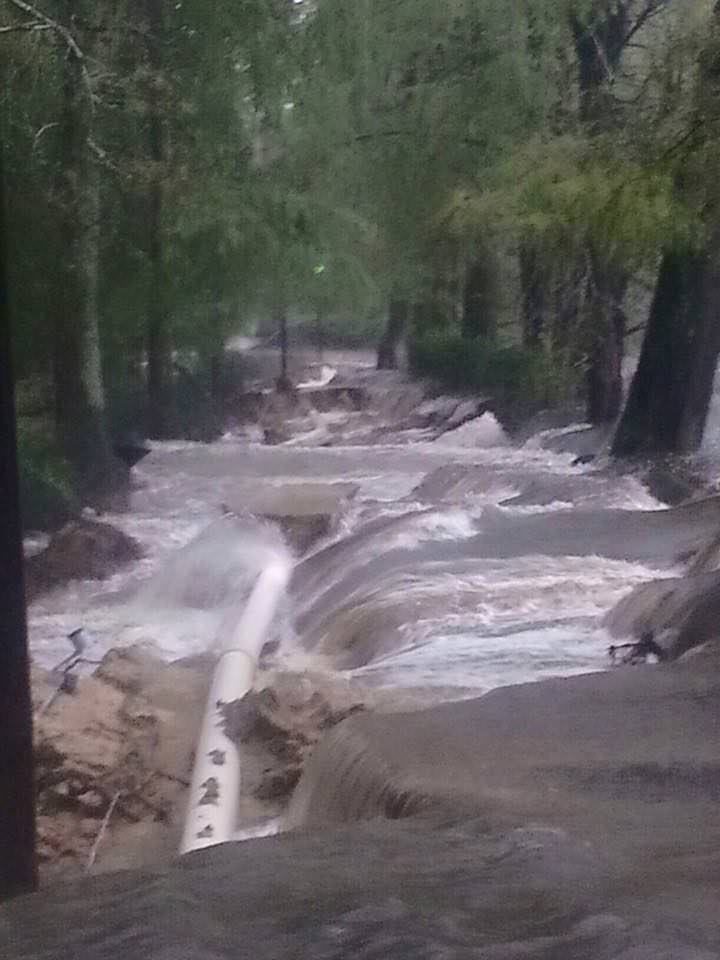
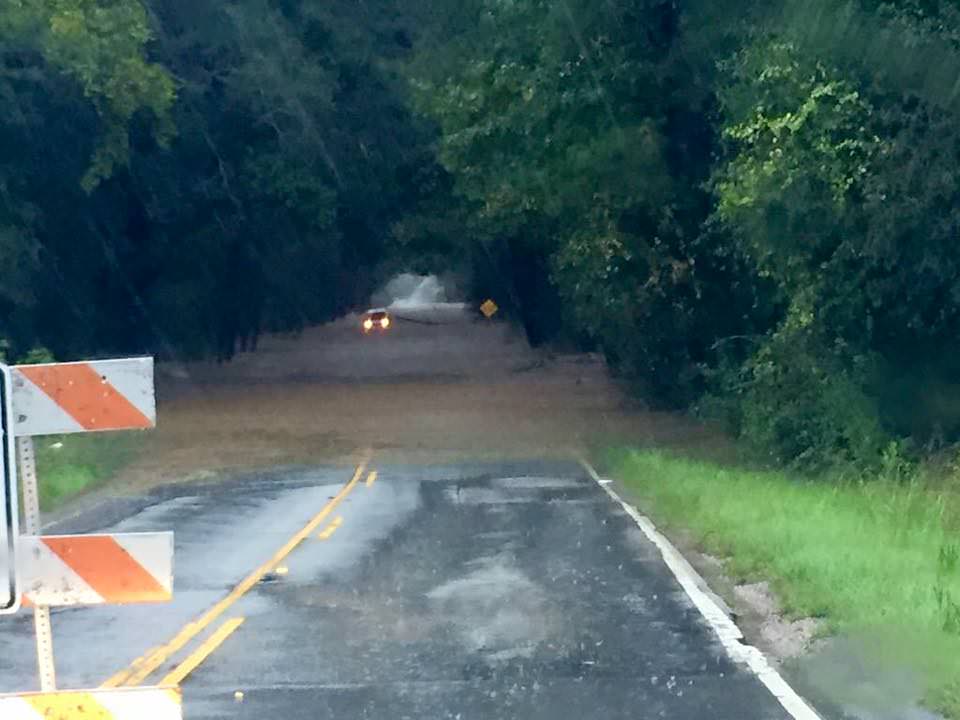
See herein a gallery of photos from friends and others living through the disaster in South Carolina.
NASA astronaut Scott Kelly also captured dramatic images of Hurricane Joaquin – as I reported earlier here.
A slew of NASA and NOAA orbiting weather satellites are constantly tracking the fierce storms and providing the state and federal governments with the most up to date forecasts to aid officials and emergency responders in evaluating and managing the disaster in the most effective manner possible.
NASA’s GPM and a global fleet of other international weather monitoring satellites gathered measurements every 30 minutes from September 26 to October 5, 2015 that were combined into the eyepoppongly dramatic IMERG (Integrated Multi-satellitE Retrievals for GPM) color-coded video above. It tracks the massive growth, spread and direction of the storms and shows the historic levels of destructive precipitation generated by the lethal pair of powerful storms.
The NASA GPM video shows plumes of moisture from the Nor’Easter and Hurricane Joaquin as they gather force and moved over South Carolina and through the Caribbean around and over the Bahamas and later as Joaquin fortunately veered away from the US eastern seaboard towards Bermuda.
“The IMERG showed highest rainfall totals near 1,000 mm (39.3 inches) in a small area of South Carolina and rainfall between 700 and 900 mm (27.5 and 37.4 inches) over a large area of South Carolina,” says NASA’s Hal Pierce.
Here’s a NASA video with NASA scientist Dalia Kirschbaum describing how GPM can see inside a hurricane to makes rainfall and precipitation measurements in 3D:
Video caption: NASA scientist Dalia Kirschbaum explains how the Global Precipitation Measurement Mission’s Core observatory has an instrument that can see layer by layer through a storm.
The GPM precipitation measurements come from both of its advanced radar instruments – the dual-frequency precipitation (DPR) radar instrument (Ku and Ka band) and the GPM microwave imager (GMI), NASA scientist George Huffman told Universe Today.
The IMERG video is based on an algorithm that also carefully combines and calibrates measurements gathered every 30 minutes from the passive microwave sensors flying aboard a large international constellation of satellites from the US, Europe, Japan and India – and outlined in complete detail further below by NASA’s Huffman and Kirschbaum; exclusively for Universe Today.
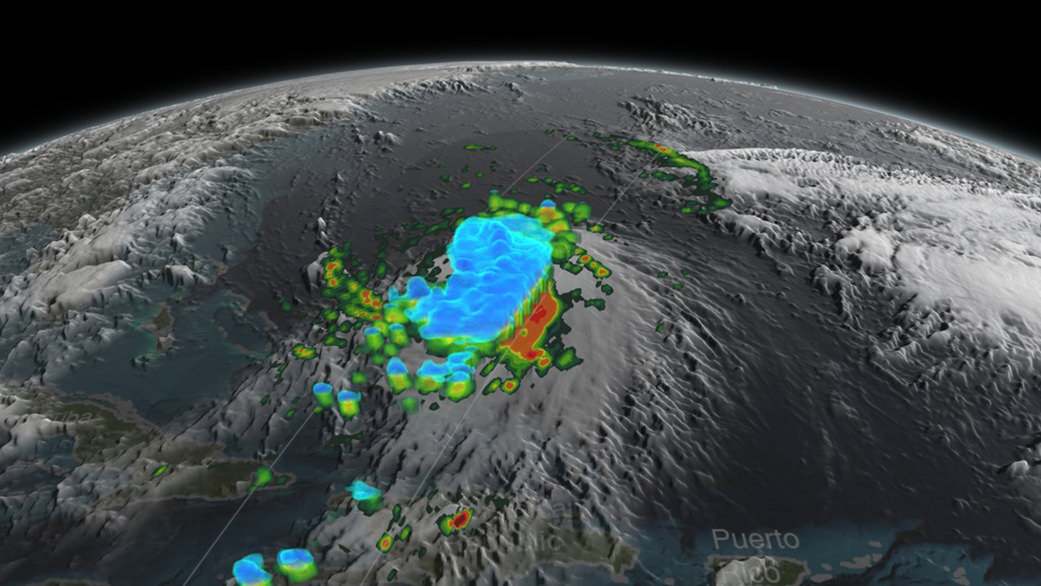
The visualization of data was created by NASAs Goddard’s Space Flight Center and shows Hurricane Joaquin around the Bahamas “when it was a tropical storm. Red and green colors show rain and the ice and snow at the top of the storm is visualized in blue.”
“Understanding hurricane structure helps weather forecasters around the world determine a storm’s structure and where it may be going,” says Kirschbaum.
Hurricane Joaquin was still packing winds exceeding 125 mph this morning, but it has lost strength throughout the day.
Over 40,000 homes and businesses are without power today, Oct. 5, in South Carolina due to the unending rain and widespread catastrophic flooding. And many folks had to be evacuated.
Some cemeteries were uprooted with caskets seen floating down flooded streets.
Residents are warned to stay out of the flood waters and standing waters that can be carrying bacteria and diseases presenting a significant health hazard.
In the capitol city of Columbia, there was widespread flooding with severe damage to water mains that cut off drinking water to over 15,000 people.
The governor deployed over 1300 national guard troops to render assistance. Over 150 folks were rescued by helicopter, some from the rooftops of their homes and apartments.
Here’s a helicopter rescue:
Video: Helicopter Rescue at Lakewood Links in Sumter, SC on Oct 4, 2014. Credit: Sean Reyes
Scores of South Carolina residents were getting rescued by canoes and even boats where waters surged in places up to 25 feet above normal.
At least 9 dams have been breached statewide, as well as levees, requiring many thousands people more to be evacuated.
Dam at Swan Lake in South Carolina on Oct. 4, 2015. Credit: Edwin Corning
Governor Haley confirmed that over 550 roads were either closed, damaged or destroyed, including back roads and major interstate highways vital to the states and US national economy.
A 70 mile stretch of I-95, a major north-south artery traveled by millions including myself, was closed to all traffic on Sunday and remains closed today. And many side roads that could serve as potential detours are also closed.
Historically high water levels in some of the areas worst hit by flooding has finally receded. But in other areas water levels are rising.
In addition, the US Coast Guard says the cargo ship ‘El Faro’ with 33 people aboard is believed to have sunk because it ventured straight into Hurricane Joaquin. The ship’s crew included 28 Americans and 5 Polish sailors. It sank in the area popularly known as the ‘Bermida Triangle’ in water some 3 miles deep.
Today, the Coast Guard reported the discovery of a debris field over 25-square-miles wide. At least one crew member has already been found dead.
The El Faro set out from the port of Jacksonville on Tuesday when Joaquin was a tropical storm with 85 mph wind speed.
The last distress call on last Thursday morning, as the ship neared the eye of the Hurricane, then a Category 3. The ship was listing over 15 degrees surrounded by 30 foot high waves.
The hurricane quickly grew into a Cat 4 and no further word was heard from the ship. It may be 3 miles underwater at the bottom of the Atlantic Ocean.
How and from which fleet of satellites does NASA obtain the orbital measurements used to create the high resolution, color-coded GPM IMERG visualizations?
“The Integrated Multi-satellitE Retrievals for GPM (IMERG) creates a merged precipitation product from the GPM constellation of satellites. These satellites include DMSPs from the U.S. Department of Defense, GCOM-W from the Japan Aerospace Exploration Agency (JAXA), Megha-Tropiques from the Centre National D’etudies Spatiales (CNES) and Indian Space Research Organization (ISRO), NOAA series from the National Oceanic and Atmospheric Administration (NOAA), Suomi-NPP from NOAA-NASA, and MetOps from the European Organisation for the Exploitation of Meteorological Satellites (EUMETSAT),” NASA scientists George Huffman and Dalia Kirschbaum told me exclusively for Universe Today.
“All of the instruments (radiometers) onboard the constellation partners are intercalibrated with information from the GPM Core Observatory’s GPM Microwave Imager (GMI) and Dual-frequency Precipitation Radar (DPR). The data are gridded at 0.1°x0.1° lat./lon and provided in 30 minute time slices through morphing between satellite overpasses. The satellite estimates are then calibrated with rainfall gauge information.”
Here’s another GPM visualization of Hurricane Joaquin:
Stay tuned here for Ken’s continuing Earth and planetary science and human spaceflight news.
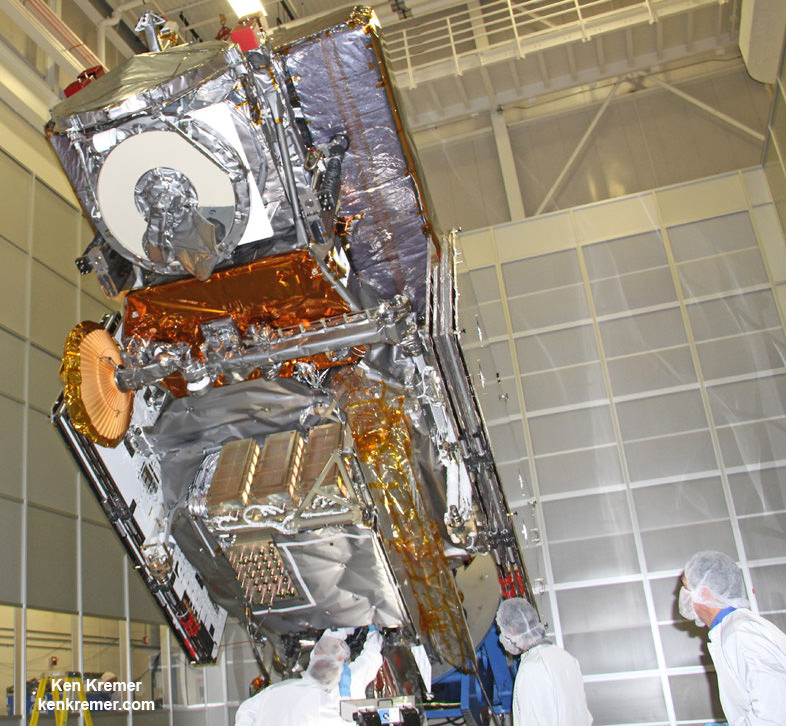
Hurricane Joaquin captured on Oct. 2, 2015 by NASA Astronaut Scott Kelly from the International Space Station. Credit: NASA/Scott Kelly NASA’s next generation Global Precipitation Measurement (GPM) observatory inside the clean room at NASA Goddard Space Flight Center, MD. Technicians at work on final processing during exclusive up-close inspection tour by Universe Today. GPM wasn successfully launched on February 27, 2014 and will provide global measurements of rain and snow every 3 hours. Credit: Ken Kremer/kenkremer.com
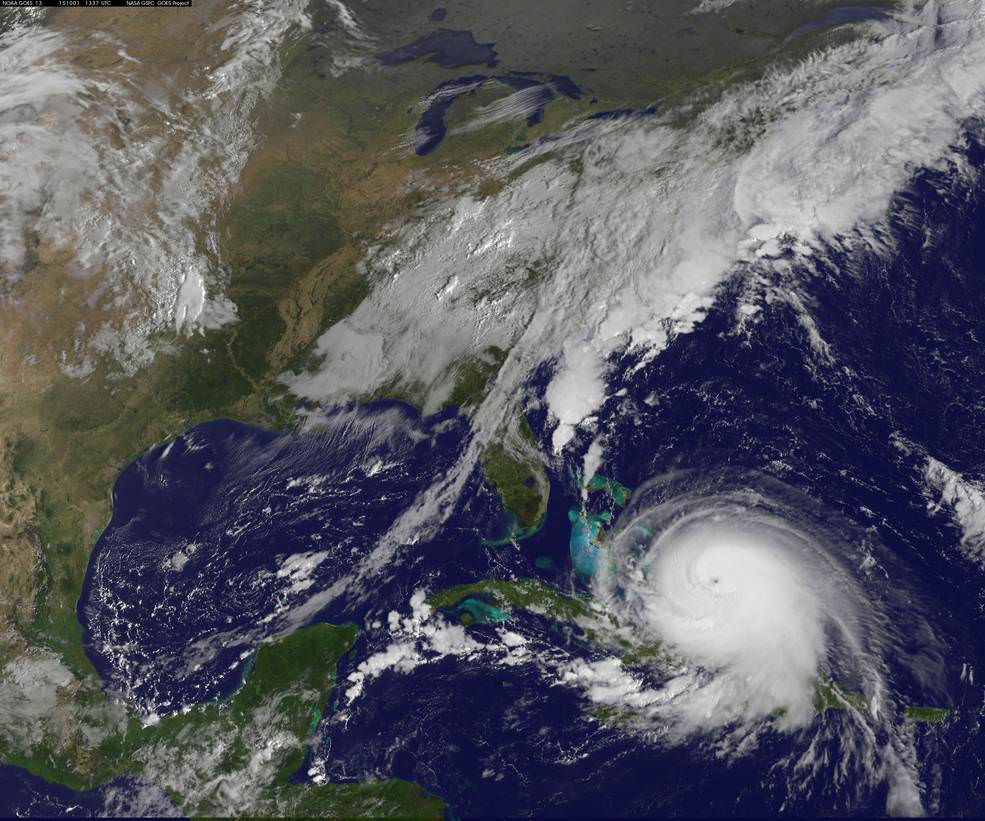
NOAA's GOES-East satellite captured this visible image of Hurricane Joaquin affecting the Bahamas on Thursday, Oct. 1 at 1255 UTC. Credits: NASA/NOAA GOES Project
Video caption: This animation of images captured from September 29 to October 1, 2015 from NOAA’s GOES-East satellite shows Hurricane Joaquin become a major hurricane in the Bahamas. Credits: NASA/NOAA GOES Project
NEW JERSEY – A wide swath of the US East Coast is bracing for impact in the coming days as ‘Hurricane Joaquin’ strengthened to a major and dangerous Category 4 storm, today, Thursday, Oct. 1, as NASA and NOAA satellites keep constant watch as it barrels potentially towards tens of millions of coastal residents.
Joaquin is already packing winds exceeding 130 mph with even higher wind gusts as the storm continues to strengthen at this hour and the pressure is decreasing. See the latest Hurricane Joaquin animation and imagery from NASA and NOAA, above and below.
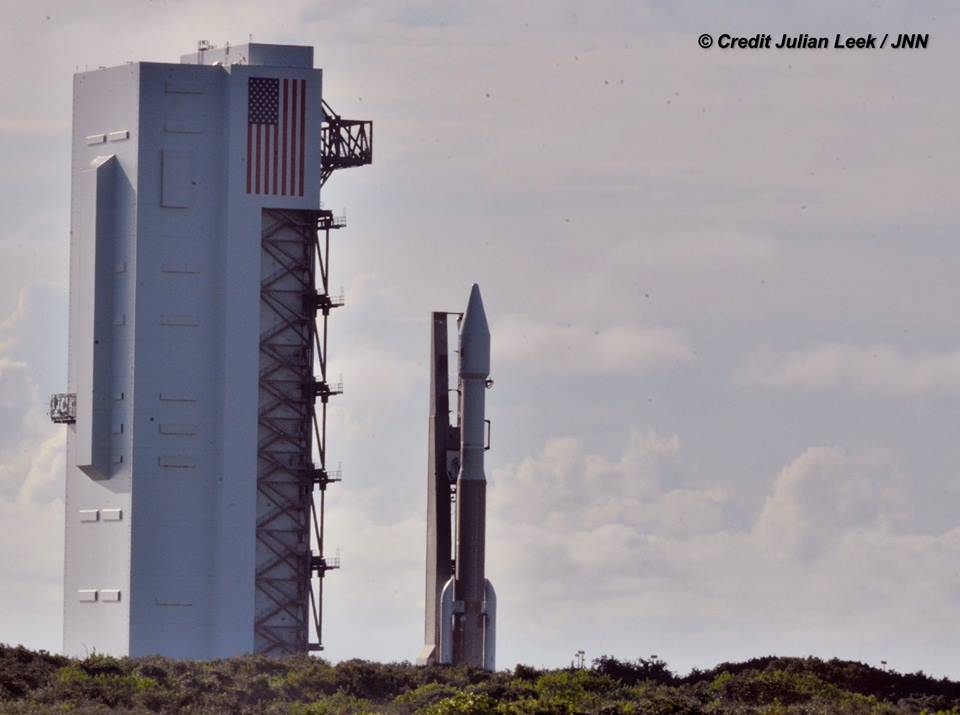
A ULA Atlas V is slated to lift off Friday from Cape Canaveral Air Force Station in Florida at 6:08 a.m. EDT with the Morelos-3 communications satellite for Mexico, before the hurricane gets closer to Florida.
The National Hurricane Center declared Joaquin had intensified into a massive Category 4 hurricane on the Saffir-Simpson Wind Scale, as of 2 PM EDT today, Oct. 1.
You can watch the launch on ULA’s live webcast starting at 5:48 a.m. Oct 2: http://www.ulalaunch.com
The governors of three states – New Jersey, Virginia and North Carolina – have already declared ‘States of Emergency’ in anticipation of potentially destructive winds, potentially life threatening drenching rains and floods, downed power lines and ocean rip currents with high waves in local areas.
Multiple NASA and NOAA satellites are intensively and continuously observing Joaquin, and are providing absolutely critical data to forecasters and government officials with the most current and best information available.
NASA’s GPM, Terra and NPP-Suomi satellites and NOAA’s GOES-East satellite are tracking Joaquin and have seen powerful thunderstorms today which indicates continued strengthening.
At this time we still don’t whether the US eastern seaboard will suffer a major hit but officials are taking no chances after suffering through Superstorm Sandy which caused many deaths, widespread power outages and billions and billions of dollars of damage – from which we are still recovering.
Joaquin is currently over The Bahamas in the Caribbean and is expected to make a sharp right turn on Friday Oct 2 and head northwards to the east coast and the Atlantic Ocean. It could start impacting the Carolinas and regions further north as soon as Sunday, Oct. 4, based on current forecasts, and drop double digits inches of torrential rainfall.
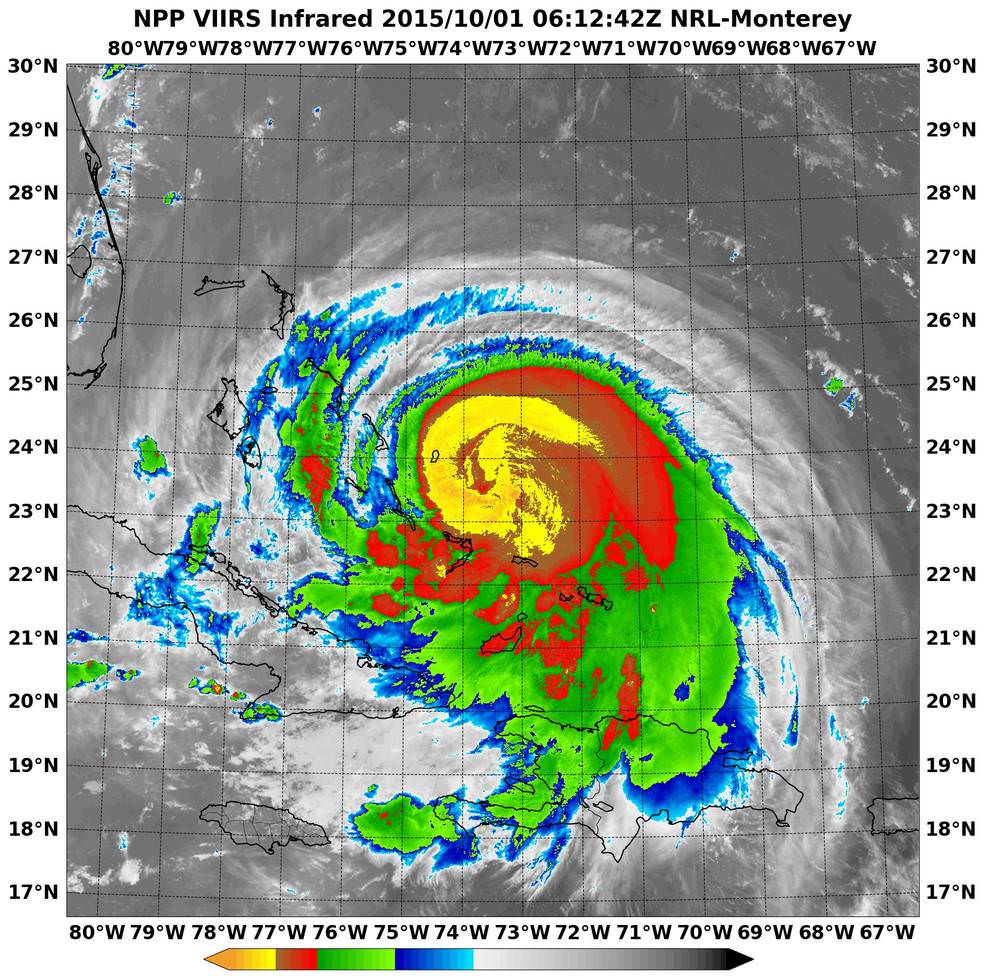
NASA-NOAA’s Suomi NPP satellite passed over Joaquin at 06:10 UTC (2:10 a.m. EDT) on Oct. 1 as it was strengthening from a Category 2 to a Category 3 hurricane. It’s now a Category 4. Imagery showed cloud top temperatures colder than -63F/-53C (yellow). Credits: NRL/NASA/NOAA
Its pounding the Bahamas right now and is creating a disaster with hurricane force winds and heavy rainfall, say weather forecasters, as it remains over the island for some 24 hours or more and may drop over 10 inches of rain.
But there is a very wide cone of uncertainly of where it could hit as the possible storm track extends from the Carolinas to Maine. It may or may not directly impact the eastern US. The storm may shift to the right and spare the east coast. But no one knows at this time.
Some areas on the US East coast stretching from Virginia to Maine have already suffered from torrential rains and severe flooding from an unrelated storm the past few days and also right now today, Thursday.
So the grounds are already saturated in parts of the Carolina’s, Virginia, Maine and elsewhere.
NASA/JAXA’s GPM satellite provided a 3-D side view of Tropical Storm Joaquin on Sept. 29 showing the internal precipitation structure. The areas in blue are frozen precipitation. Areas in green and red are liquid precipitation. Credits: Scientific Visualization Studio, NASA’s Goddard Space Flight Center
Coastal flood warnings and watches are already in effect in many areas along the eastern seaboard where local areas could be drenched by some 12 to 18 inches of additional rain which could fall even before the hurricane hits.
Significant beach erosion has already occurred in the Carolinas over the past few days and more is expected up and down the entire coast up to Maine.
And 10 foot high defense berms of sand are being constructed at this moment along miles and miles of the Jersey Shore – areas that suffered devastating damage from Superstorm Sandy.
There is a potential risk of deadly flooding, flash flooding and damage to houses, buildings, businesses, roadways and infrastructure.
“At 2 p.m. EDT (1800 UTC), the center of Hurricane Joaquin was located near latitude 23.0 North, longitude 74.2 West. Joaquin was moving generally southwestward at about 6 mph (9 kph), and the National Hurricane Center forecast a turn toward the northwest and north on Friday, Oct. 2. On the forecast track, the center of Joaquin will move near or over portions of the central Bahamas today and tonight and pass near or over portions of the northwestern Bahamas on Friday, Oct. 2,” according to NASAs Rob Gutro.
The weather forecast for Friday’s launch from Cape Canaveral , Florida is currently 70 percent GO for liftoff of the United Launch Alliance Atlas V rocket at 6:08 a.m. EDT. The Atlas V will launch with the Morelos-3 mission for Mexico’s Secretaria de Comunicaciones y Transportes (Ministry of Communications and Transportation).
Morelos-3 will be part of the Mexsat constellation of satellites that delivers advanced telecommunications throughout Mexico. United Launch Alliance Atlas V rocket after rollout to Pad 41 at Cape Canaveral Air Force Station, Florida for planned Oct. 2 launch at 6:08 a.m. EDT with the Morelos-3 mission for Mexico’s Ministry of Communications and Transportation. In progress assembly of the commercial crew access tower is seen at right, now under construction for the Boeing Starliner space taxi for astronaut crews launching to the ISS. Credit: Julian Leek
Stay tuned here for Ken’s continuing Earth and planetary science and human spaceflight news.
United Launch Alliance Atlas V rocket during rollout to Space Launch Complex-41 at Cape Canaveral Air Force Station, Florida on Oct. 1 for planned Oct. 2 launch at 6:08 a.m. EDT with the Morelos-3 mission for Mexico’s Ministry of Communications and Transportation. Credit: Julian Leek
NASA Astronaut Scott Kelly took this picture of Hurricane Danny on August 20 at 6 a.m. EDT from aboard the International Space Station. Credits: NASA
Hurricane Danny, the first Atlantic Ocean hurricane of the 2015 season has been caught on camera by NASA astronautScott Kelly, in a beautiful image taken on Thursday, August 20 at 6 a.m. EDT from his glorious perch aboard the International Space Station (ISS).
Poking majestically down at the sprawling hurricane is the space stations Canadian-built robotic arm that will be used by Kelly in a few days to grapple Kounotori, the Japanese cargo ship launched earlier this week and berth it at a docking port.
Kelly is nearly five months into his year-long stay aboard the ISS and is a prolific photographer of the natural wonders of our home planet.
“Hurricane Danny. Keeping an eye on you from the International Space Station. Looks like you’re 1st in the Atlantic this year. Stay safe below! #YearInSpace,” wrote Kelly on his Facebook and twitter pages.
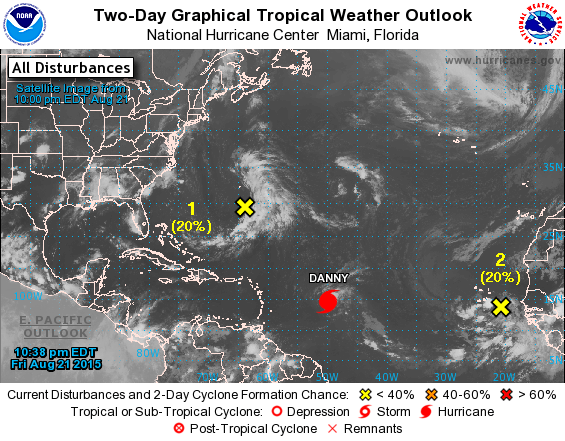
Danny had risen to a Category 3 hurricane by Friday afternoon, August 21, with winds over 115 mph and was moving westward in the Central Atlantic Ocean towards the Leeward Islands in the Caribbean.
By 11 a.m. EDT (1500 UTC) on Friday, August 21, the eye of Hurricane Danny was located near latitude 14.0 North, longitude 48.2 West, according to NASA. The center of Danny was about 930 miles (1,195 km) east of the Leeward Islands. With maximum sustained winds of near 105 mph (165 kph), Danny was a Category 2 hurricane on the Saffir-Simpson Hurricane Wind Scale.
By 8:00 p.m. Friday evening, Friday, the National Hurricane Center said Danny was located over the central tropical Atlantic Ocean about 800 miles east of the Leeward Islands.
Late this evening at 11 p.m., the National Hurricane Center said it had weakened slightly back to a Category 2 storm with maximum winds of 110 mph and was located at 14.8°N and 49.8°W while moving west northwest at 10 mph.
The NASA GOES-East animation below combines visible and infrared imagery showing Hurricane Danny’s movement in the eastern and central Atlantic Ocean from Aug. 18 to 21, 2015.
Video caption: Hurricane Danny Seen By GOES-East. This animation of visible and infrared imagery of Hurricane Danny in the Central Atlantic Ocean was taken from NOAA’s GOES-East satellite from Aug. 18 to 21. Credits: NASA/NOAA GOES Project
Forecasters with the National Hurricane Center think it may weaken over the next few days as it heads towards the Caribbean islands.
“Vertical shear is expected to increase further during the next couple of days, which should allow drier air in the surrounding environment to penetrate into Danny’s circulation. Therefore,there is no change in the thinking that Danny should weaken as it approaches and moves across the Leeward Islands and the Greater Antilles during the forecast period.”
Danny could reach Puerto Rico by Monday in a weakened state.
Although it’s still far away from the US, it’s not expected to impact the East Coast but that could change.
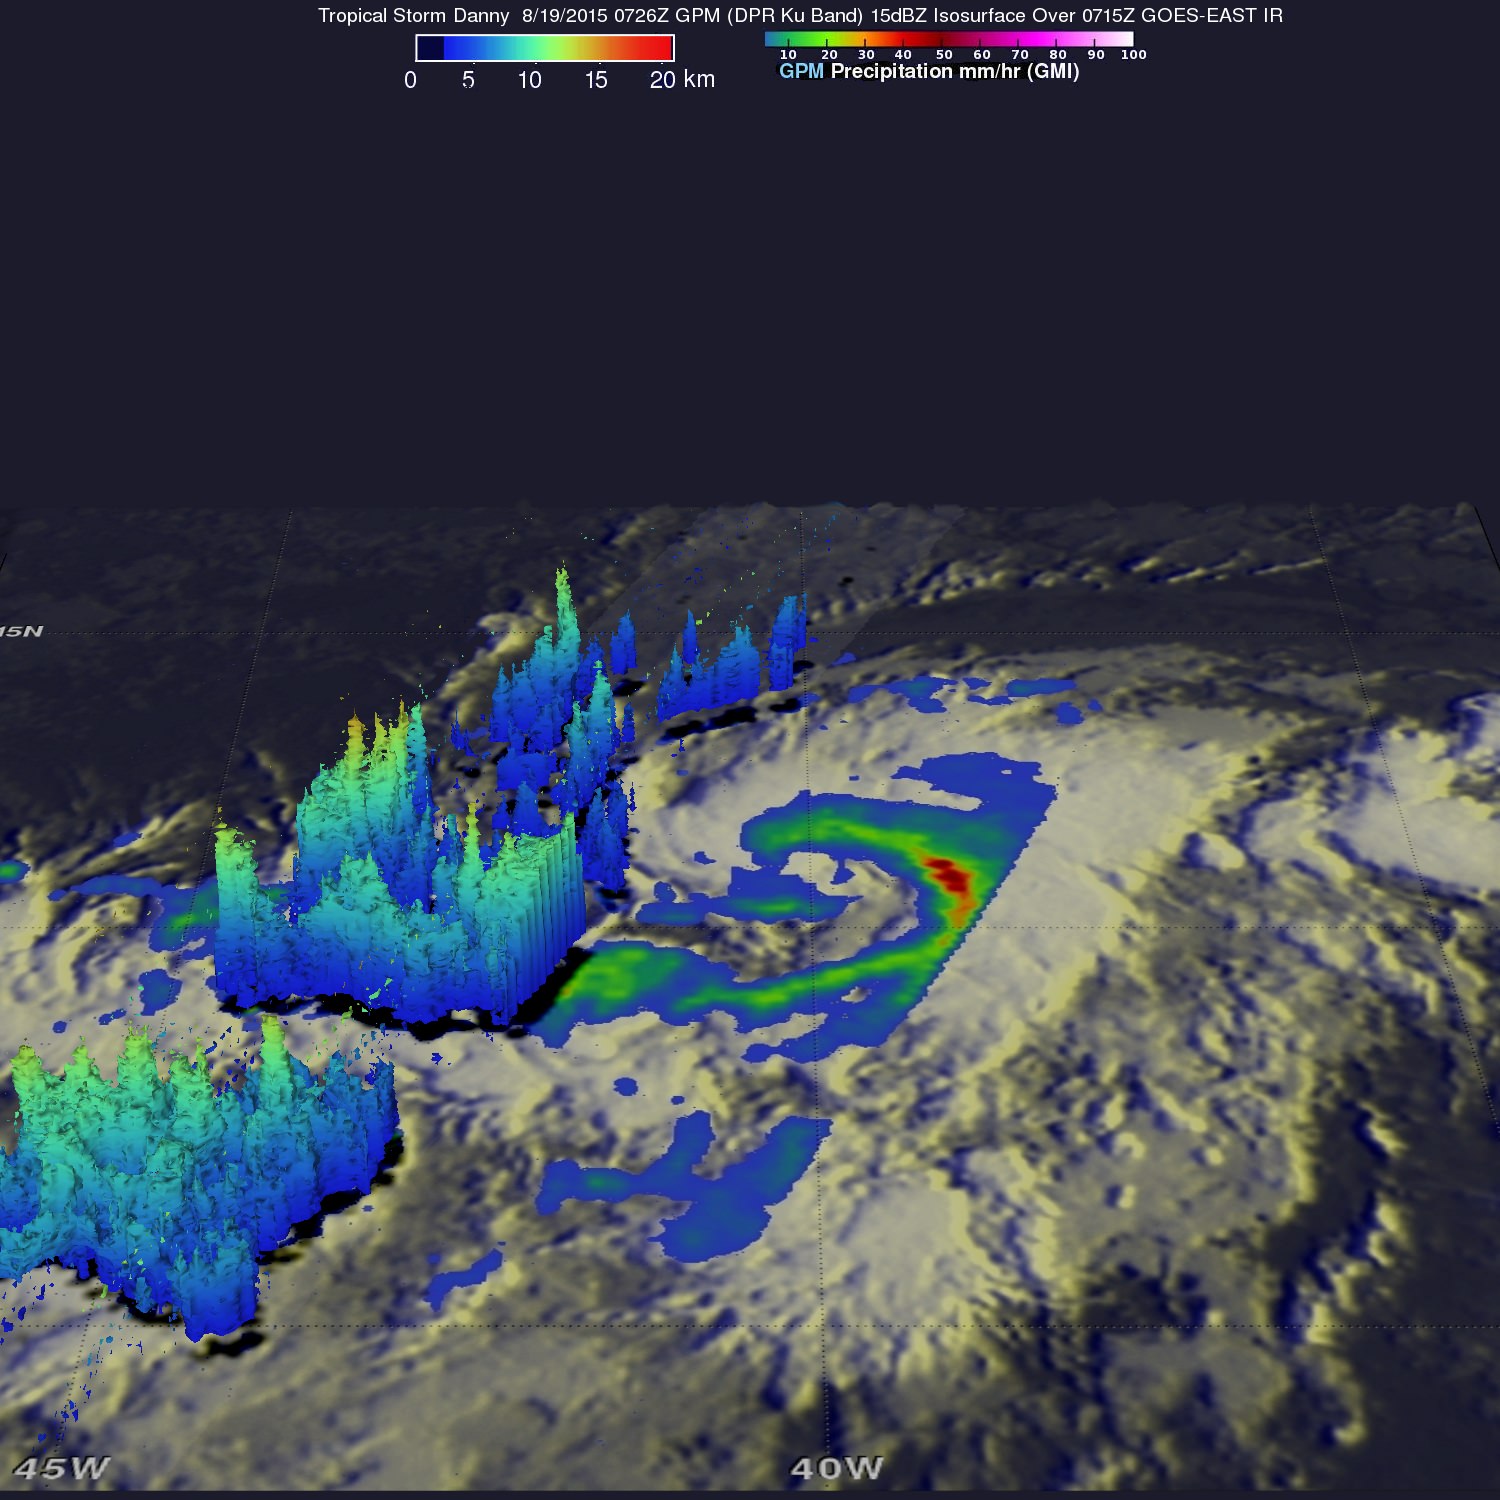
On Aug. 19, 2015 GPM saw Danny’s rain structure was still asymmetric as noted by the large rain band (identified by the green arc indicating moderate rain) being located mainly on the eastern side of the storm. Within this rain band, GPM detected rain rates of up to 73.9 mm/hour (shown in darker red).Credits: SSAI/NASA, Hal Pierce
“GPM showed that Danny was still in the process of becoming organized. The rain structure was still very asymmetric as noted by a large rain band being located mainly on the eastern side of the storm. Within this rain band, GPM detected rain rates of up to 73.9 mm/hour. At the time of this image, Danny was still a minimal tropical storm with sustained winds estimated at 50 mph by the National Hurricane Center (NHC),” said officials.
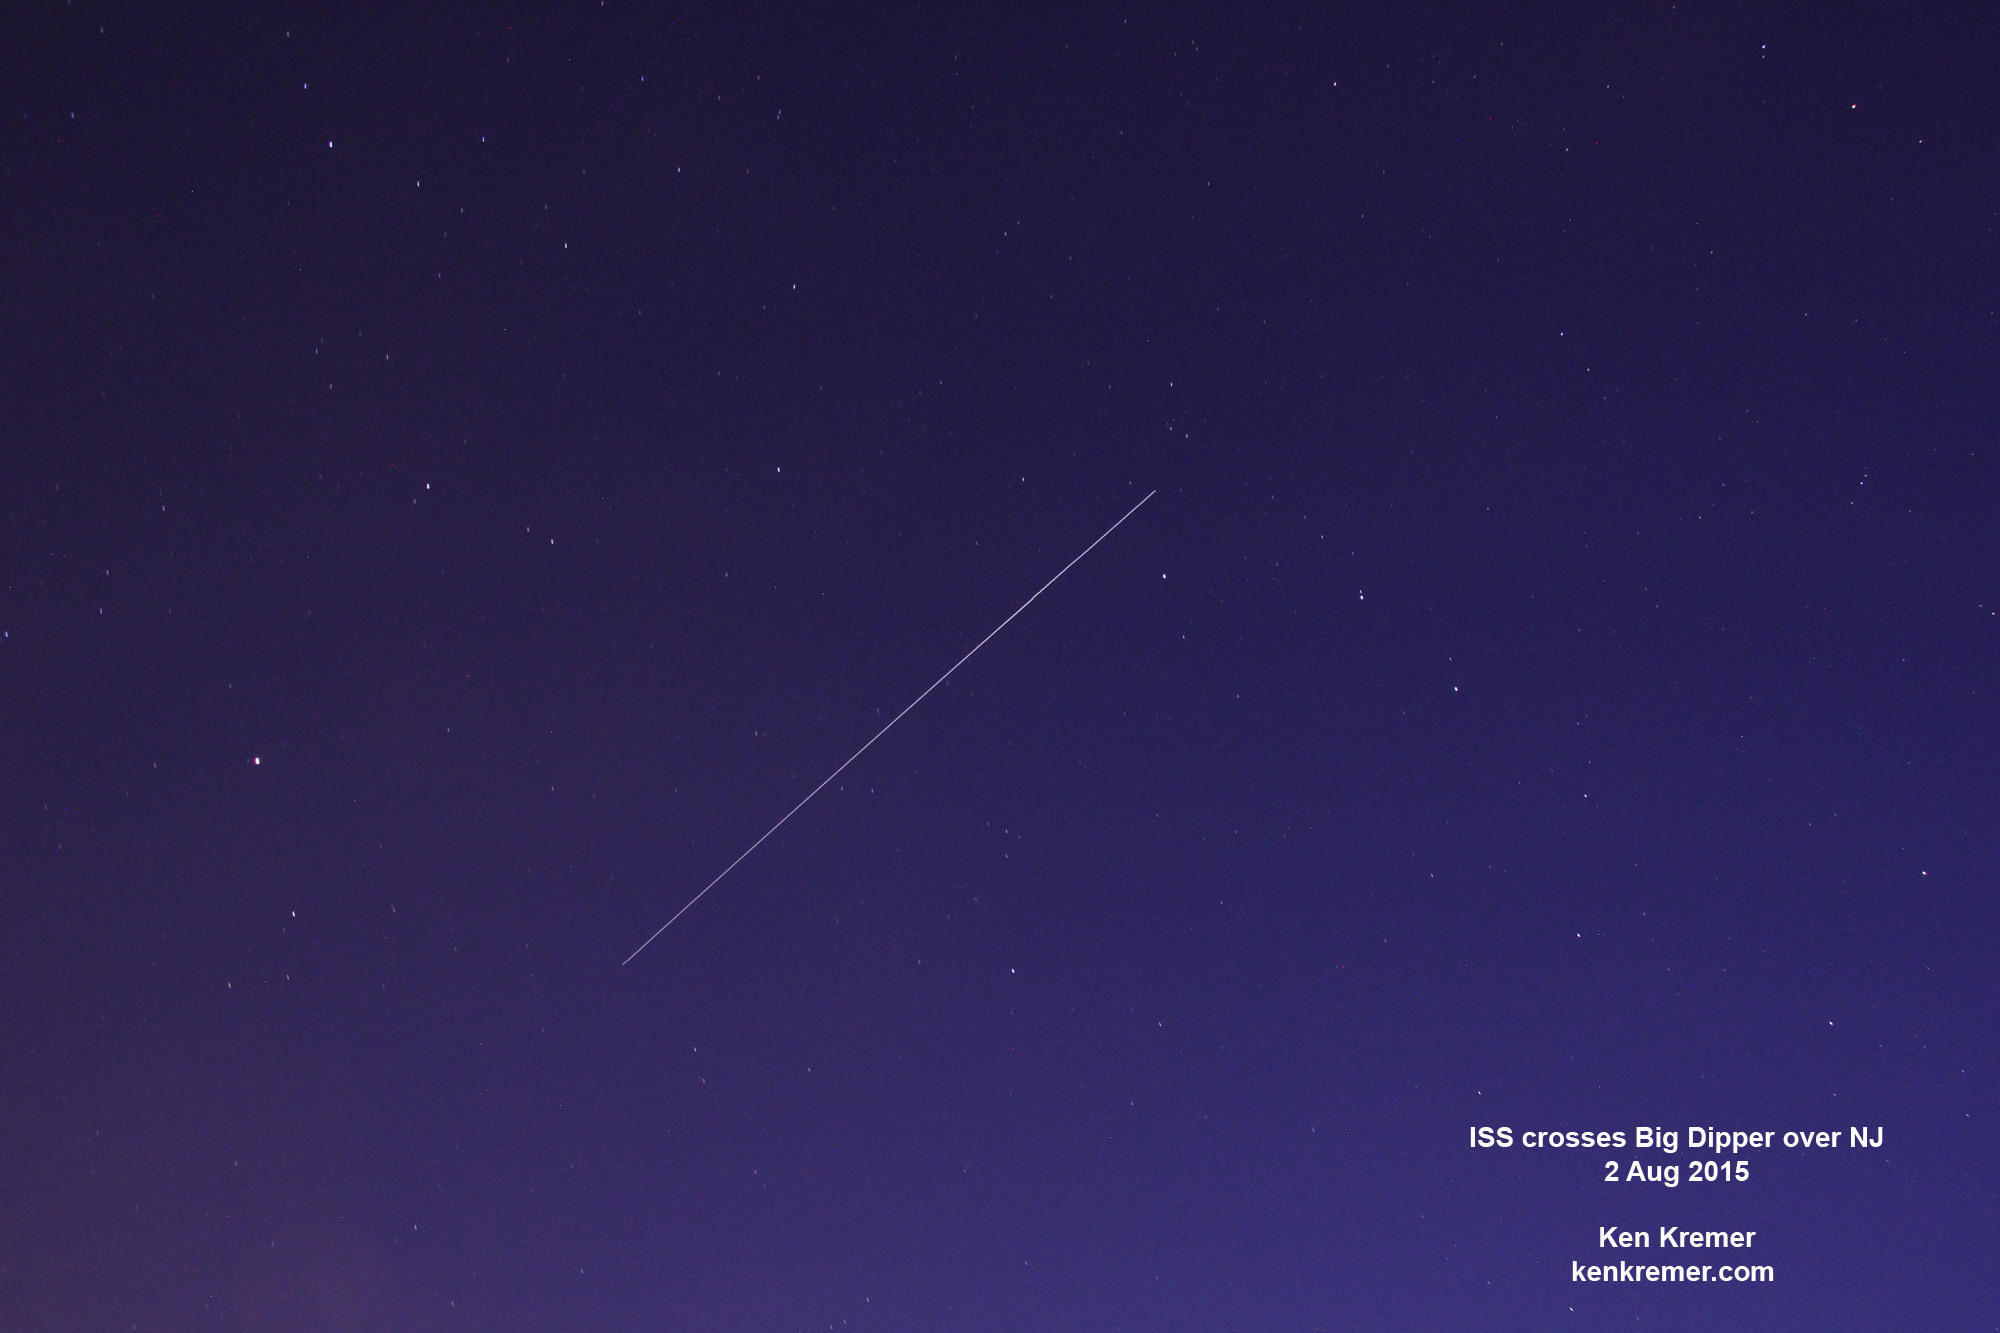
And dont forget that you can watch Commander Scott Kelly and his five international crew mates on a regular basis as they soar overhead. Just click on NASA’s Spot the Station link and plug in your location.
ISS crosses the Big Dipper over NJ. Credit: Ken Kremer/kenkremer.com
Stay tuned here for Ken’s continuing Earth and planetary science and human spaceflight news.
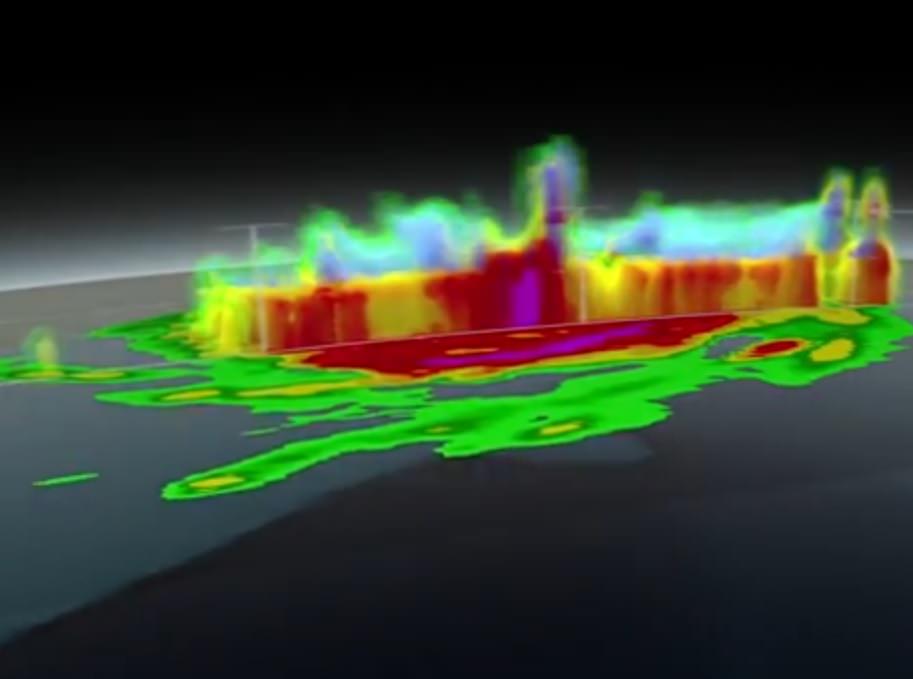
A 3-D view of Hurricane Arthur in July 2014, taken from instruments aboard the NASA-JAXA Global Precipitation Measurement (GPM) Core Observatory. Credit: NASA / YouTube (screenshot)
While Hurricane Arthur was still a hurricane, the new Global Precipitation Measurement (GPM) Core Observatory flew over the storm last week and captured its structure in 3-D. This was a good test of the new satellite, which is supposed to help NASA track these Atlantic storms to better precision than before.
The joint NASA-Japanese Aerospace Exploration Agency mission allowed researchers to do better forecasting because they could track the precipitation to 1,000 feet vertically and three miles horizontally (305 meters and five kilometers).
“Hurricane features pop out more. They’re sharper, there’s more clarity to the structures,” stated NASA Goddard hurricane researcher Scott Braun. “Being able to see the structures more clearly may allow for better determination of the structure of the eye wall and rainbands, thereby providing clues about the likelihood of a storm intensifying or weakening.”
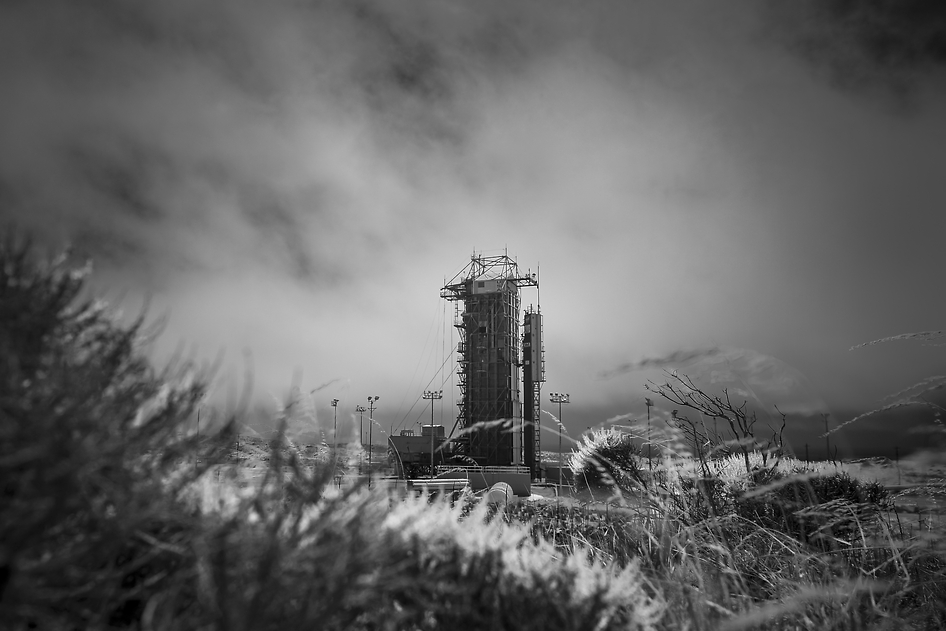
NASA’s Orbiting Carbon Observatory-2 (OCO-2) at the Launch Pad. This black-and-white infrared view shows the launch gantry, surrounding the United Launch Alliance Delta II rocket with the Orbiting Carbon Observatory-2 (OCO-2) satellite onboard. The photo was taken at Space Launch Complex 2, Friday, June 27, 2014, Vandenberg Air Force Base, Calif. OCO-2 is set for a July 1, 2014 launch. Credit: NASA/Bill Ingalls
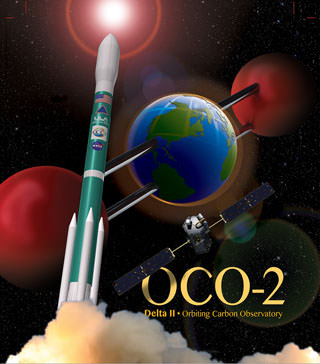
NASA’s Orbiting Carbon Observatory-2 (OCO-2) at the Launch Pad
This black-and-white infrared view shows the launch gantry, surrounding the United Launch Alliance Delta II rocket with the Orbiting Carbon Observatory-2 (OCO-2) satellite onboard. The photo was taken at Space Launch Complex 2, Friday, June 27, 2014, Vandenberg Air Force Base, Calif. OCO-2 is set for a July 1, 2014 launch. Credit: NASA/Bill Ingalls[/caption]
After a lengthy hiatus, the workhorse Delta II rocket that first launched a quarter of a century ago and placed numerous renowned NASA science missions into Earth orbit and interplanetary space, as well as lofting dozens of commercial and DOD missions, is about to soar again this week on July 1 with NASA’s Orbiting Carbon Observatory-2 (OCO-2) sniffer to study atmospheric carbon dioxide (CO2).
OCO-2 is NASA’s first mission dedicated to studying atmospheric carbon dioxide, the leading human-produced greenhouse gas and the principal human-produced driver of climate change.
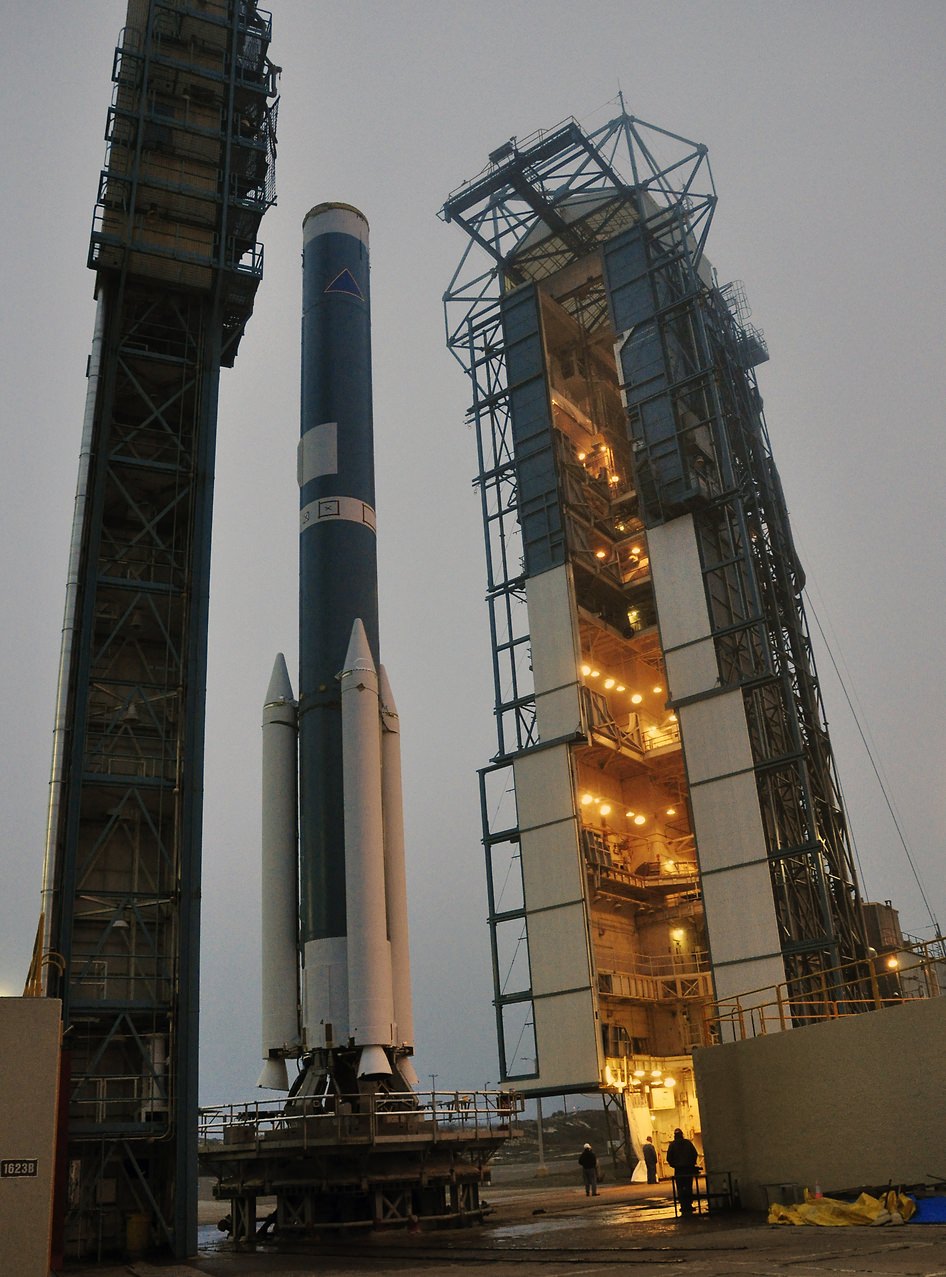
The 999 pound (454 kilogram) observatory is equipped with one science instrument consisting of three high-resolution, near-infrared spectrometers fed by a common telescope. It will collect global measurements of atmospheric CO2 to provide scientists with a better idea of how CO2 impacts climate change. OCO-2’s Delta II Rocket, First Stage At Space Launch Complex 2 on Vandenberg Air Force Base in California, the mobile service tower rolls away from the launch stand supporting the first stage of the Delta II rocket for NASA’s Orbiting Carbon Observatory-2 mission. Three solid rocket motors (white) have been attached to the first stage. The photo was taken during operations to mate the rocket’s first and second stages. Credit: NASA/Randy Beaudoin
The $467.7 million OCO-2 mission is set to blastoff atop the United Launch Alliance (ULA) Delta II rocket on Tuesday, July 1 from Space Launch Complex 2 at Vandenberg Air Force Base in California.
Liftoff is slated for 5:56 a.m. EDT (2:56 a.m. PDT) at the opening of a short 30-second launch window.
The California weather prognosis is currently outstanding at 100 percent ‘GO’ for favorable weather conditions at launch time.
OCO-2 poster. Credit: ULA/NASA
The two stage Delta II 7320-10 launch vehicle is 8 ft in diameter and approximately 128 ft tall. It is equipped with a trio of strap on solid rocket motors. This marks the 152nd Delta II launch overall and the 51st for NASA since 1989.
The last time a Delta II rocket flew was nearly three years ago in October 2011 from Vandenberg for the Suomi National Polar-Orbiting Partnership (NPP) weather satellite.
The Delta II will boost OCO-2 into a 438-mile (705-kilometer) altitude, near-polar orbit. Spacecraft separation from the rocket occurs 56 minutes 15 seconds after launch.
It will lead a constellation of five other international Earth monitoring satellites that circle Earth.
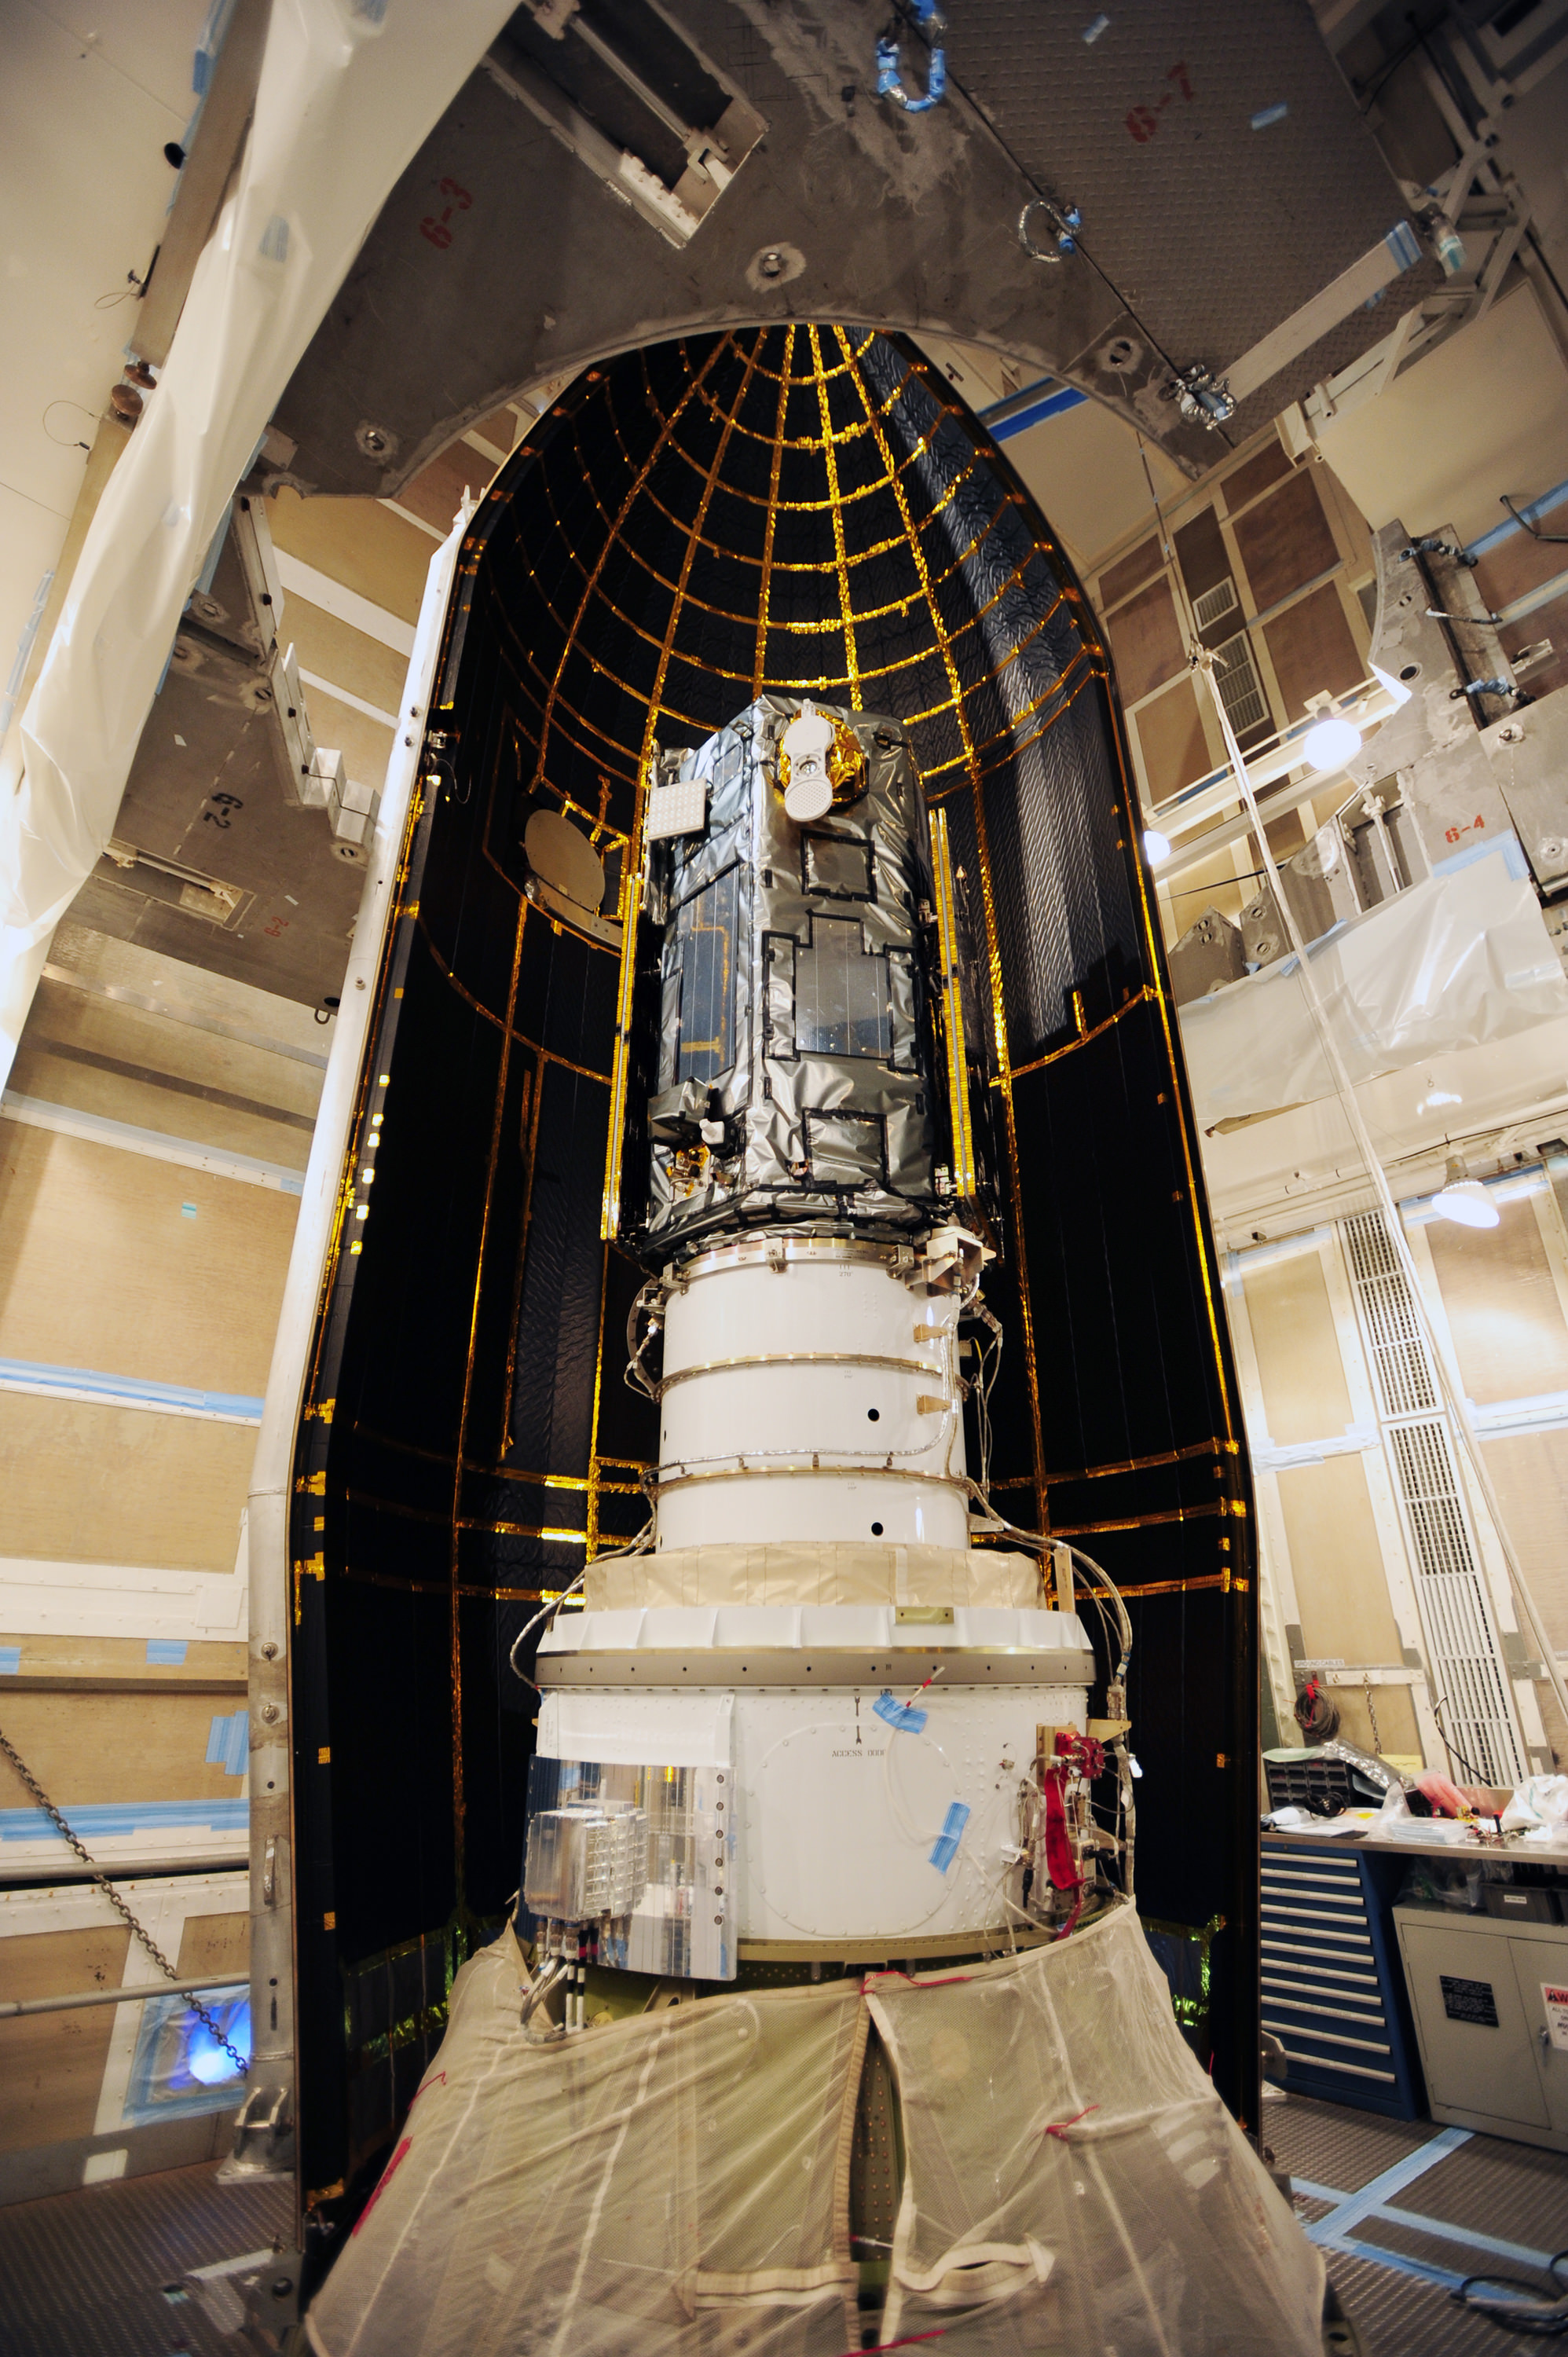
NASA’s Orbiting Carbon Observatory-2, or OCO-2, inside the payload fairing in the mobile service tower at Space Launch Complex 2 on Vandenberg Air Force Base in California. The fairing will protect OCO-2 during launch aboard a United Launch Alliance Delta II rocket, scheduled for 5:56 a.m. EDT on July 1. OCO-2 is NASA’s first mission dedicated to studying atmospheric carbon dioxide, the leading human-produced greenhouse gas driving changes in Earth’s climate. Credit: NASA/30th Space Wing USAF
The phone-booth sized OCO-2 was built by Orbital Sciences and is a replacement for the original OCO which was destroyed during the failed launch of a Taurus XL rocket from Vandenberg back in February 2009 when the payload fairing failed to open properly.
OCO-2 is the second of NASA’s five new Earth science missions launching in 2014 and is designed to operate for at least two years during its primary mission. It follows the successful blastoff of the joint NASA/JAXA Global Precipitation Measurement (GPM) Core Observatory satellite on Feb 27.
Orbiting Carbon Observatory-2 (OCO-2) mission will provide a global picture of the human and natural sources of carbon dioxide, as well as their “sinks,” the natural ocean and land processes by which carbon dioxide is pulled out of Earth’s atmosphere and stored, according to NASA..
“Carbon dioxide in the atmosphere plays a critical role in our planet’s energy balance and is a key factor in understanding how our climate is changing,” said Michael Freilich, director of NASA’s Earth Science Division in Washington.
“With the OCO-2 mission, NASA will be contributing an important new source of global observations to the scientific challenge of better understanding our Earth and its future.”
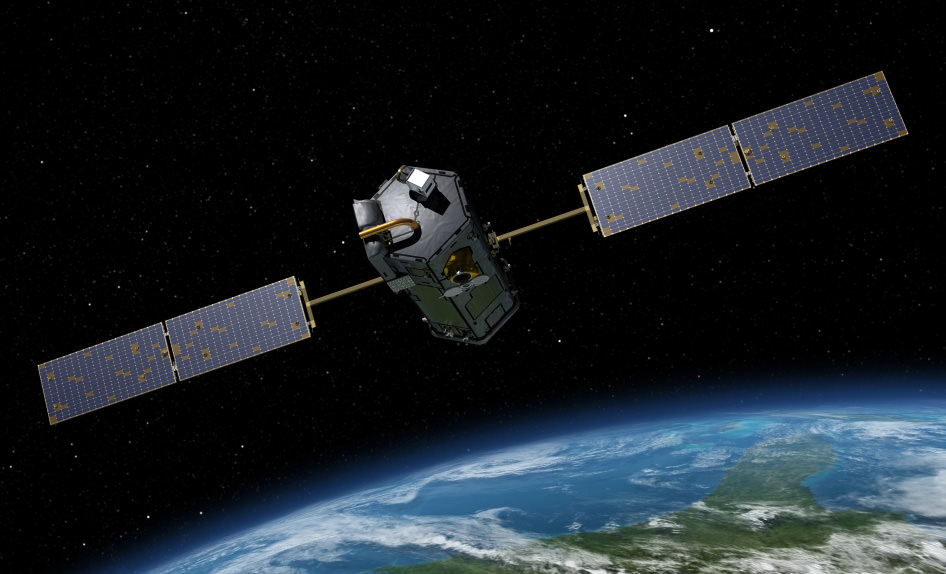
Artist’s rendering of NASA’s Orbiting Carbon Observatory (OCO)-2, one of five new NASA Earth science missions set to launch in 2014, and one of three managed by JPL. Credit: NASA-JPL/Caltech
It will record around 100,000 CO2 measurements around the world every day and help determine its source and fate in an effort to understand how human activities impact climate change and how we can mitigate its effects.
At the dawn of the Industrial Revolution, there were about 280 parts per million (ppm) of carbon dioxide in Earth’s atmosphere. As of today the CO2 level has risen to about 400 parts per million.
Stay tuned here for Ken’s continuing OCO-2, GPM, Curiosity, Opportunity, Orion, SpaceX, Boeing, Orbital Sciences, MAVEN, MOM, Mars and more Earth & Planetary science and human spaceflight news.
Blastoff of twin GRAIL A and B lunar gravity mapping spacecraft on a Delta II Heavy rocket on Sept. 10, 2011, from Pad 17B Cape Canaveral Air Force Station in Florida at 9:08 a.m. EDT. Credit: Ken Kremer/kenkremer.com
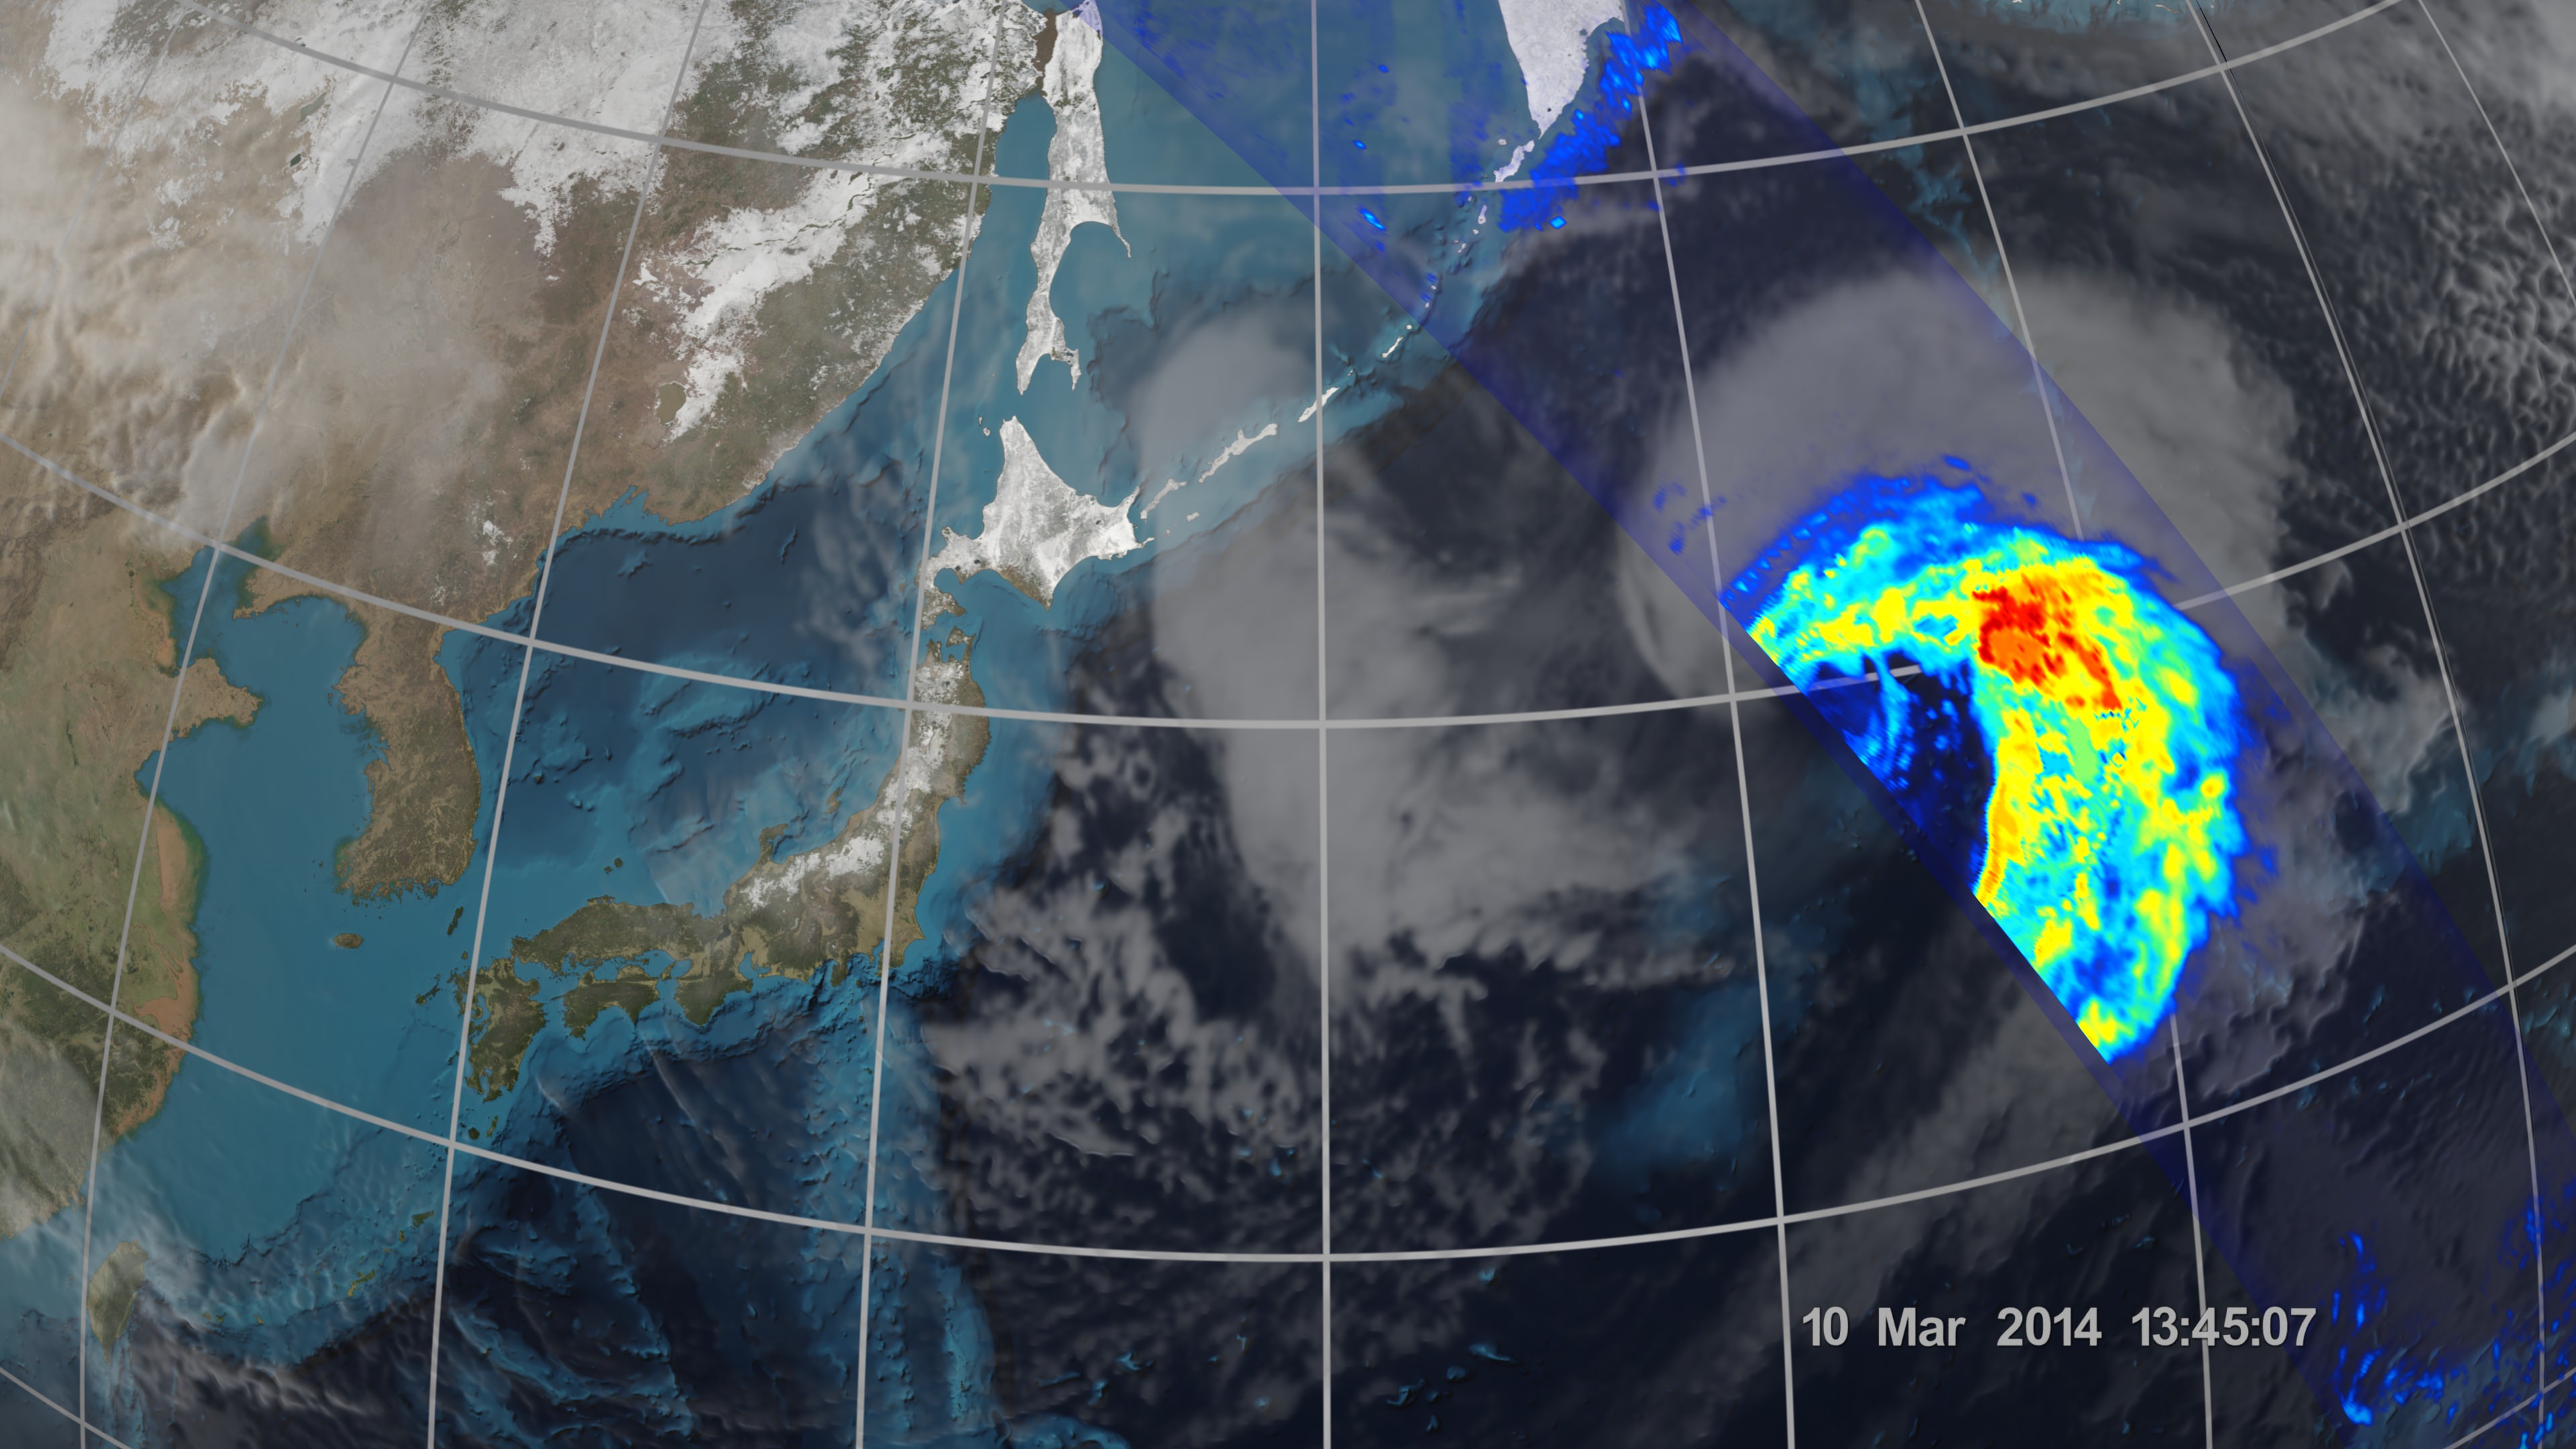
An extra-tropical cyclone seen off the coast of Japan, March 10, 2014, by the GPM Microwave Imager. The colors show the rain rate: red areas indicate heavy rainfall, while yellow and blue indicate less intense rainfall. The upper left blue areas indicate falling snow. Credit: NASA/JAXA
KENNEDY SPACE CENTER, FL – Weather researchers worldwide now have the ability to capture unprecedented three-dimensional images and detailed rainfall measurements of cyclones, hurricanes and other storms from space on a global basis thanks to the newest Earth observing weather satellite – jointly developed by the US and Japan.
NASA and the Japan Aerospace Exploration Agency (JAXA) have now released the first images captured by their Global Precipitation Measurement (GPM) Core Observatory satellite.
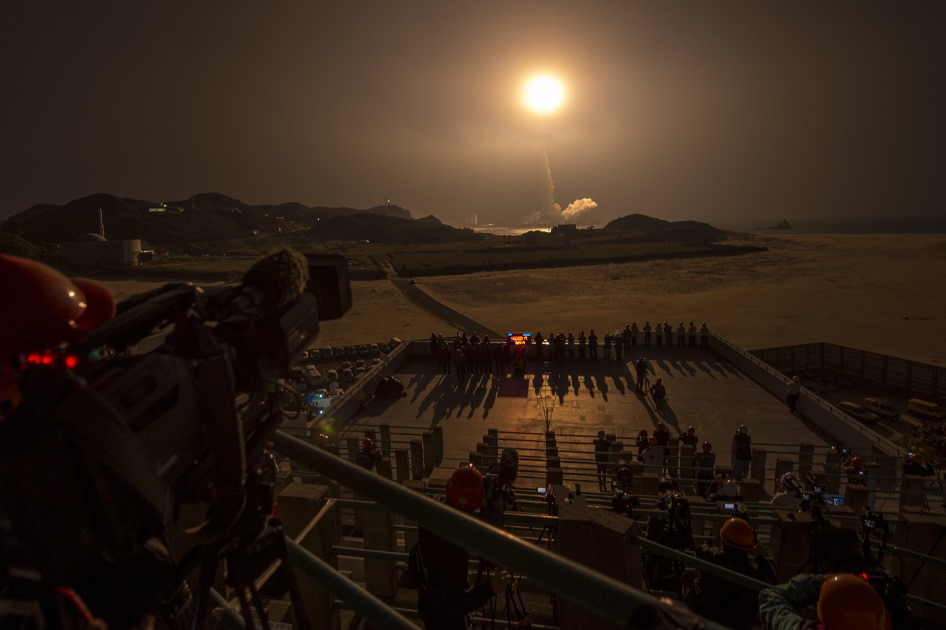
GPM soared to space on Feb. 27, exactly one month ago, during a spectacular night launch from the Japanese spaceport at the Tanegashima Space Center on Tanegashima Island off southern Japan.
The newly released series of images show precipitation falling inside a vast extra-tropical cyclone cascading over a vast swath of the northwest Pacific Ocean, approximately 1,000 miles off the coast of eastern Japan.
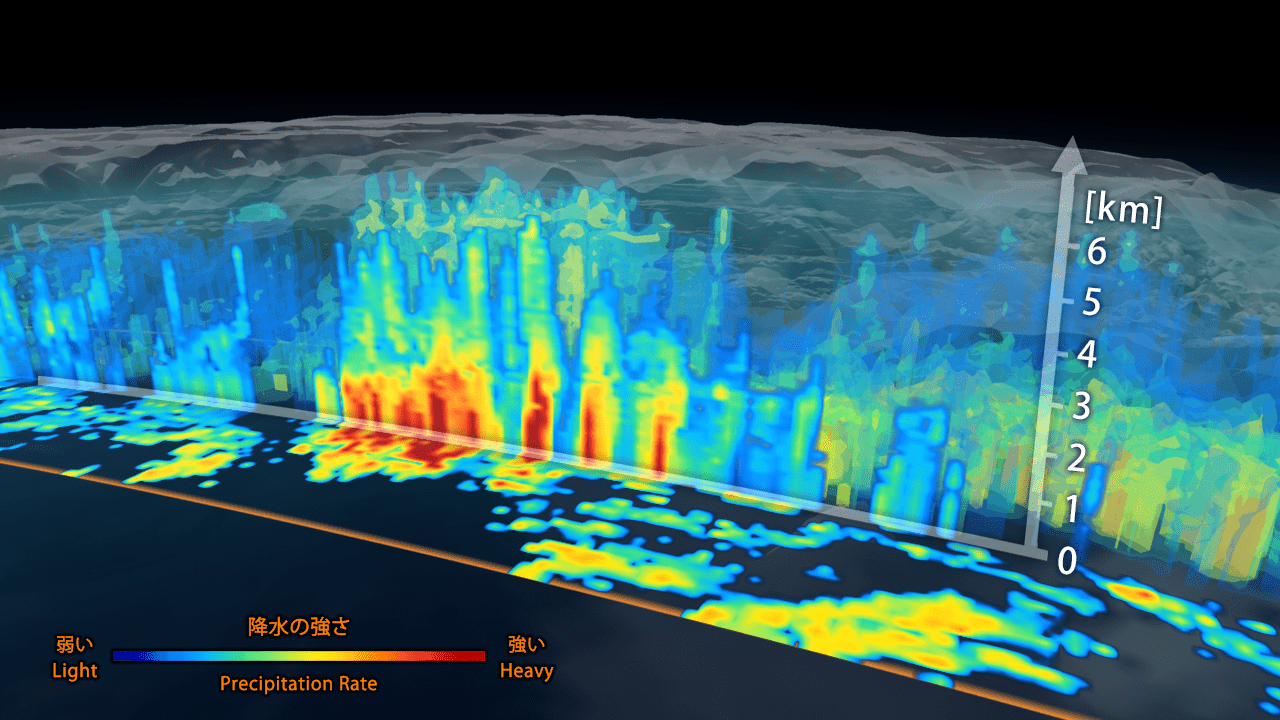
3D view inside an extra-tropical cyclone observed off the coast of Japan, March 10, 2014, by GPM’s Dual-frequency Precipitation Radar. The vertical cross-section approx. 4.4 mi (7 km) high show rain rates: red areas indicate heavy rainfall while yellow and blue indicate less intense rainfall. Credit: JAXA/NASA
“It was really exciting to see this high-quality GPM data for the first time,” said GPM project scientist Gail Skofronick-Jackson at NASA’s Goddard Spaceflight Center in Greenbelt, Md., in a NASA statement.
“I knew we had entered a new era in measuring precipitation from space. We now can measure global precipitation of all types, from light drizzle to heavy downpours to falling snow.”
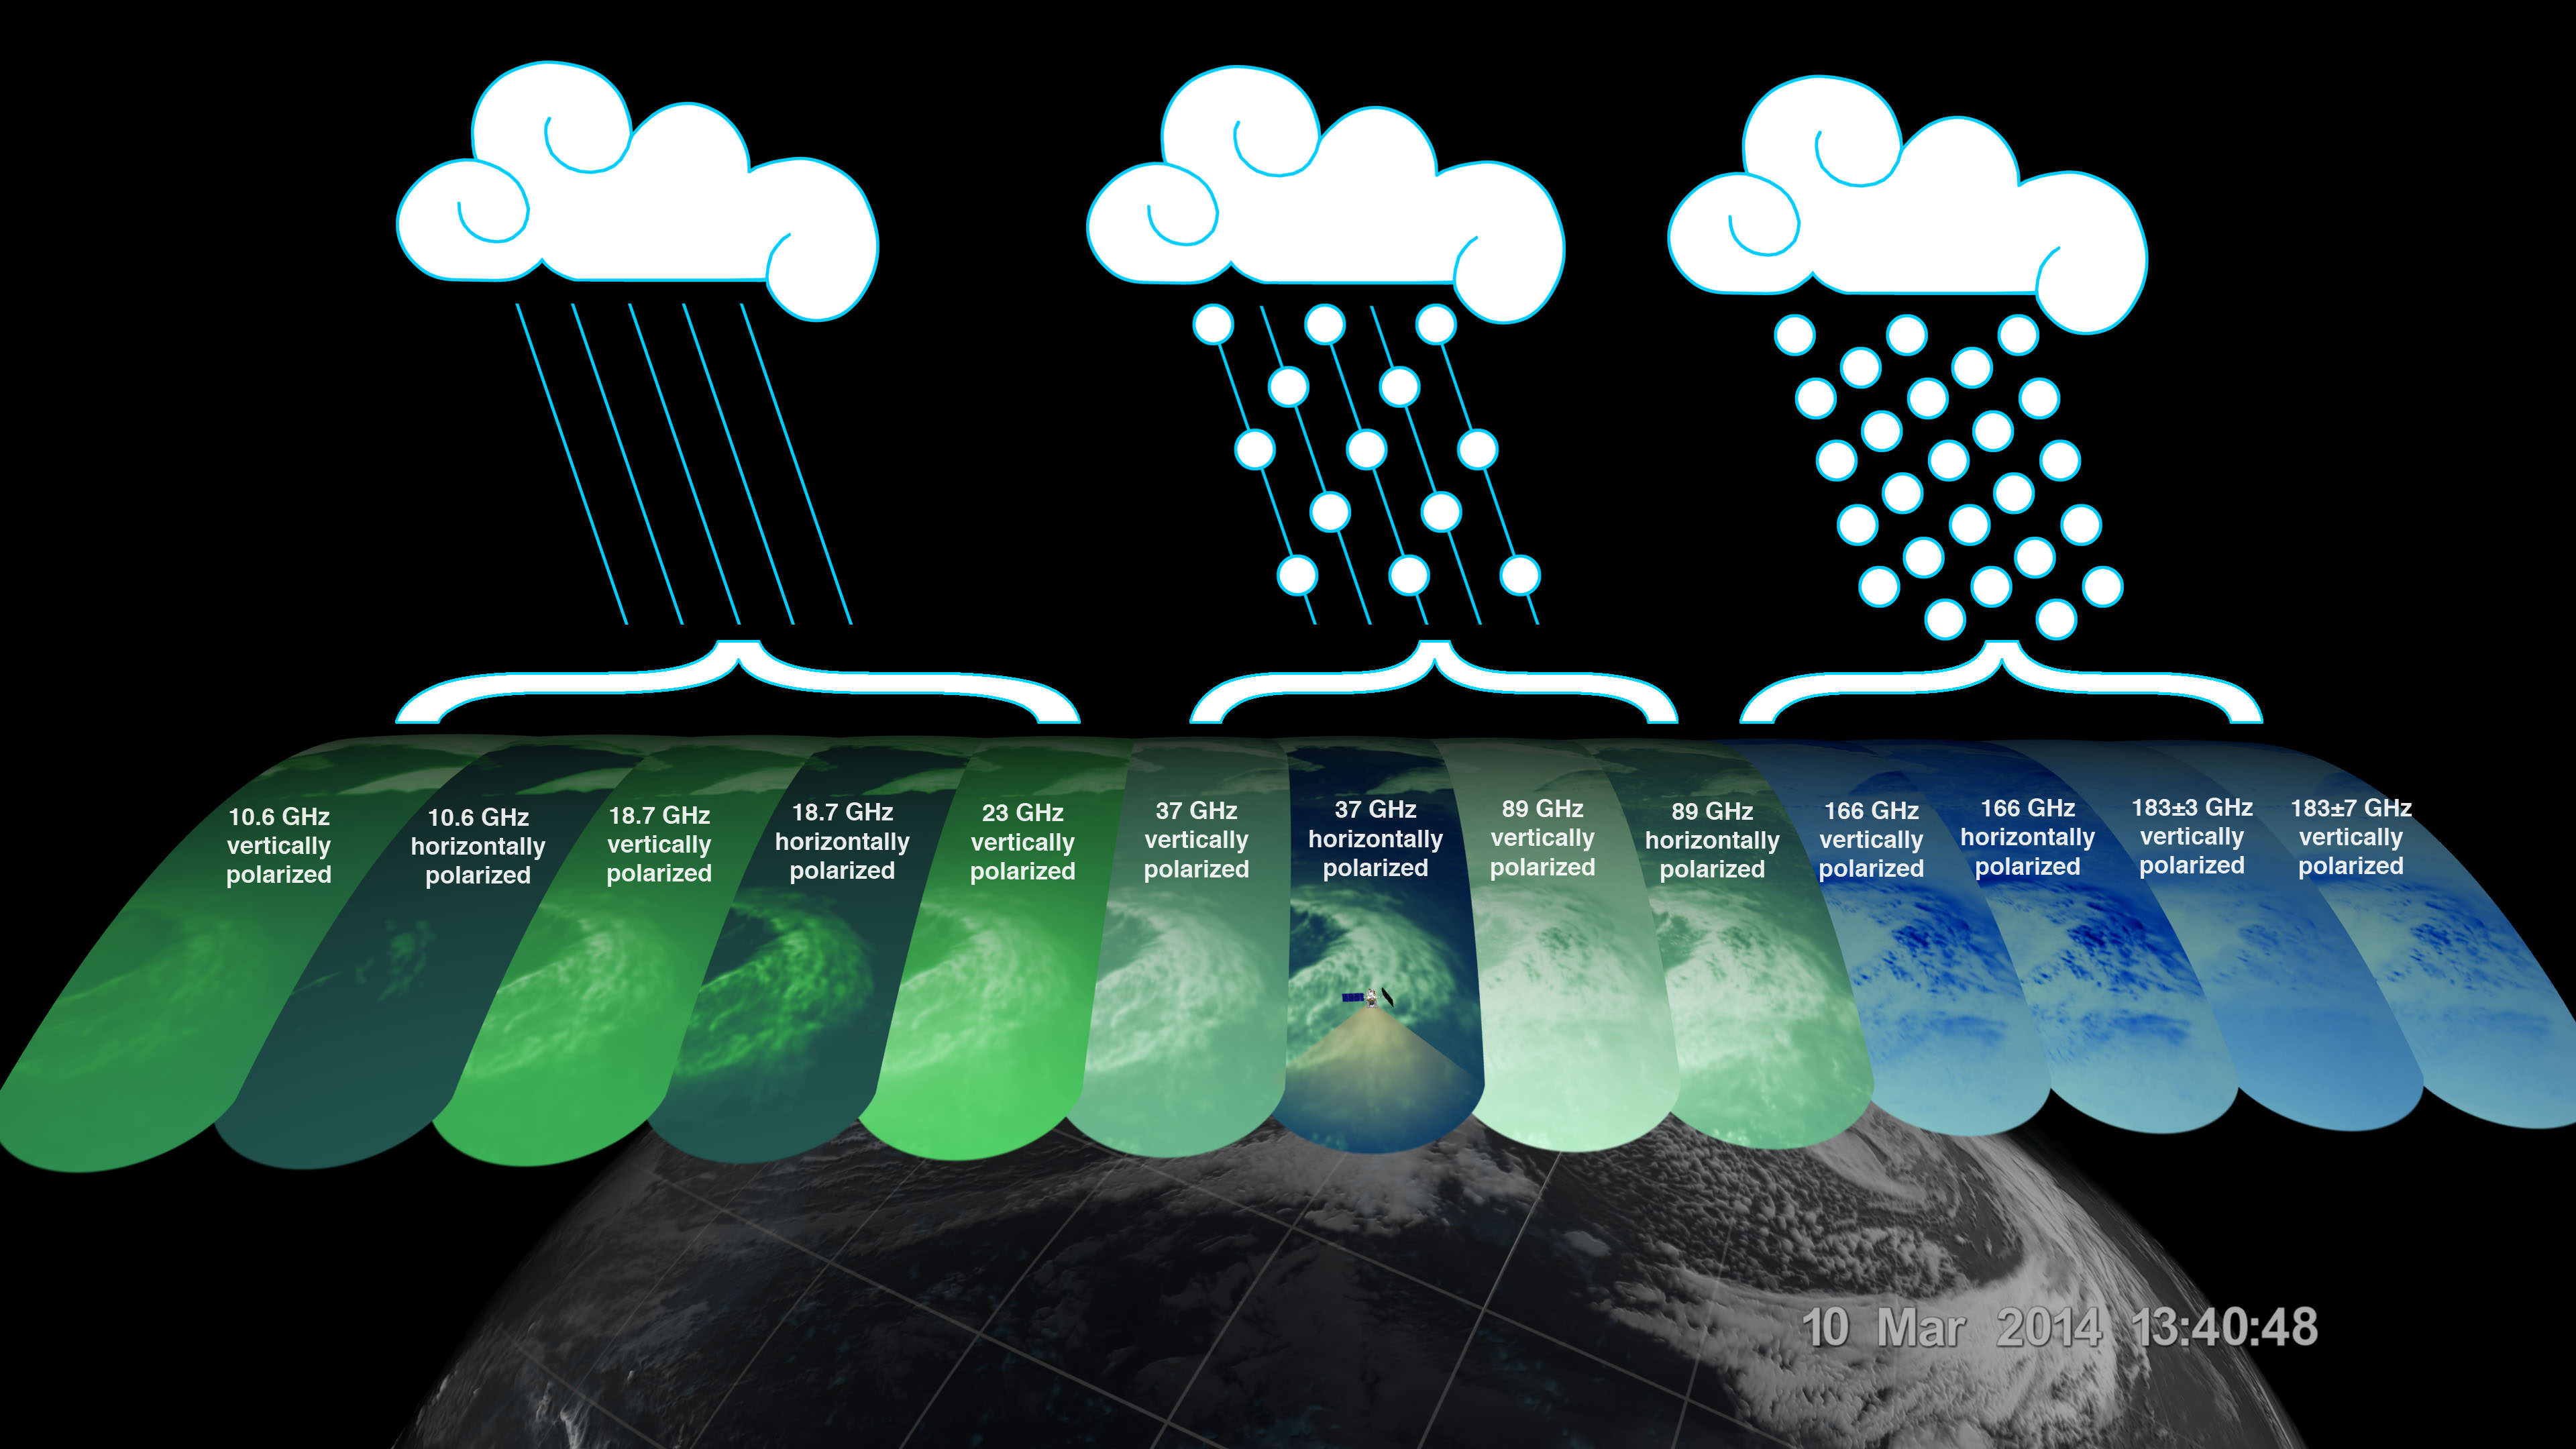
The imagery was derived from measurements gathered by GPM’s two advanced instruments: JAXA’s high resolution dual-frequency precipitation (DPR) radar instrument (Ku and Ka band), which imaged a three-dimensional cross-section of the storm, and the GPM microwave imager (GMI) built by Ball Aerospace in the US which observed precipitation across a broad swath.
“The GMI instrument has 13 channels that measure natural energy radiated by Earth’s surface and also by precipitation itself. Liquid raindrops and ice particles affect the microwave energy differently, so each channel is sensitive to a different precipitation type,” according to a NASA statement.
On March 10, 2014 the Global Precipitation Measurement (GPM) Core Observatory passed over an extra-tropical cyclone about 1,055 miles (1,700 km) east of Japan’s Honshu Island. Formed when a cold air mass wrapped around a warm air mass near Okinawa on March 8, it moved NE drawing cold air over Japan before weakening over the North Pacific. Credit: NASA/JAXA
The 3850 kilogram GPM observatory is the first satellite designed to measure light rainfall and snow from space, in addition to heavy tropical rainfall.
The data were released following check out and activation of the satellites pair of instruments.
“GPM’s precipitation measurements will look like a CAT scan,” Dr. Dalia Kirschbaum, GPM research scientist, told me during a prelaunch interview with the GPM satellite in the cleanroom at NASA’s Goddard Space Flight Center in Greenbelt, Md.
“The radar can scan through clouds to create a three dimensional view of a clouds structure and evolution.”
The $933 Million GPM observatory will provide high resolution global measurements of rain and snow every 3 hours. It is a joint venture between NASA and JAXA.
It will collect a treasure trove of data enabling the most comprehensive measurements ever of global precipitation – and across a wide swath of the planet where virtually all of humanity lives from 65 N to 65 S latitudes.
The GMI instrument has 13 channels, each sensitive to different types of precipitation. Channels for heavy rain, mixed rain and snow, and snowfall are displayed of the extra-tropical cyclone observed March 10, off the coast of Japan. Multiple channels capture the full range of precipitation. Credit: NASA/JAXA
GPM orbits at an altitude of 253 miles (407 kilometers) above Earth – quite similar to the International Space Station (ISS).
GPM is the lead observatory of a constellation of nine highly advanced Earth orbiting weather research satellites contributed by the US, Japan, Europe and India.
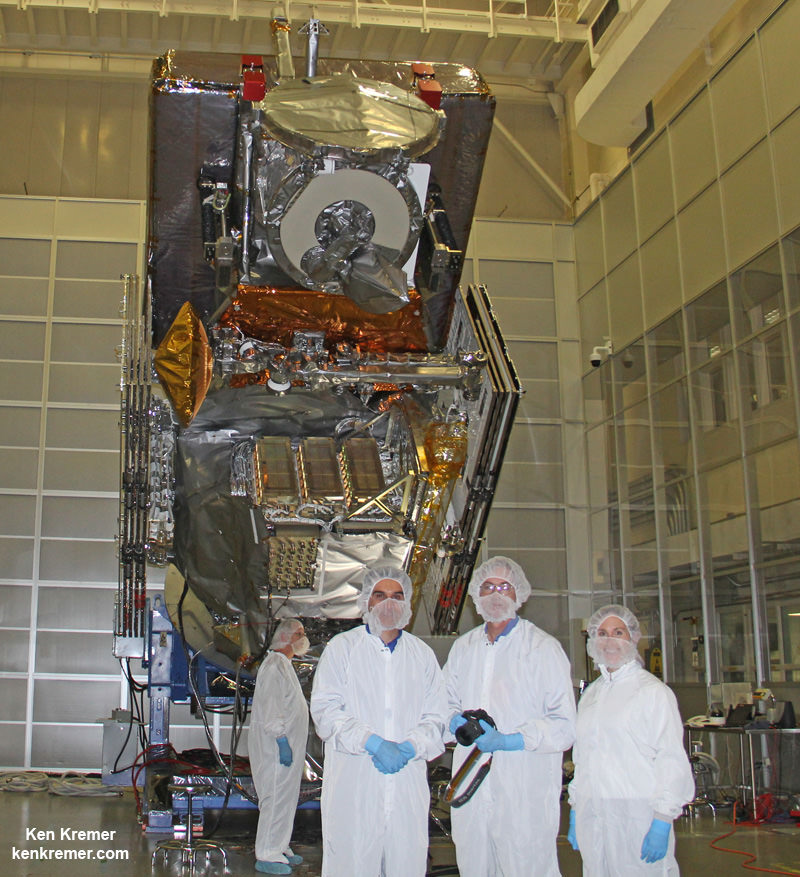
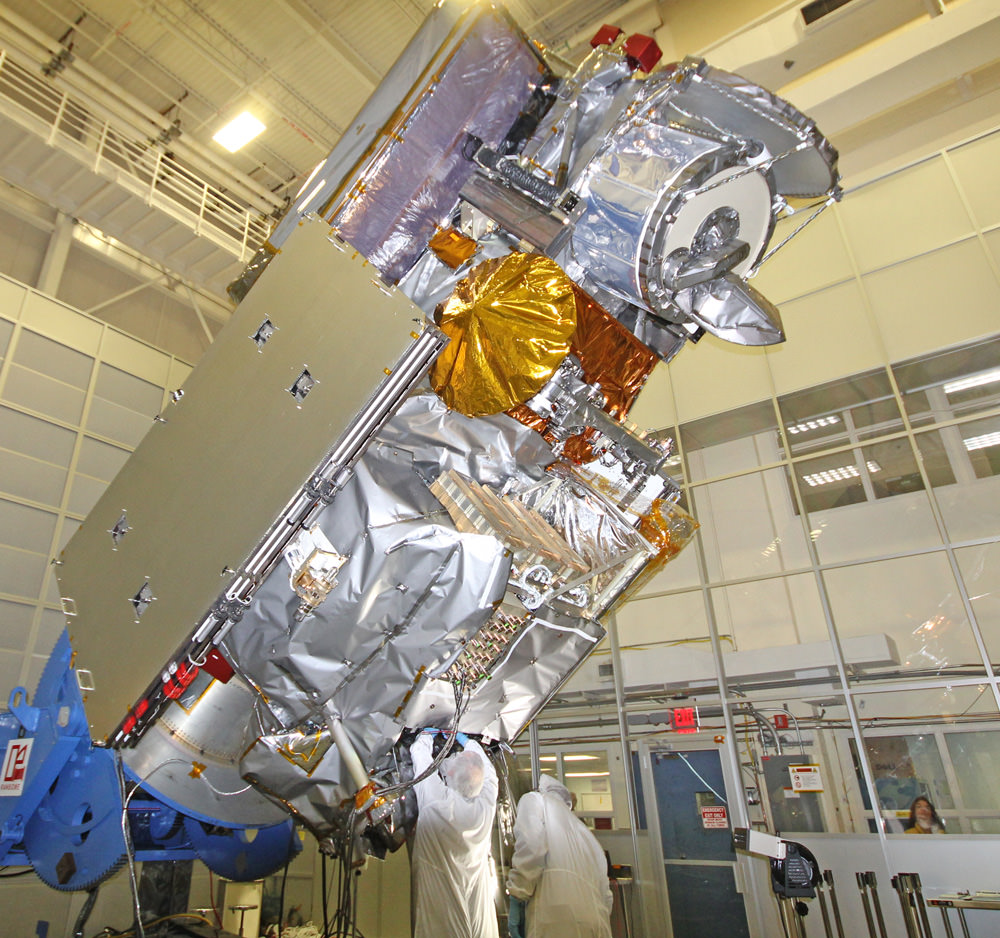
NASA’s next generation Global Precipitation Measurement (GPM) observatory inside the clean room at NASA Goddard Space Flight Center, MD. Technicians at work on final processing during exclusive up-close inspection tour by Universe Today. GPM launched on February 27, 2014 and will provide global measurements of rain and snow every 3 hours. Credit: Ken Kremer/kenkremer.com
Stay tuned here for Ken’s continuing GPM, Curiosity, Opportunity, Chang’e-3, SpaceX, Orbital Sciences, LADEE, MAVEN, MOM, Mars and more planetary and human spaceflight news.
Learn more at Ken’s upcoming presentations at the NEAF convention on April 12/13 and at Washington Crossing State Park, NJ on April 6. Also at the Quality Inn Kennedy Space Center, Titusville, FL, March 29.
GPM Launch Seen From the Tanegashima Space Center. A Japanese H-IIA rocket with the NASA-Japan Aerospace Exploration Agency (JAXA), Global Precipitation Measurement (GPM) Core Observatory onboard, is seen launching from the Tanegashima Space Center on Friday, Feb. 28, 2014 (Japan Time), in Tanegashima, Japan; Thursday, Feb. 27, EST.. Credit: NASA/Bill Ingalls
GPM Launch Seen From the Tanegashima Space Center
A Japanese H-IIA rocket with the NASA-Japan Aerospace Exploration Agency (JAXA), Global Precipitation Measurement (GPM) Core Observatory onboard, is seen launching from the Tanegashima Space Center on Friday, Feb. 28, 2014 (Japan Time), in Tanegashima, Japan; Thursday, Feb. 27, EST. Credit: NASA/Bill Ingalls[/caption]
NASA GODDARD SPACE FLIGHT CENTER, MARYLAND – A powerful, next generation weather observatory aimed at gathering unprecedented 3-D measurements of global rain and snowfall rates – and jointly developed by the US and Japan – thundered to orbit today (Feb. 27 EST, Feb. 28 JST) ) during a spectacular night time blastoff from a Japanese space port.
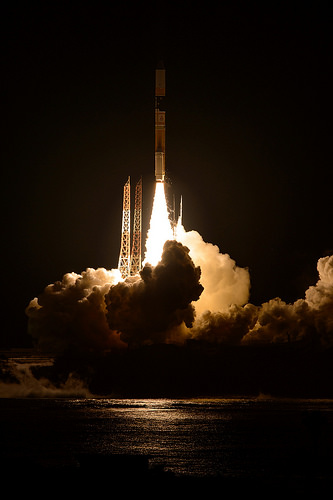
The Global Precipitation Measurement (GPM) Core Observatory was launched precisely on time at 1:37 p.m. EST, 1837 GMT, Thursday, Feb. 27 (3:37 a.m. JST Friday, Feb. 28) atop a Mitsubishi Heavy Industries H-IIA rocket from the Tanegashima Space Center on Tanegashima Island off southern Japan.
Viewers could watch the spectacular liftoff live on NASA TV – which was streamed here at Universe Today.
“GPM’s precipitation measurements will look like a CAT scan,” Dr. Dalia Kirschbaum, GPM research scientist, told me during a prelaunch interview with the GPM satellite in the cleanroom at NASA’s Goddard Space Flight Center in Greenbelt, Md.
“The radar can scan through clouds to create a three dimensional view of a clouds structure and evolution.”
GPM lifts off on Feb. 27, EST (Feb. 28, JST) to begin its Earth-observing mission. Credit: NASA/Bill Ingalls
GPM is the lead observatory of a constellation of nine highly advanced Earth orbiting weather research satellites contributed by the US, Japan, Europe and India.
Indeed GPM will be the first satellite to measure light rainfall and snow, in addition to heavy tropical rainfall.
It will collect a treasure trove of data enabling the most comprehensive measurements ever of global precipitation every three hours – and across a wide swath of the planet where virtually all of humanity lives from 65 N to 65 S latitudes.
GPM orbits at an altitude of 253 miles (407 kilometers) above Earth – quite similar to the International Space Station (ISS).
The global precipitation data will be made freely available to climate researchers and weather forecasters worldwide in near real time – something long awaited and not possible until now.
Water and the associated water and energy cycles are the basis of all life on Earth.
Yet scientists lack a clear and comprehensive understanding of key rain and snow fall amounts on most of the globe – which is at the heart of humanity’s existence and future well being on the home planet.
Having an accurate catalog of the water and energy cycles will direct benefit society and impact people’s lives on a daily basis with improved weather forecasts, more advanced warnings of extreme weather conditions, aid farmers, help identify and determine the effects of global climate change.
Researchers will use the GPM measurements to study climate change, freshwater resources, floods and droughts, and hurricane formation and tracking.
“With this launch, we have taken another giant leap in providing the world with an unprecedented picture of our planet’s rain and snow,” said NASA Administrator Charles Bolden, in a NASA statement.
“GPM will help us better understand our ever-changing climate, improve forecasts of extreme weather events like floods, and assist decision makers around the world to better manage water resources.”
“The GPM spacecraft has been under development for a dozen years,” said GPM Project Manager Art Azarbarzin of NASA’s Goddard Space Flight Center in Greenbelt, Md., in a prelaunch interview with Universe Today conducted inside the clean room with GPM before it’s shipment to Japan.
NASA’s next generation Global Precipitation Measurement (GPM) observatory inside the clean room at NASA Goddard Space Flight Center, MD. Technicians at work on final processing during exclusive up-close inspection tour by Universe Today. GPM is slated to launch on February 27, 2014 and will provide global measurements of rain and snow every 3 hours. Credit: Ken Kremer/kenkremer.com
“The GPM satellite was built in house by the dedicated team at NASA’s Goddard Space Flight Center in Maryland,” Azarbarzin told me.
“It’s the largest satellite ever built at Goddard.”
Following the flawless blastoff, the nearly four ton GPM spacecraft separated from the Japanese rocket some 16 minutes later at an altitude of 247 miles (398 kilometers).
10 minutes later both of the spacecrafts life giving solar arrays deployed as planned.
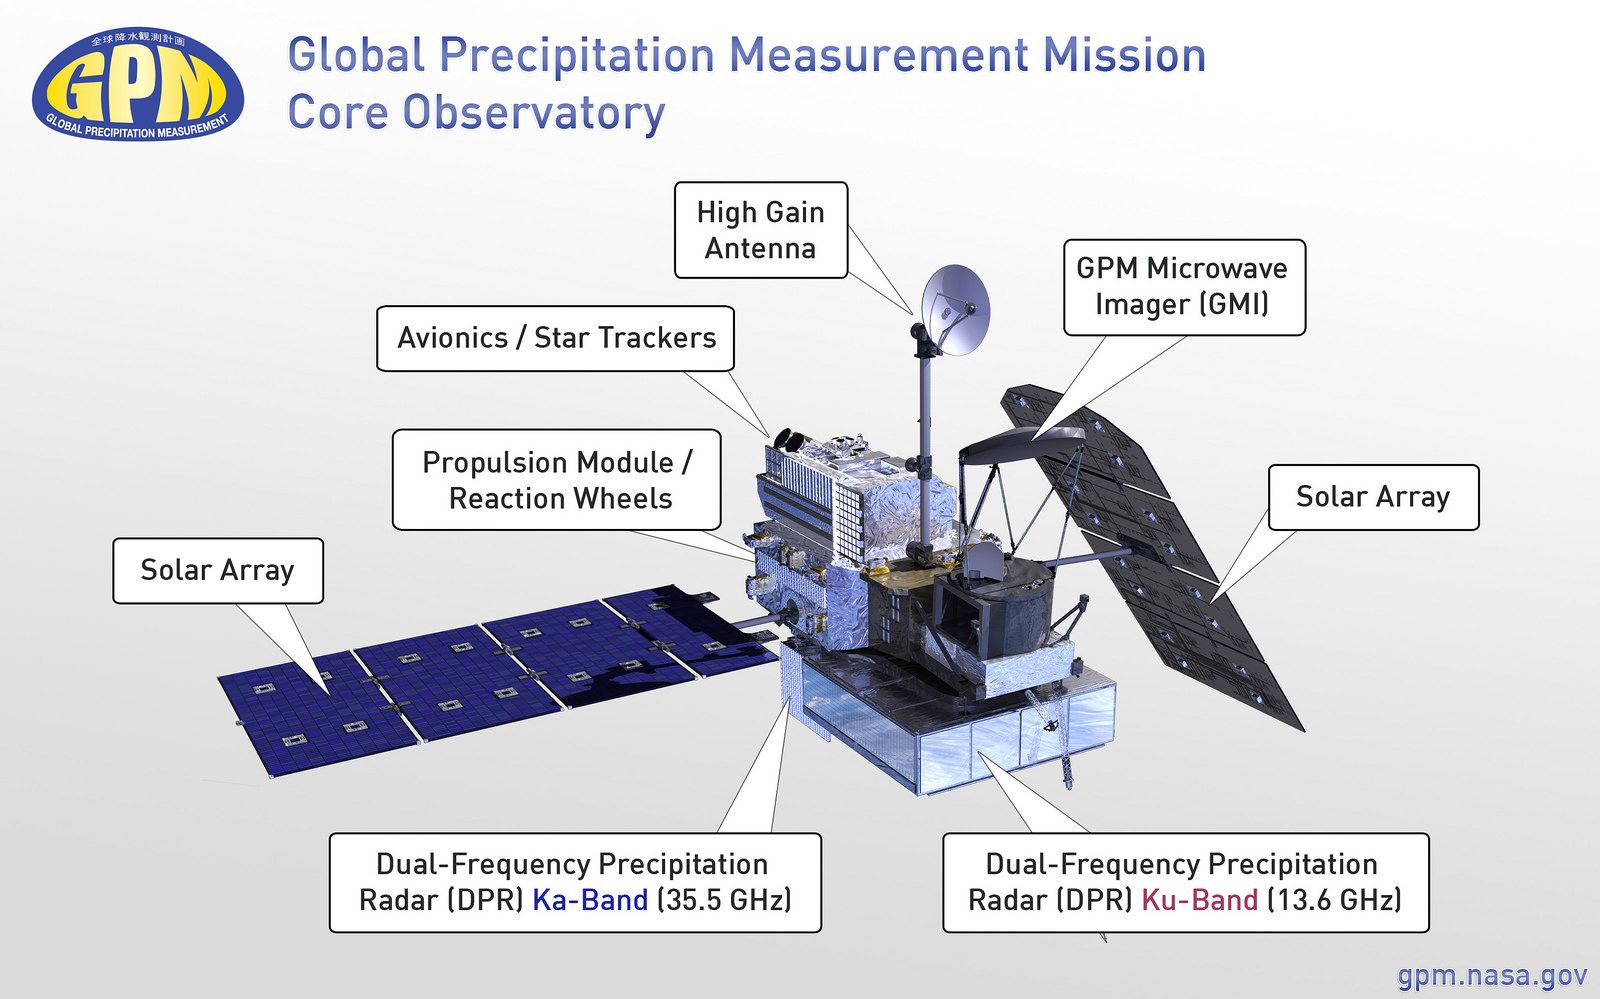
Major components of the GPM Core Observatory labeled, including the GMI, DPR, HGAS, solar panels, and more. Credit: NASA Goddard
“It is incredibly exciting to see this spacecraft launch,” said Azarbarzin, in a NASA statement. He witnessed the launch in Japan.
“This is the moment that the GPM Team has been working toward since 2006.”
“The GPM Core Observatory is the product of a dedicated team at Goddard, JAXA and others worldwide.”
“Soon, as GPM begins to collect precipitation observations, we’ll see these instruments at work providing real-time information for the scientists about the intensification of storms, rainfall in remote areas and so much more.”
The $933 Million observatory is a joint venture between the US and Japanese space agencies, NASA and the Japan Aerospace Exploration Agency (JAXA).
The 3850 kilogram GPM satellite is equipped with two instruments – an advanced, higher resolution dual -frequency precipitation (DPR) radar instrument (Ku and Ka band) built by JAXA in Japan and the GPM microwave imager (GMI) built by Ball Aerospace in the US.
The GPM observatory will replace the aging NASA/JAXA Tropical Rainfall Measuring Mission (TRMM) satellite launched back in 1997 and also jointly developed by NASA and JAXA.
“GPM is the direct follow-up to the currently orbiting TRMM satellite,” Azarbarzin explained to me.
“TRMM is reaching the end of its usable lifetime. After GPM launches we hope it has some overlap with observations from TRMM.”
GPM is vital to continuing the TRMM measurements. It will help provide improved forecasts and advance warning of extreme super storms like Hurricane Sandy and Super Typhoon Haiyan.
“TRMM was only designed to last three years but is still operating today. We hope GPM has a similar long life,” said Azarbarzin.
NASA astronaut Paul Richards (STS-102) discusses GPM at NASA Goddard Space Flight Center on Feb. 27, 2014. Credit: Ken Kremer/kenkremer.com
Stay tuned here for Ken’s continuing GPM reports and on-site coverage at NASA Goddard Space Flight Center in Maryland.
And watch for Ken’s continuing planetary and human spaceflight news about Curiosity, Opportunity, Chang’e-3, SpaceX, Orbital Sciences, LADEE, MAVEN, MOM, Mars, Orion and more.
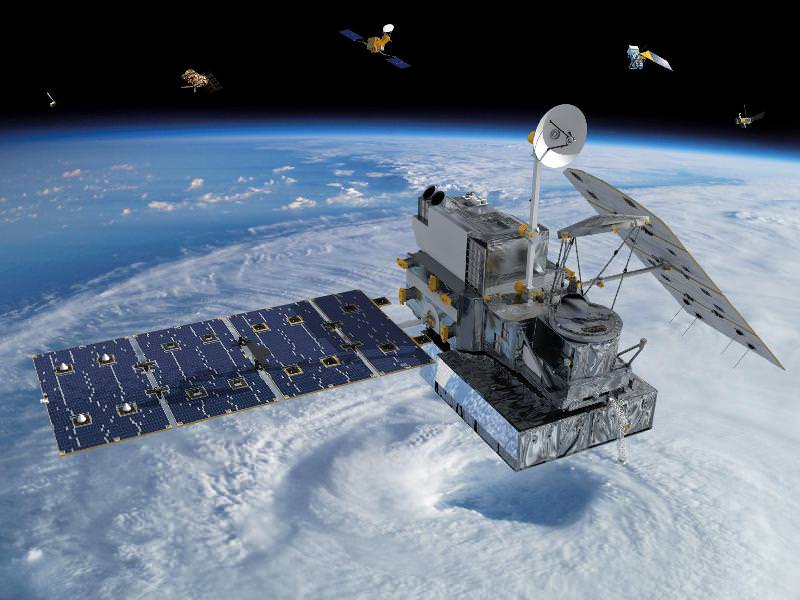
Visualization of the GPM Core Observatory and Partner Satellites. GPM launched on Feb. 27 from Japan. Credit: NASANASA/JAXA Global Precipitation Measurement (GPM) satellite inside the clean room at NASA Goddard Space Flight Center, MD, undergoes final processing during exclusive up-close inspection tour by Universe Today: Dr. Art Azarbarzin/NASA GPM project manager, Dr. Ken Kremer/Universe Today and Dr. Dalia Kirschbaum/NASA GPM research scientist. Credit: Ken Kremer/kenkremer.com
Visualization of the GPM Core Observatory and Partner Satellites. Credit: NASA
Visualization of the GPM Core Observatory and Partner Satellites. GPM is slated to launch on Feb. 27 from Japan. Credit: NASA
See launch animation, Shinto ceremony, Rocket roll out and more below[/caption]
NASA GODDARD SPACE FLIGHT CENTER, MARYLAND – Blastoff of the powerful and revolutionary new NASA/JAXA rain and snow precipitation measurement satellite atop a Japanese rocket from a tiny offshore island launch pad is now less than 24 hours away on Thursday, Feb. 27, EST (Feb. 28 JST).
The Global Precipitation Measurement (GPM) Core Observatory aimed at improving forecasts of extreme weather and climate change research has been given a green light for launch atop a Mitsubishi Heavy Industries H-IIA rocket from the Tanegashima Space Center on Tanegashima Island off southern Japan.
Roll out of the H-IIA launch vehicle from the Vehicle Assembly Building is scheduled for this evening, Feb. 26 at 11 p.m. EST.
Update: rocket rolled out. Photo below, plus watch streaming NASA TV below.
Following the Launch Readiness Review, mission managers approved the GO for liftoff.
The H-IIA rocket with GPM rolls to its launch pad in Japan! Credit: NASA/Bill Ingalls
Japanese team members also prayed at a Shinto ceremony for blessings for a successful launch at the Ebisu Shrine, the first shrine in a traditional San-ja Mairi, or Three Shrine Pilgrimage on Tuesday, Feb. 25, 2014 – see photo below.
However, the team also set a newly revised launch time of 1:37 p.m. EST (18:37 UTC, and Feb. 28 at 3:37 a.m. JST).
Mission managers adjusted the H-IIA launch time after concerns raised by a collision avoidance analysis between the GPM spacecraft and the International Space Station (ISS).
GPM will fly at an altitude of 253 miles (407 kilometers) above Earth – quite similar to the ISS.
It’s coverage runs over virtually the entire populated globe from 65 N to 65 S latitudes.
NASA plans live coverage of the launch on Feb. 27 beginning at 12 noon EST on NASA Television.
It will be streamed live at: http://www.nasa.gov/nasatv
The $933 Million observatory is a joint venture between the US and Japanese space agencies, NASA and the Japan Aerospace Exploration Agency (JAXA).
NASA’s next generation Global Precipitation Measurement (GPM) observatory inside the clean room at NASA Goddard Space Flight Center, MD. Technicians at work on final processing during exclusive up-close inspection tour by Universe Today. GPM is slated to launch on February 27, 2014 and will provide global measurements of rain and snow every 3 hours. Credit: Ken Kremer/kenkremer.com
GPM has a one-hour launch window. In case of any delays, the team will be required to conduct a thorough new collision avoidance analysis to ensure safety.
Weather forecast is excellent at this time.
Watch this GPM Launch animation:
Video caption: NASA/JAXA GPM Core Observatory Launch Animation
GPM is a next-generation satellite that will provide global, near real time observations of rain and snow from space. Such data is long awaited by climate scientists and weather forecasters.
It will open a new revolutionary era in global weather observing and climate science. Therefore it will have a direct impact on society and people’s daily lives worldwide.
The mission will significantly advance our understanding of Earth’s water and energy cycles and improve forecasting of extreme weather events.
The 3850 kilogram GPM satellite is equipped with two instruments – an advanced, higher resolution dual -frequency precipitation (DPR) radar instrument (Ku and Ka band) built by JAXA in Japan and the GPM microwave imager (GMI) built by Ball Aerospace in the US.
Major components of the GPM Core Observatory labeled, including the GMI, DPR, HGAS, solar panels, and more. Credit: NASA Goddard
“The GPM satellite was built in house at NASA’s Goddard Space Flight Center in Maryland,” Art Azarbarzin, GPM project manager, told Universe Today during my exclusive up-close clean room inspection tour of the huge satellite as final processing was underway.
Researchers will use the GPM measurements to study climate change, freshwater resources, floods and droughts, and hurricane formation and tracking.
“GPM will join a worldwide constellation of current and planned satellites,” Azarbarzin told me during an interview in the Goddard cleanroom beside GPM.
“GPM is the direct follow-up to the currently orbiting TRMM satellite,” Azarbarzin explained.
“TRMM is reaching the end of its usable lifetime. After GPM launches we hope it has some overlap with observations from TRMM.”
“The Global Precipitation Measurement (GPM) observatory will provide high resolution global measurements of rain and snow every 3 hours,” Dalia Kirschbaum, GPM research scientist, told me during an interview at Goddard.
Stay tuned here for Ken’s continuing GPM reports and on-site coverage at NASA Goddard Space Flight Center in Maryland.
And watch for Ken’s continuing planetary and human spaceflight news about Curiosity, Opportunity, Chang’e-3, SpaceX, Orbital Sciences, LADEE, MAVEN, MOM, Mars, Orion and more.
GPM: Three Shrine Pilgrimage Japan Aerospace Exploration Agency (JAXA) team members bow at the Ebisu Shrine, the first shrine in a traditional San-ja Mairi, or Three Shrine Pilgrimage, where the team prays on Tuesday, Feb. 25, 2014 for a successful launch, Tanegashima Island, Japan. Credit: NASA/Bill IngallsNASA/JAXA Global Precipitation Measurement (GPM) satellite inside the clean room at NASA Goddard Space Flight Center, MD, undergoes final processing during exclusive up-close inspection tour by Universe Today: Dr. Art Azarbarzin/NASA GPM project manager, Dr. Ken Kremer/Universe Today and Dr. Dalia Kirschbaum/NASA GPM research scientist. Credit: Ken Kremer/kenkremer.com
NASA’s next generation Global Precipitation Measurement (GPM) observatory inside the clean room at NASA Goddard Space Flight Center, MD. Technicians at work on final processing during exclusive up-close inspection tour by Universe Today. GPM is slated to launch on February 27, 2014 and will provide global measurements of rain and snow every 3 hours. Credit: Ken Kremer/kenkremer.com
NASA GODDARD SPACE FLIGHT CENTER, MARYLAND – Weather researchers and forecasters worldwide are gushing with excitement in the final days leading to blastoff of the powerful, new Global Precipitation Measurement (GPM) Core Observatory – built by NASA in a joint effort with Japan.
GPM is a next-generation satellite that will provide global, near real time observations of rain and snow from space and thereby open a new revolutionary era in global weather observing and climate science. Therefore it will have a direct impact on society and people’s daily lives worldwide.
The team is counting down to liftoff in less than 5 days, on Feb. 27 at 1:07 PM EST from the Tanegashima Space Center, on Tanegashima Island off southern Japan, atop the highly reliable Mitsubishi Heavy Industries H-IIA rocket.
The GPM launch to low Earth orbit was delayed by both natural and manmade disasters – namely the 2011 Fukushima earthquake in Japan as well as the ridiculous US government shutdown in Oct. 2013. That’s the same foolish shutdown that also delayed NASA’s new MAVEN Mars orbiter and numerous other US space & science projects.
Visualization of the GPM Core Observatory satellite orbiting the planet earth. Credit: NASA Goddard
The $933 Million mission is a joint venture between NASA and the Japan Aerospace Exploration Agency (JAXA), Japan’s space agency.
The mission will significantly advance our understanding of Earth’s water and energy cycles and improve forecasting of extreme weather events.
It is equipped with an advanced, higher resolution dual -frequency precipitation (DPR) radar instrument (Ku and Ka band) built by JAXA in Japan and the GPM microwave imager (GMI) built by Ball Aerospace in the US.
“The GPM satellite was built in house at NASA’s Goddard Space Flight Center in Maryland,” Art Azarbarzin, GPM project manager, told Universe Today during my exclusive up-close clean room inspection tour of the huge satellite as final processing was underway.
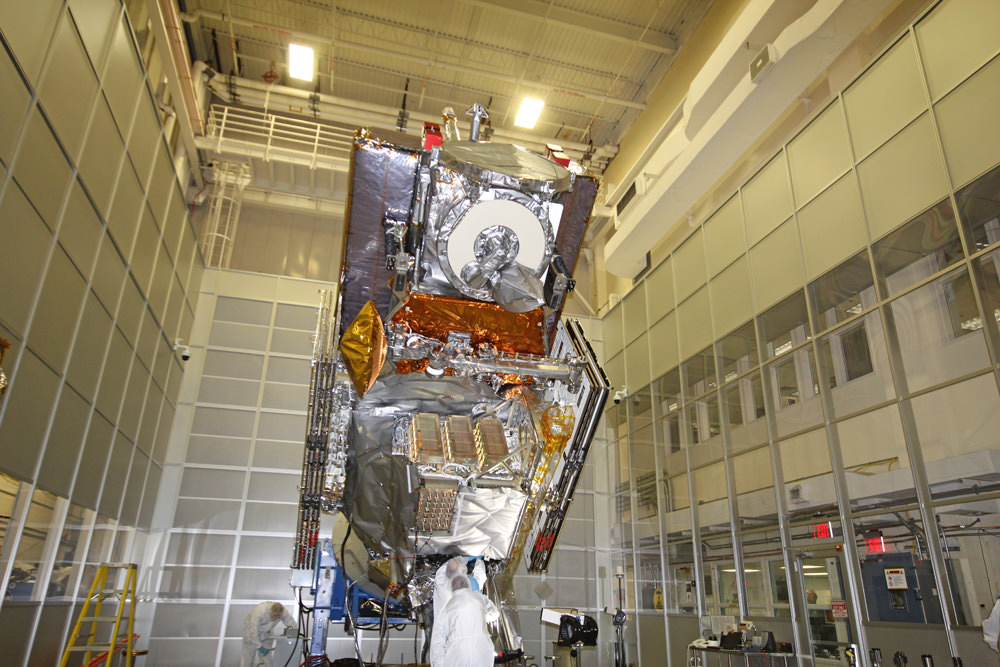
Global Precipitation Measurement (GPM) observatory satellite inside the clean room at NASA Goddard Space Flight Center undergoes final processing – side view. Credit: Ken Kremer/kenkremer.com
Shortly after my tour of GPM, the 3850 kilogram satellite was carefully packed up for shipment to the Japanese launch site.
“GPM will join a worldwide constellation of current and planned satellites,” Azarbarzin told me during an interview in the Goddard cleanroom with GPM.
And the imminent launch to augment the existing satellite constellation can’t come soon enough, he noted.
The GPM observatory will replace the aging NASA/JAXA Tropical Rainfall Measuring Mission (TRMM), satellite launched back in 1997.
“GPM is the direct follow-up to the currently orbiting TRMM satellite,” Azarbarzin explained.
“TRMM is reaching the end of its usable lifetime. GPM launches on February 27, 2014 and we hope it has some overlap with observations from TRMM.”
“The Global Precipitation Measurement (GPM) observatory will provide high resolution global measurements of rain and snow every 3 hours,” Dalia Kirschbaum, GPM research scientist, told me during an interview at Goddard.
NASA’s next generation Global Precipitation Measurement (GPM) observatory inside the clean room at NASA Goddard Space Flight Center, MD. Technicians at work on final processing during exclusive up-close inspection tour by Universe Today. GPM is slated to launch on February 27, 2014 and will provide global measurements of rain and snow every 3 hours. Credit: Ken Kremer/kenkremer.com
It is vital to continuing the TRMM measurements and will help provide improved forecasts and advance warning of extreme super storms like Hurricane Sandy and Super Typhoon Haiyan, Azarbarzin and Kirschbaum explained.
Researchers will use the GPM measurements to study climate change, freshwater resources, floods and droughts, and hurricane formation and tracking.
“The water-cycle, so familiar to all school-age young scientists, is one of the most interesting, dynamic, and important elements in our studies of the Earth’s weather and climate,” said John Grunsfeld, associate administrator for NASA’s Science Mission Directorate in Washington, in a statement.
“GPM will provide scientists and forecasters critical information to help us understand and cope with future extreme weather events and fresh water resources.”
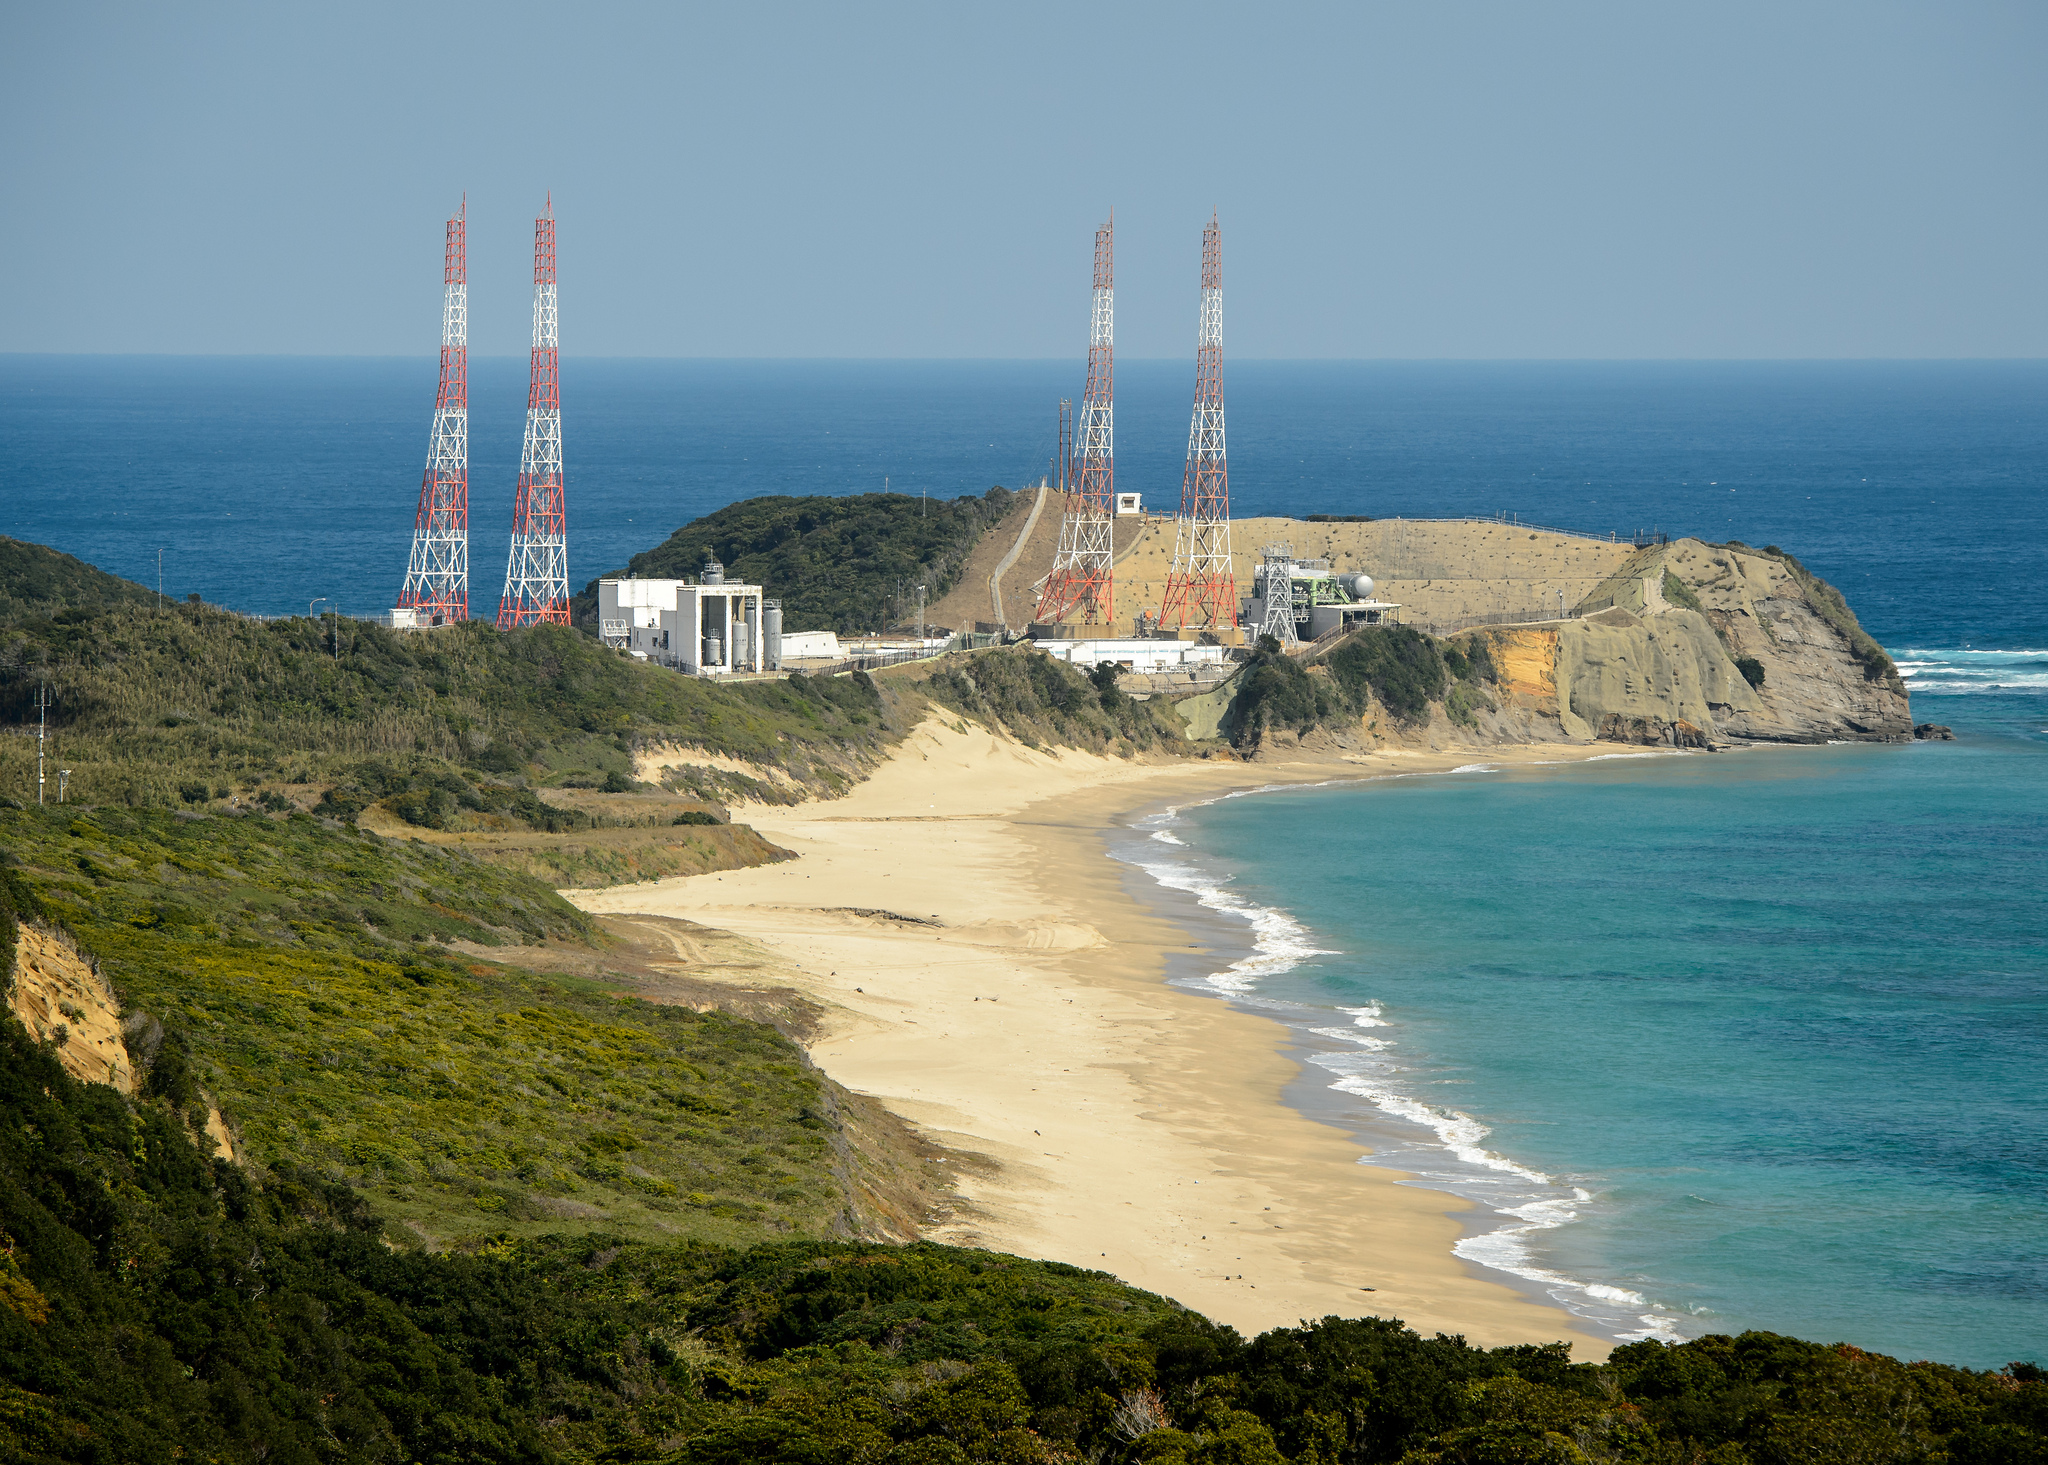
GPM satellite launch site at Tanegashima Space Center, Tanegashima Island, Japan. Credit: NASA
NASA TV will carry the launch live with commentary starting at 12 Noon EST on Feb. 27.
Stay tuned here for Ken’s continuing GPM reports and onsite coverage at NASA Goddard Space Flight Center in Maryland.
And watch for Ken’s continuing planetary and human spaceflight news about Curiosity, Opportunity, Chang’e-3, SpaceX, Orbital Sciences, LADEE, MAVEN, MOM, Mars, Orion and more.
NASA/JAXA Global Precipitation Measurement (GPM) satellite inside the clean room at NASA Goddard Space Flight Center, MD, undergoes final processing during exclusive up-close inspection tour by Universe Today: Dr. Art Azarbarzin/NASA GPM project manager, Dr. Ken Kremer/Universe Today and Dr. Dalia Kirschbaum/NASA GPM research scientist. Credit: Ken Kremer/kenkremer.com