Antarctic Sea Ice Takes Over More Of The Ocean Than Ever Before

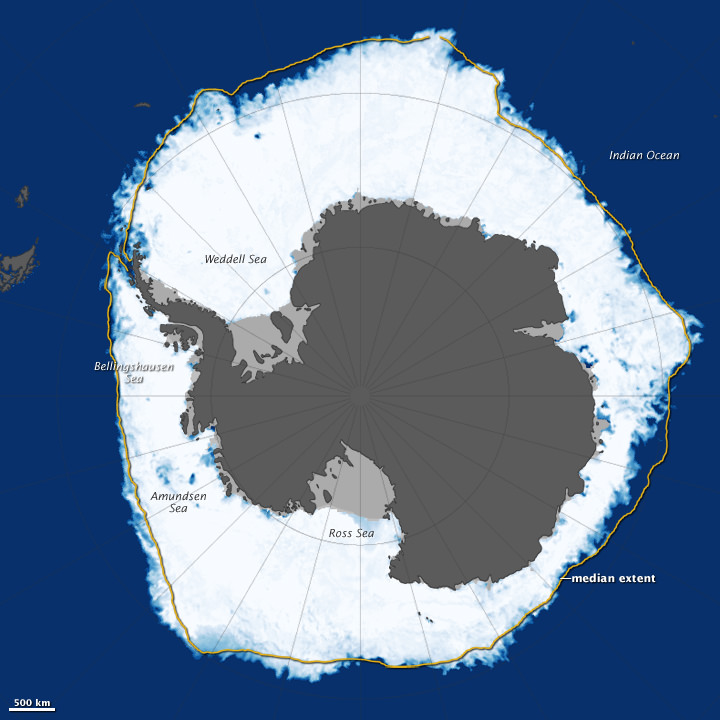
Antarctica's sea ice on Sept. 22, 2013. Scientists say there was more ice on the ocean then than in any time in recorded satellite history. Data came from the Advanced Microwave Scanning Radiometer 2 (AMSR2) sensor on Japan’s Global Change Observation Mission 1st-Water (GCOM-W1) satellite. You can see the land in dark gray and ice shelves in light gray. The yellow line represents the average distribution of sea ice between 1981 and 2000. Credit: NASA/Jesse Allen, using data from the Advanced Microwave Scanning Radiometer 2 (AMSR2) sensor on the Global Change Observation Mission 1st-Water (GCOM-W1) satellite.

Antarctica’s sea ice is creeping further out in the ocean! New data from a Japanese satellite shows that sea ice surrounding the southern continent in late September reached out over 7.51 million square miles (19.47 million square kilometers).

The extent — a slight increase over 2012’s record of 7.50 million square miles (19.44 million square km) — is the largest recorded instance of Antarctica sea ice since satellite records began, NASA said. Data was recorded using the Advanced Microwave Scanning Radiometer 2 (AMSR2) sensor on the Global Change Observation Mission 1st-Water (GCOM-W1) satellite.

“While researchers continue to study the forces driving the growth in sea ice extent, it is well understood that multiple factors—including the geography of Antarctica, the region’s winds, as well as air and ocean temperatures—all affect the ice,” NASA stated.

Update — see below for a more detailed description of why this is an important clue that climate change IS happening.

“Geography and winds are thought to be especially important. Unlike the Arctic, where sea ice is confined in a basin, Antarctica is a continent surrounded by open ocean. Since its sea ice is unconfined, it is particularly sensitive to changes in the winds. As noted by the National Snow and Ice Data Center, some research has suggested that changes in Antarctic sea ice are caused in part by a strengthening of the westerly winds that flow unhindered in a circle above the Southern Ocean.”

For those thinking that increased sea ice means we can relax about climate change, this humorous video explains the difference between land ice (glaciers) and sea ice (which is generated from snow, rainfall and fresh water). It’s definitely worth four minutes of your time. The part about sea ice starts around 2:45.

UPDATE: Just to clarify:

Here’s what the graphic says: “The water around Antarctica is more fresh than it has been in previous years because of increased snow and rainfall as well as in increased contribution of fresh water from melting land ice. This fresh cold water is less dense than the warmer, saltier water below. Previously, that warm salty water would rise, melting the sea ice. But now, bcaus of the lighter fresh water on top, there is less mixing of the ocean’s layer and the surface stays cooler longer. “

And so, there is increased fresh water because of the melting land ice – due to climate change. There is a fundamental difference between sea ice and land ice. Antarctic land ice is the ice which has accumulated over thousands of years on the Antarctica landmass through snowfall. Antarctic sea ice is entirely different as it is ice which forms in salt water during the winter and almost entirely melts again in the summer.

Importantly, when land ice melts and flows into the oceans global sea levels rise on average; when sea ice melts sea levels do not change measurably but other parts of the climate system are affected, like increased absorption of solar energy by the darker oceans.

See this article on SkepticalScience for additional information.

Source: NASA Earth Observatory

Greenland Glacier Calves Another Huge Ice Island

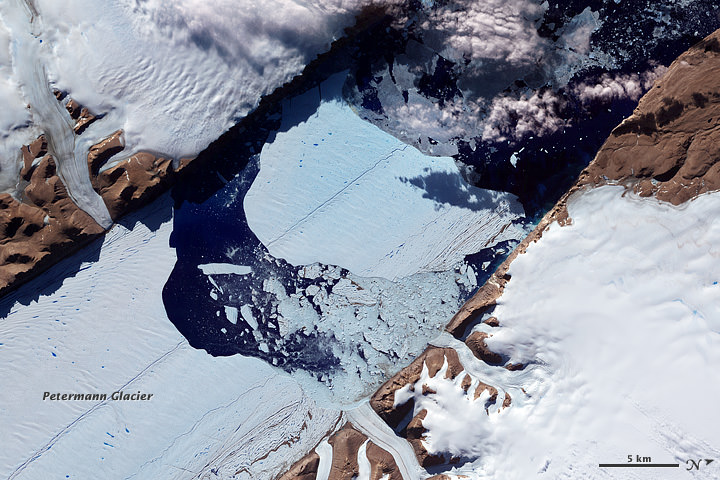
Petermann glacier, a 70 km (43 mile) long tongue of ice that flows into the Arctic Ocean in northwest Greenland, recently calved an “ice island” approximately 130 square kilometers (50 sq. miles) — about twice the area of Manhattan. The image above, acquired by NASA’s Terra satellite, shows the ice island as it drifts toward the ocean five days after breaking off the main glacier.

Petermann glacier has been known for birthing massive ice islands; previously in August 2010 an even larger island broke away from the glacier, measuring 251 square kilometers (97 sq. miles). That slab of ice eventually drifted into the northern Atlantic and was even visible from the Space Station a year later!

Read: Manhattan-Sized Ice Island Seen From Space

Although some of Greenland’s glaciers have been observed to be quickening their seaward pace as a result of global warming, this particular calving event — which occurred along a crack that appeared in 2001 satellite imagery — isn’t thought to be a direct result of climate but rather of ocean currents and isn’t expected to have any significant effect on the rate of Greenland’s ice loss as a whole. Still, satellite observation of such events provides valuable data for researchers monitoring the processes that are involved with rapidly accelerating Arctic ice loss.

And if you want an idea of what a slab of ice this large looks like up close, here’s a video taken by researchers on approach to a smaller chunk of the 2011 island:

NASA Earth Observatory image by Jesse Allen, using data from NASA/GSFC/METI/ERSDAC/JAROS, and U.S./Japan ASTER Science Team. (NASA/Terra)

Scientists Set Their Sights on Arctic Ice Loss

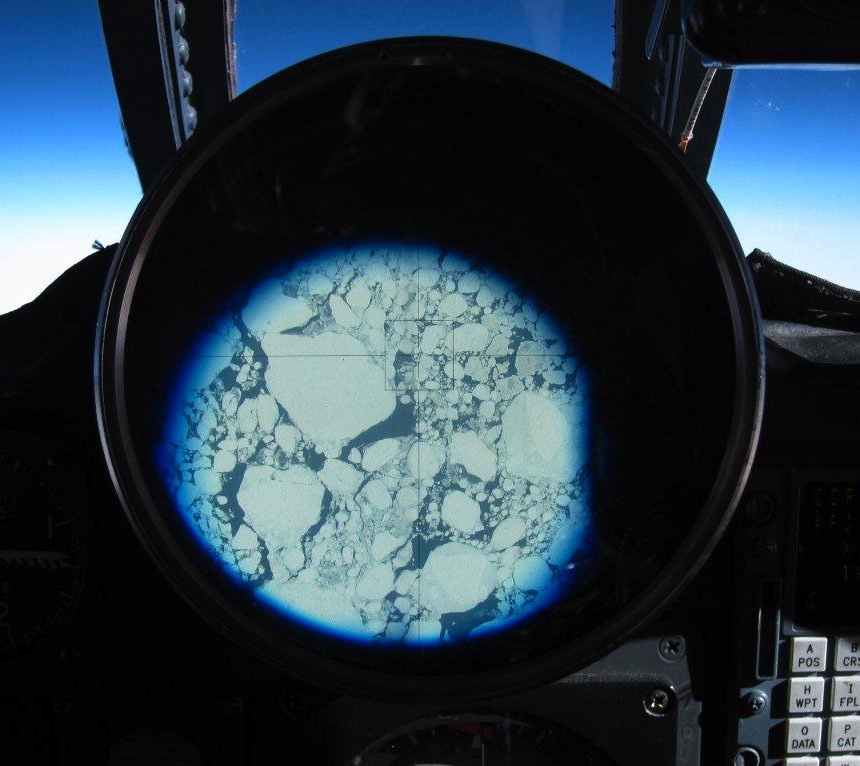
Greenland ice breakup seen from NASA ER-2 cockpit during a MABEL flight (NASA)

[/caption]

NASA researchers have just completed science mission flights over Greenland and the surrounding seas, gathering data on ice distribution and thickness with the MABEL (Multiple Altimeter Beam Experimental Lidar) laser altimeter instrument mounted in the nose of an ER-2 aircraft. WIth MABEL’s unprecedented ability to detect individual photons, researchers will be able to even more accurately determine how Arctic ice sheets are behaving in today’s changing climate.

At the same time, news has come in from researchers with the University of Washington, who have completed a NASA- and NSF-funded study of the enormous island’s glaciers spanning a ten-year period. What they have found is that the glaciers have been increasing in speed about 30% over the past ten years — which is actually less than earlier studies had anticipated.

“In some sense, this raises as many questions as it answers. It shows there’s a lot of variability,” said Ian Joughin, a glaciologist in the UW’s Applied Physics Laboratory and coauthor of the paper, published May 4 in Science.

Previous research had suggested that Greenland’s melting glaciers could contribute up to 19 inches to global sea level rise by 2100. But the behavior of Greenland’s vast ice fields and ocean-draining glaciers was not yet thoroughly researched. Based on this new study, the outlet glaciers have not sped up as much as expected.

Still, ocean-draining (a.k.a. marine-terminating) glaciers move much faster than their land-based counterparts, and the UW researchers have found that their speeds are increasing on average — up to 32% in some areas.

The team realizes that the study may just not have observed a long enough period of time. (These are glaciers, after all!)

Icebergs calve from the edge of Greenland's Gyldenlove glacier in April 2011. (NASA/GSFC/Michael Studinger)

“There’s the caveat that this 10-year time series is too short to really understand long-term behavior, so there still may be future events – tipping points – that could cause large increases in glacier speed to continue,” said Ian Howat, an assistant professor of earth sciences at Ohio State University and a co-author of the paper. “Or perhaps some of the big glaciers in the north of Greenland that haven’t yet exhibited any changes may begin to speed up, which would greatly increase the rate of sea level rise.”

What the researchers didn’t find was any evidence that the rate of flow is slowing down. Though the true extent of the effect of Greenland’s ice on future sea level rise may not be unerringly predictable down to the inch or centimeter, even at the currently observed rate a contribution of 4 or more inches by the end of the century is still very much a possibility.

Meanwhile, the data gathered from the MABEL science flights over the past four weeks will be used to calibrate NASA’s next-generation ice-observing satellite, IceSat-2, planned for launch in 2016. Once in orbit, IceSat-2 will provide even more detailed insight to the complex behavior of our planet’s ice sheets.

Read more on the UW News release here.