Here’s the Earth and Moon Seen from OSIRIS-REx

The Earth-Moon system, as imaged by NASA's OSIRIS-REx mission. Credit: NASA/OSIRIS-REx team and the University of Arizona

On September 8th, 2016, NASA’s Origins, Spectral Interpretation, Resource Identification, and Security-Regolith Explorer (OSIRIS-REx) mission was launched into space. In the coming months, this space probe will approach and then rendezvous with the asteroid 101955 Bennu – a Near-Earth Object (NEO) – for the sake of studying it. The mission will also acquire samples of the asteroid, which will be returned to Earth by 2023.

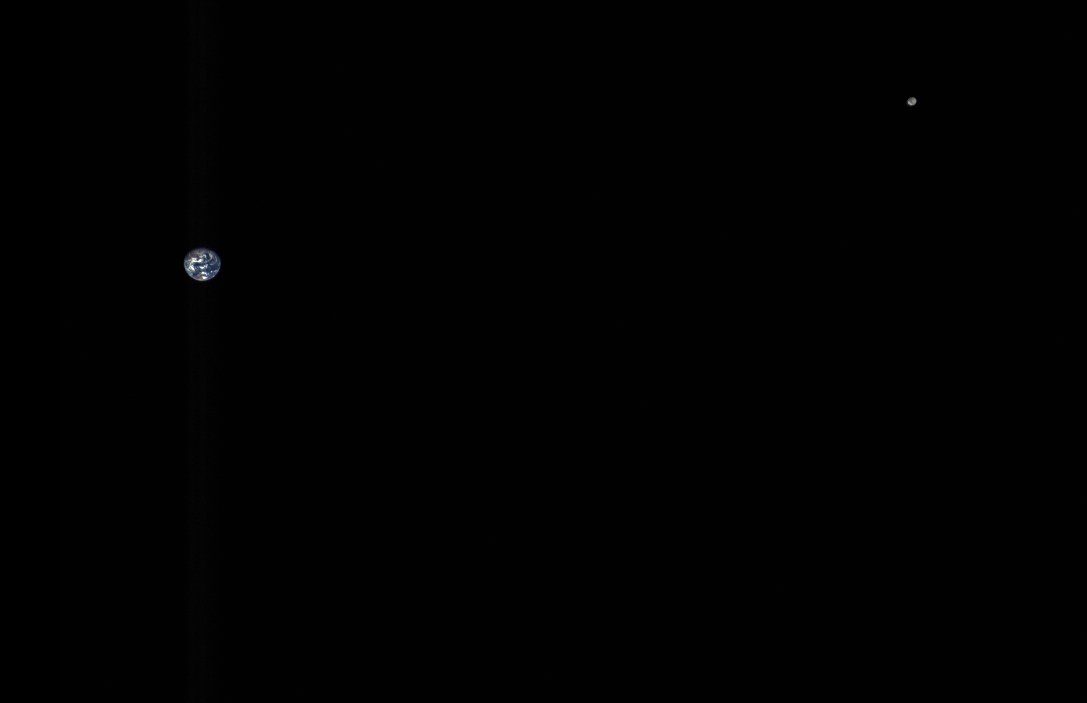
The OSIRIS-REx mission is an historic one, since it will be the first US spacecraft to conduct a sample-return mission with an asteroid. In the meantime, as the probe has makes its way further into space, it has been providing some truly breathtaking images of the journey. Consider the recently-released composite image of the Earth-Moon system, which NASA created using images that were taken by the probe on October 2nd, 2017.

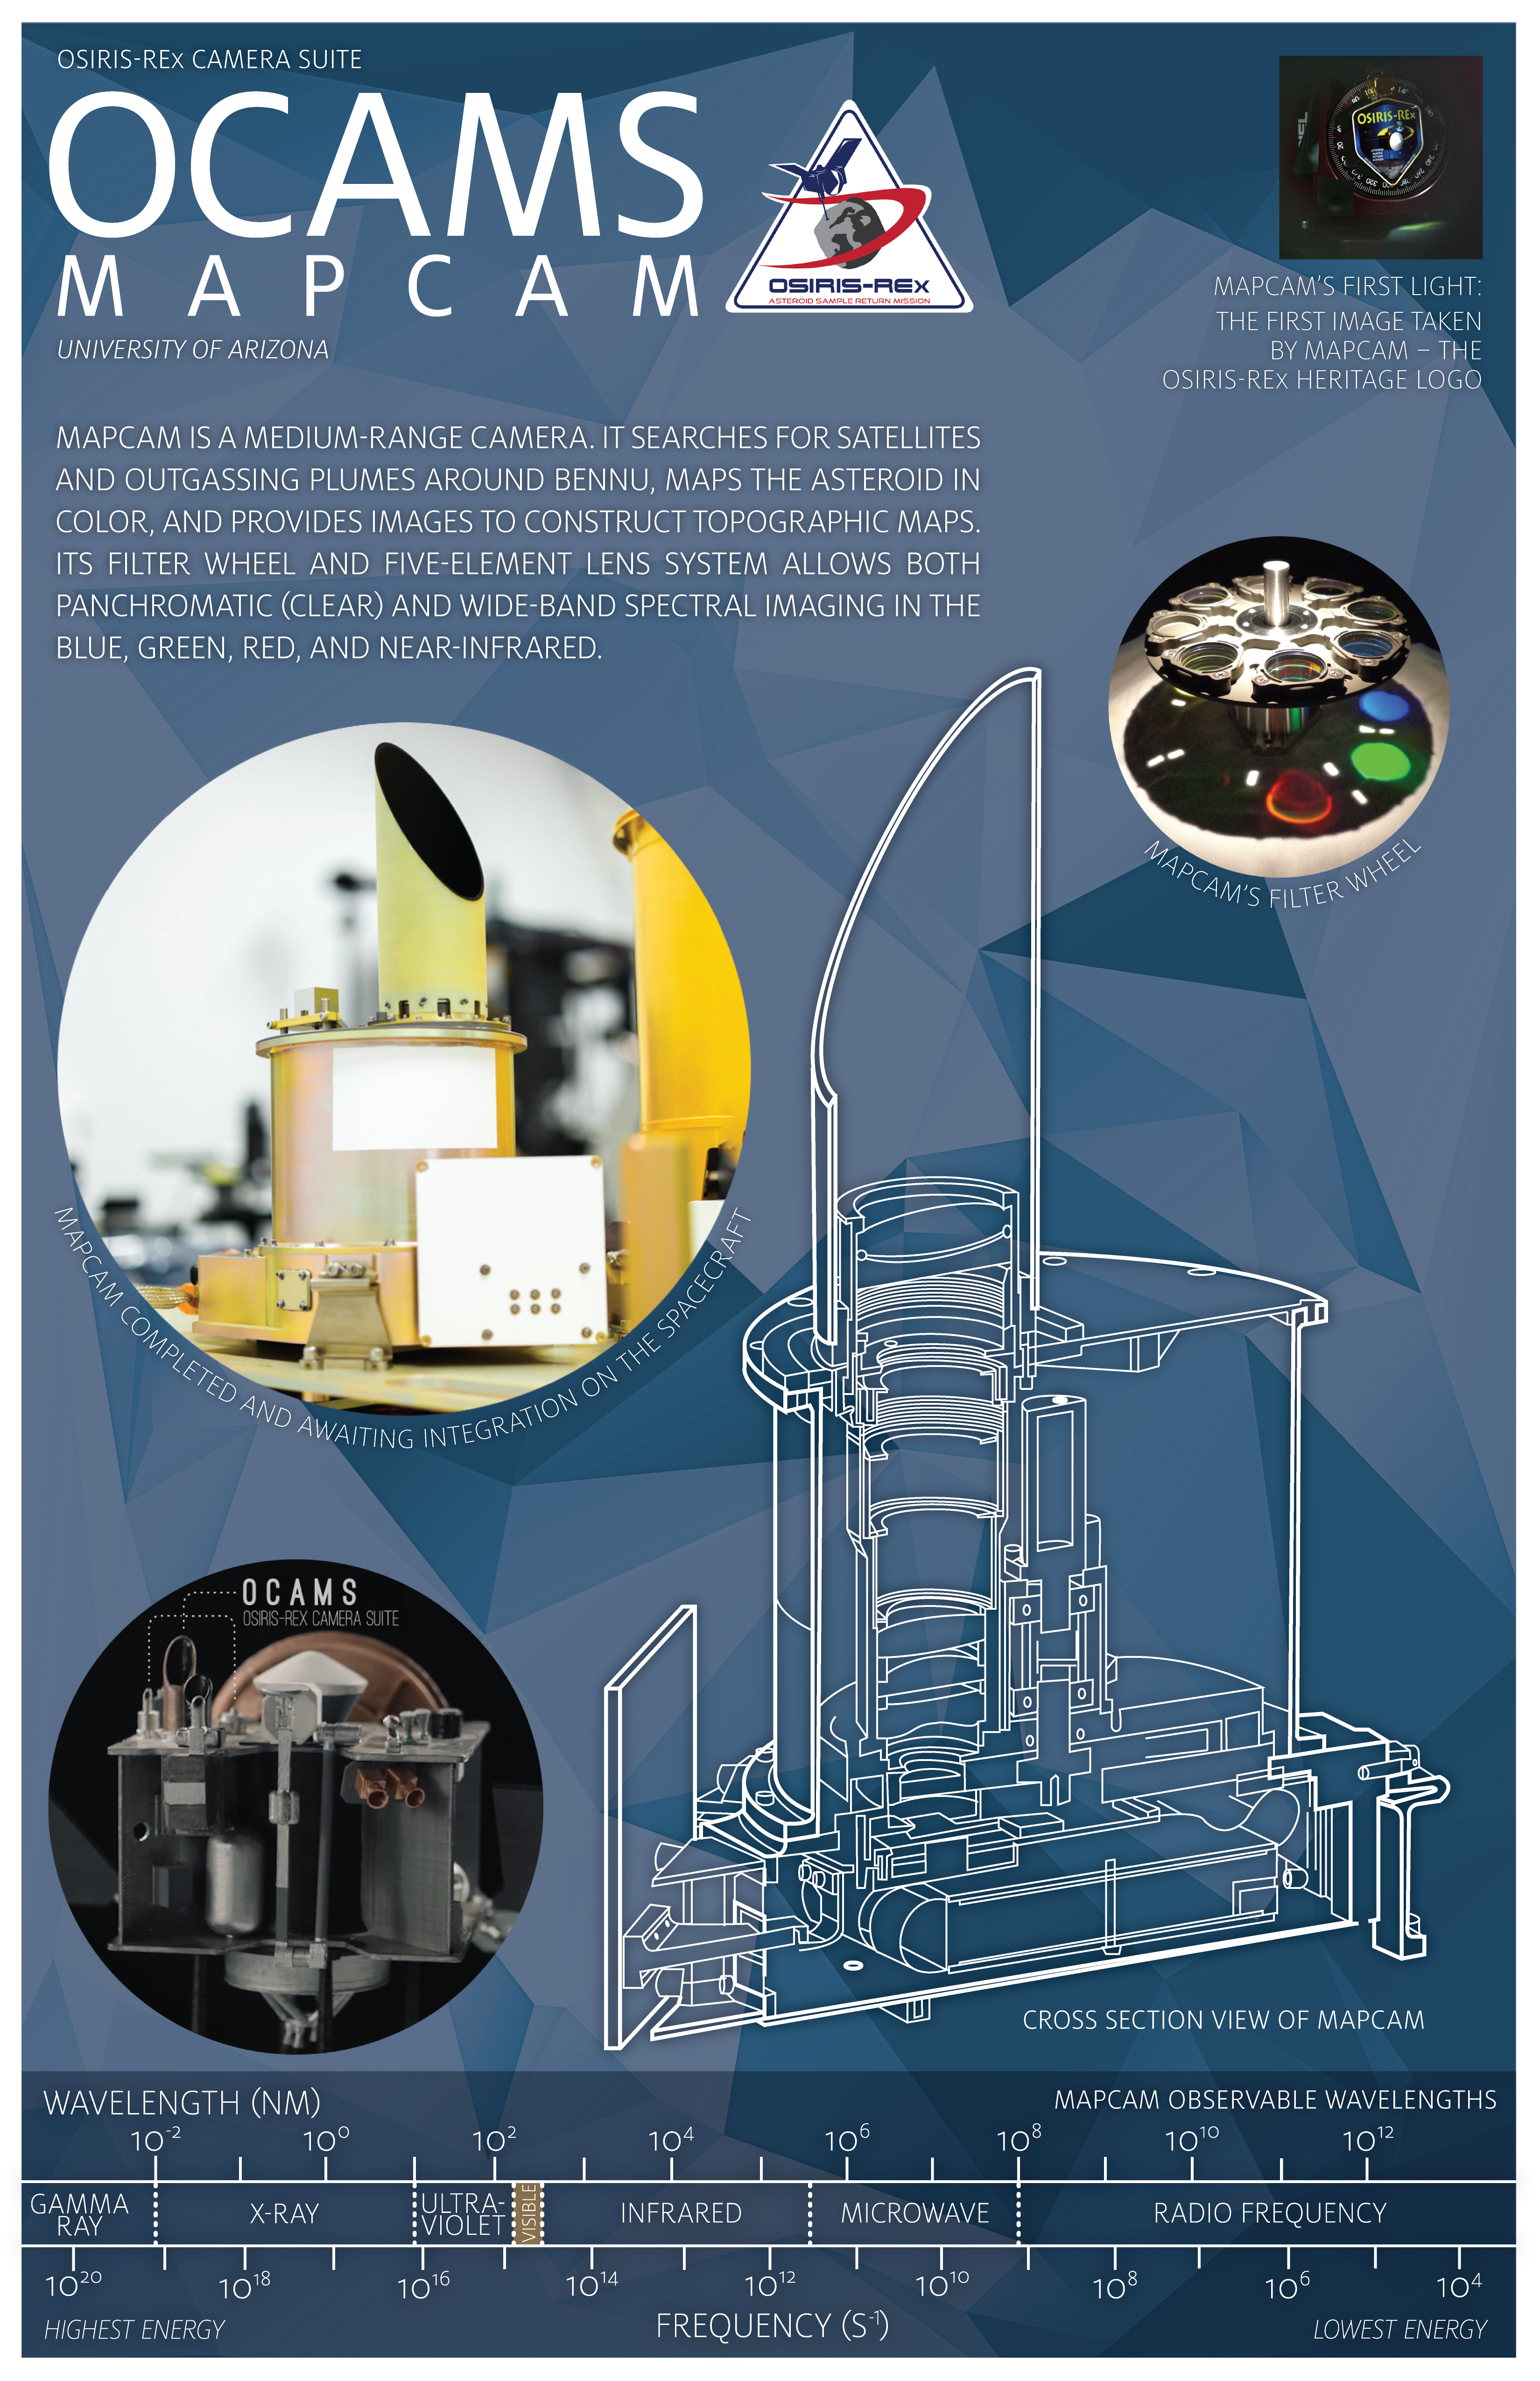
The images were all taken by the probe’s MapCam instrument, a medium-range camera designed to capture images of outgassing around Bennu and help map its surface in color. On this occasion, it snapped three beautiful pictures of Earth and the Moon. These images were all taken when the spacecraft was at a distance of approximately 5 million km (3 million mi) from Earth – about 13 times the distance between the Earth and the Moon.

Black and white image of Earth taken by the OSIRIS-REx’s NavCam 1 instrument. Credit: NASA/OSIRIS-REx team and the University of Arizona

As part of the OSIRIS-REx Camera Suite (OCAMS), which is operated by researchers at the University of Arizona, the CapCam has four color filters. To produce the image, three of them (b, v and w) were used as a blue, green and red filters and then stacked on top of each other. The Earth and Moon were each color-corrected, and the Moon was brightened to make it more easily visible.

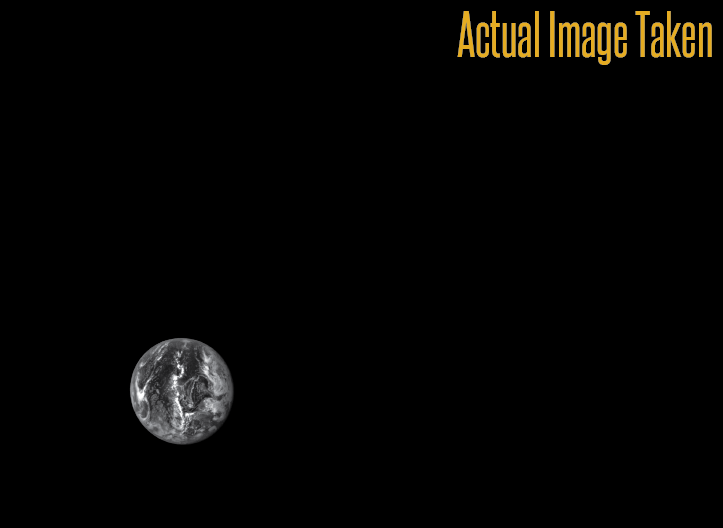
A second image of planet Earth (shown above), was taken on September 22nd, 2017, by one of the probe’s navigational cameras (NavCam 1). As the name suggests, this instrument is intended to help OSIRIS-REx orient itself while making its journey to Bennu and while it studies the asteroid. This is done by tracking starfields in space (while in transit) and landmarks on Bennu’s surface once it has arrived.

The image was taken when OSIRIS-REx was at a distance of 110,000 km (69,000 mi) from Earth. This was just after the probe had completed an Earth gravity-assist maneuver, where it used Earth’s gravitational force to slingshot around its equator and pick up more speed. The original image (shown below) was rotated so that the North Pole would be pointed up and the entire image was enlarged to provide more detail.

As you can see in the altered image, North America is visible on the upper right portion, while Hurricane Maria and the remnants of Hurricane Jose are visible in the far upper-right. The acquisition of these images was the result of painstaking calculations and planning, which were performed in advance by engineers and navigation specialists on the mission team using software called Systems Tool Kit (STK).

Original image taken by the OSIRIS-REx NavCam 1 of Earth. Credit: NASA/Goddard/University of Arizona/Lockheed Martin

These plans were developed to ensure that the probe would be able to snap pictures with precise timing, which were then uploaded to the spacecraft’s computer weeks ahead of time. Within hours of the probe executing its gravity-assist maneuver, crews on the ground were treated to the first images from the spacecraft’s navigational cameras, which confirmed that the probe was following the right path.

The probe is scheduled to reach Bennu in December of 2018, with approach operations commencing this coming August. Bennu is also expected to make a close pass with Earth several centuries from now, and could even collide with us by then. But for the time being, it represents a major opportunity to study the history and evolution of the Solar System, since it is essentially a remnant left over from its formation.

By studying this asteroid up close, and bringing samples back to Earth for further study, the OSRIS-REx mission could help us understand how life began on Earth and where the Solar System as a whole is headed. But in the meantime, the probe has been able to provide us with some beautiful snapshots of Earth, which serve to remind us all of certain things.

Much like Voyager 1‘s “Pale Blue Dot” photo, seeing Earth from space helps to drive home the fact that life is rare and precious. It also reminds us that we, as a species, are all in this together and completely and utterly dependent  on our planet and its ecosystems. Once in awhile, we need to be reminded of these things. Otherwise, we might do some stupid – like ruin it!

Further Reading: NASA

You Knew This Day Was Coming. Alien Megastructures Ruled Out for Tabby’s Star. Dust is the Culprit

This illustration depicts a hypothetical uneven ring of dust orbiting KIC 8462852, also known as Boyajian's Star or Tabby's Star. Credit: NASA/JPL-Caltech

In September of 2015, KIC 8462852 (aka. Tabby’s Star) captured the world’s attention when it was found to be experiencing a mysterious drop in brightness. In the years since then, multiple studies have been conducted that have tried to offer a natural explanation for this behavior. In lieu of one, there’s been plenty of speculation as to what could be causing the dimming effect – including the controversial “alien megastructure” theory.

Unfortunately, after years of excitement and speculation, the scientific community may have finally driven a nail into this theory’s coffin. According to a new study by a team of over 100 astronomers, and led by Assistant Professor Tabetha Boyajian – who made the original discovery – it now appears likely that KIC 8462852 (aka. “Tabby’s Star”) is being partially obscured by dust and not – I repeat, NOT – an alien megastructure.

Continue reading “You Knew This Day Was Coming. Alien Megastructures Ruled Out for Tabby’s Star. Dust is the Culprit”

In mid-March, the Chinese Tiangong-1 Space Station is Going to Come Crashing Back Down to Earth… Somewhere

Artist's illustration of China's 8-ton Tiangong-1 space station, which is expected to fall to Earth in late 2017. Credit: CMSE.

In September of 2011, China officially joined the Great Powers in Space club, thanks to the deployment of their Tiangong-1 space station. Since then, this prototype station has served as a crewed orbital laboratory and an experimental testbed for future space stations. In the coming years, China hopes to build on the lessons learned with Tiangong-1 to create a larger, modular station in 2023 (similar to the International Space Station).

Though the station’s mission was originally meant to end in 2013, the China National Space Agency extended its service to 2016. By September of 2017, the Agency acknowledged that they had lost control of the station and indicated that it would fall to Earth later in the year. According to the latest updates from satellite trackers, Tianglong-1 is likely to be reentering our atmosphere in March of 2018.

Given the fact that the station measures 10 by 3.35 meters (32.8 by 11 ft), weighs a hefty 8,506 kg (18,753 lb) and was built from very durable construction materials, there are naturally concerns that some of it might survive reentry and reach the surface. But before anyone starts worrying about space debris falling on their heads, there are a few things that need to be addressed.

Images of the Tiangong-1 docking in Earth orbit in 2013. Credit: ESA

For starters, in the history of space flight, there has not been a single confirmed death caused by falling space debris. Tthanks to the development of modern tracking and early warning systems, we are also more prepared than at any time in our history for the threat of falling debris. Statistically speaking, you are more likely to be hit by falling airplane debris or eaten by a shark.

Second, the CNSA has emphasized that the reentry is very unlikely to pose a threat to commercial aviation or cause any impact damage on the surface. As Wu Ping – the deputy director of the manned space engineering office – indicated at a press conference back on September 14th, 2017: “Based on our calculation and analysis, most parts of the space lab will burn up during falling.”

In addition, The Aerospace Corporation, which is currently monitoring the reentry of Tiangong-1, recently released the results of their comprehensive analysis. Similar to what Wu stated, they indicated that most of the station will burn up on reentry, though they acknowledged that there is a chance that small bits of debris could survive and reach the surface. This debris would likely fall within a region that is centered along the orbital path of the station (i.e. around the equator).

To illustrate the zones of highest risk, they produced a map (shown below) which indicates where the debris would be most likely to land. Whereas the blue areas (that make up one-third of the Earth’s surface) indicate zones of zero probability, the green area indicates a zone of lower probability. The yellow areas, meanwhile, indicates zones that have a higher probability, which extend a few degrees south of 42.7° N and north of 42.7° S latitude, respectively.

The Aerospace Corporations predicted reentry for Tiangong-1. Credit: aerospace.org

To add a little perspective to this analysis, the company also indicated the following:

“When considering the worst-case location (yellow regions of the map) the probability that a specific person (i.e., you) will be struck by Tiangong-1 debris is about one million times smaller than the odds of winning the Powerball jackpot. In the history of spaceflight, no known person has ever been harmed by reentering space debris. Only one person has ever been recorded as being hit by a piece of space debris and, fortunately, she was not injured.”

Last, but not least, the European Space Agency’s Inter Agency Space Debris Coordination Committee (IADC) will be monitoring the reentry. In fact, the IADC – which is made up of space debris and other experts from NASA, the ESA, JAXA, ISRO, KARI, Roscosmos and the China National Space Administration – will be using this opportunity to conduct a test campaign.

During this campaign, participants will combine their predictions of the reentry’s time window, which are based on respective tracking datasets obtained from radar and other sources. Ultimately, the purpose of the campaign is to improve prediction accuracy for all member states and space agencies. And so far, their predictions also indicate that there is little cause for concern.

As Holger Krag, the Head of ESA’s Space Debris Office, indicated in a press statement back in November:

“Owing to the geometry of the station’s orbit, we can already exclude the possibility that any fragments will fall over any spot further north than 43ºN or further south than 43ºS. This means that reentry may take place over any spot on Earth between these latitudes, which includes several European countries, for example. The date, time and geographic footprint of the reentry can only be predicted with large uncertainties. Even shortly before reentry, only a very large time and geographical window can be estimated.”

The Chinese Long March 3 rocket reentering the atmosphere over Hawaii. Credits: ESA/Steve Cullen (Starscape Galery)

The ESA’s Space Debris Office – which is based at the European Space Operations Centre in Darmstadt, Germany – will follow this campaign in February with an international expert workshop. This workshop (which will run from February 28th to March 1st, 2018) will focus on reentry predictions and atmospheric break-up studies and allow experts in the field of space debris monitoring to share their latest findings and research.

In the current age of renewed space exploration and rapidly improving technology, every new development in space is an opportunity to test the latest instruments and methods. The reentry of Tiangong-1 is a perfect example, where the reentry of a space station is being used to test our ability to predict falling space debris. It also highlights the need for tracking and monitoring, given that humanity’s presence in orbit is only going to increase in the coming years.

In the meantime, it would not be inadvisable to keep your eyes on the skies this coming March. While there is little chance that debris will pose a hazard, it is sure to be spectacular sight for people who live closer to the equator!

Further Reading: Aerospace.org, ESA, Xinhuanet

Supermassive Black Holes can Turn Star Formation On and Off in a Large Galaxy

Colour composite image of Centaurus A, revealing the lobes and jets emanating from the active galaxy’s central black hole. Credit: ESO/NASA/CXC/CfA/WFI/MPIfR/APEX/A.Weiss et al./R.Kraft et al.

In the 1970s, astronomers discovered that a particularly large black hole (Sagittarius A*) existed at the center of our galaxy. In time, they came to understand that similar Supermassive Black Holes (SMBHs) existed in the center of most massive galaxies. The presence of these black holes was also what differentiated galaxies that had particularly luminous cores – aka. Active Galactic Nuclei (AGN) – from those that didn’t.

Since that time, astronomers and cosmologists have pondered what role SMBHs have on galactic evolution, with some venturing that they have a profound impact on star formation. And thanks to a recent study by an international team of astronomers, there is now direct evidence for a correlation between and SMBH and a galaxy’s star formation. In fact, the team demonstrated that a black hole’s mass could determine when star formation in a galaxy will end.

The study, titled “Black-Hole-Regulated Star Formation in Massive Galaxies“, recently appeared in the scientific journal Nature. Led by Ignacio Martín-Navarro, a Marie Curie Fellow at the University of California Observatories, the study team also consisted of members from the Max-Planck Institute for Astronomy and the Instituto de Astrofísica de Canarias.

The primary mirror of the Hobby-Eberly Telescope (HET) at McDonald Observatory. The mirror is made up of 91 segments, and has an effective aperture of 9.2 meters. Credit: Marty Harris/McDonald Observatory

For the sake of their study, the team relied on data gathered the Hobby-Eberle Telescope Massive Galaxy Survey in 2015. This systematic survey used the 10m Hobby-Eberly Telescope (HET) at the McDonald Observatory to conduct an optical long-slit spectroscopic survey of over 1000 galaxies. This survey not only provided spectra for these galaxies, but also produced direct mass measurements of the central black holes for 74 of these galaxies.

Using this data, Martín-Navarro and his colleagues found the first observational evidence for a direct correlation between the mass of a galaxy’s central black hole and its history of star formation. While astrophysicists have been operating under this assumption for decades, the proof was missing until now. As Jean Brodie, professor of astronomy and astrophysics at UC Santa Cruz and a coauthor of the paper, said in a UCSC press release:

“We’ve been dialing in the feedback to make the simulations work out, without really knowing how it happens. This is the first direct observational evidence where we can see the effect of the black hole on the star formation history of the galaxy.”

Roughly 15 years ago, the correlation between a SMBHs mass and the total mass of a galaxy’s stars was discovered, which led to a major unresolved question in astrophysical circles. While this correlation appeared to be a central feature of galaxies, it was unclear as to what could have caused it. How could the mass of a comparatively small and central black hole be related to the mass of billions of stars distributed throughout a galaxy?

The galaxy NGC 660 – in this and other galaxies, the rate at which new stars are formed appears to be linked to the evolution of the galaxy’s central black hole. Credit: ESA/Hubble/NASA

One possible explanation was that more massive galaxies collected larger amounts of gas, thus resulting in more stars and a more massive central black hole. However, astrophysicists also believed their was a feedback mechanism at work, where growing black holes inhibited the formation of stars in their vicinity. In short, when matter accretes on a central black hole, it sends out a tremendous amount of energy in the form of radiation and particle jets.

If this energy is transferred to gas and dust surrounding the core of the galaxy, stars will be less likely to form in this region since gas and dust need to be cold in order to undergo areas of collapse. For years, feedback of this kind has been included in cosmological simulations to explain the observed star-formation rates in galaxies. According to these same simulations, minus this mechanism, galaxies would form far more stars than have been observed.

However, no direct evidence of this phenomena had previously been available. The first step to obtaining some was to reproduce the stellar formation histories of the 74 target galaxies used for the study. Martín-Navarro and his colleagues did this by subjecting spectra obtained from each of these galaxies to computational techniques that looked for the best combination of stellar populations to fit the data.

In so doing, the team was able to reconstruct the history of star formation within the target galaxies for the past 12.5 billion years. After examining these histories, they noticed some predictable results, but also some rather significant differences. For starters, as predicted, the regions of around the galaxies’ central black holes demonstrated a clear dampening influence on the rate of star formation.

Artist’s concept of the most distant supermassive black hole ever discovered. It is part of a quasar from just 690 million years after the Big Bang. Credit: Robin Dienel/Carnegie Institution for Science

As predicted, there was also a clear correlation between the mass of the central black holes and stellar mass in these galaxies. However, the team also noted that in cases where stellar mass was slightly smaller than expected (relative to the mass of their central black holes), star formation rates were lower. In some other cases, galaxies had larger-than-expected stellar masses (again, relative to their black holes) and their star formation rates were higher.

This correlation was not only more consistent than that observed between black hole mass and stellar mass, it occurred independently of other factors (such as shape or density). As Martín-Navaro explained:

“For galaxies with the same mass of stars but different black hole mass in the center, those galaxies with bigger black holes were quenched earlier and faster than those with smaller black holes. So star formation lasted longer in those galaxies with smaller central black holes.”

They also noted that this correlation extends into the deep past, where the galaxies with supermassive central black holes have been consistently producing a comparatively low rate of stars for the past 12.5 billion years. This constitutes the first strong evidence for a direct, long-term connection between star formation and the existence of a central black hole in a galaxy.

Close-up of star near a supermassive black hole (artist’s impression). Credit: ESA/Hubble, ESO, M. Kornmesser

Another interesting takeaway from the study was the way it addressed possible correlations between AGN luminosity and star formation. In the past, other researchers have sought to find evidence of a link between the two, but without success. According to Martín-Navarro and his team, this may be because the time scales are incredibly different. Whereas star formation occurs over the course of eons, outbursts from AGNs occur over shorter intervals.

What’s more, AGNs are highly variable and their properties are dependent on a number of factors relating to their black holes – i.e. size, mass, rate of accretion, etc. We used black hole mass as a proxy for the energy put into the galaxy by the AGN, because accretion onto more massive black holes leads to more energetic feedback from active galactic nuclei, which would quench star formation faster,” said Martin-Navarro.

Looking ahead, the team hopes to conduct further research and determine exactly how central black holes arrest star formation. At present, the possibility that it could be due to radiation or jets of gas heating up surrounding matter are not definitive. As Aaron Romanowsky, an astronomer at San Jose State University and UC Observatories, indicated:

“There are different ways a black hole can put energy out into the galaxy, and theorists have all kinds of ideas about how quenching happens, but there’s more work to be done to fit these new observations into the models.”

Part of determining how the Universe came to be is knowing what mechanisms were at play and the extent of their roles. With this latest study, astrophysicists and cosmologists can take comfort in the knowledge that they’ve been getting it right – at least in this case!

Further Reading: UCSC, MPIA, Nature

What is the Gravitational Microlensing Method?

Hubble image of a luminous red galaxy (LRG) gravitationally distorting the light from a much more distant blue galaxy, a technique known as gravitational lensing. The shape of the galaxy doing the lensing created an almost circular image. An oblong galaxy would create more of an Einstein Ring effect. Credit: ESA/Hubble & NASA

Welcome back to our series on Exoplanet-Hunting methods! Today, we look at the curious and unique method known as Gravitational Microlensing.

The hunt for extra-solar planets sure has heated up in the past decade. Thanks to improvements made in technology and methodology, the number of exoplanets that have been observed (as of December 1st, 2017) has reached 3,710 planets in 2,780 star systems, with 621 system boasting multiple planets. Unfortunately, due to various limits astronomers are forced to contend with, the vast majority have been discovered using indirect methods.

One of the more commonly-used methods for indirectly detecting exoplanets is known as Gravitational Microlensing. Essentially, this method relies on the gravitational force of distant objects to bend and focus light coming from a star. As a planet passes in front of the star relative to the observer (i.e. makes a transit), the light dips measurably, which can then be used to determine the presence of a planet.

In this respect, Gravitational Microlensing is a scaled-down version of Gravitational Lensing, where an intervening object (like a galaxy cluster) is used to focus light coming from a galaxy or other object located beyond it. It also incorporates a key element of the highly-effective Transit Method, where stars are monitored for dips in brightness to indicate the presence of an exoplanet.

Description:

In accordance with Einstein’s Theory of General Relativity, gravity causes the fabric of spacetime to bend. This effect can cause light affected by an object’s gravity to become distorted or bent. It can also act as a lens, causing light to become more focused and making distant objects (like stars) appear brighter to an observer. This effect occurs only when the two stars are almost exactly aligned relative to the observer (i.e. one positioned in front of the other).

These “lensing events” are brief, but plentiful, as Earth and stars in our galaxy are always moving relative to each other. In the past decade, over one thousand such events have been observed, and typically lasted for a few days or weeks at a time. In fact, this effect was used by Sir Arthur Eddington in 1919 to provide the first empirical evidence for General Relativity.

This took place during the solar eclipse of May 29th, 1919, where Eddington and a scientific expedition traveled to the island of Principe off the coast of West Africa to take pictures of the stars that were now visible in the region around the Sun. The pictures confirmed Einstein’s prediction by showing how light from these stars was shifted slightly in response to the Sun’s gravitational field.

The technique was originally proposed by astronomers Shude Mao and Bohdan Paczynski in 1991 as a means of looking for binary companions to stars. Their proposal was refined by Andy Gould and Abraham Loeb in 1992 as a method of detecting exoplanets. This method is most effective when looking for planets towards the center of the galaxy, as the galactic bulge provides a large number of background stars.

A sketch of a microlensing signature with a planet in the lens system. Image Credit: NASA / ESA / K. Sahu / STScI

Advantages:

Microlensing is the only known method capable of discovering planets at truly great distances from the Earth and is capable of finding the smallest of exoplanets. Whereas the Radial Velocity Method is effective when looking for planets up to 100 light years from Earth and Transit Photometry can detect planets hundreds of light-years away, microlensing can find planets that are thousands of light-years away.

While most other methods have a detection bias towards smaller planets, the microlensing method is the most sensitive means of detecting planets that are around 1-10 astronomical units (AU) away from Sun-like stars. Microlensing is also the only proven means of detecting low-mass planets in wider orbits, where both the transit method and radial velocity are ineffective.

Taken together, these benefits make microlensing the most effective method for finding Earth-like planets around Sun-like stars. In addition, microlensing surveys can be effectively mounted using ground-based facilities. Like Transit Photometry, the Microlensing Method benefits from the fact that it can be used to survey tens of thousands of stars simultaneously.

Disadvantages:

Because microlensing events are unique and not subject to repeat, any planets detected using this method will not be observable again. In addition, those planets that are detected tend to be very far way, which makes follow-up investigations virtually impossible. Luckily, microlensing detections generally do not require follow-up surveys since they have a very high signal-to-noise ratio.

While confirmation is not necessary, some planetary microlensing events have been confirmed. The planetary signal for event OGLE-2005-BLG-169 was confirmed by HST and Keck observations (Bennett et al. 2015; Batista et al. 2015). In addition, microlensing surveys can only produce rough estimations of a planet’s distance, leaving significant margins for error.

Microlensing is also unable to yield accurate estimates of a planet’s orbital properties, since the only orbital characteristic that can be directly determined with this method is the planet’s current semi-major axis. As such, planet’s with an eccentric orbit will only be detectable for a tiny portion of its orbit (when it is far away from its star).

Finally, microlensing is dependent on rare and random events – the passage of one star precisely in front of another, as seen from Earth – which makes detections both rare and unpredictable.

Examples of Gravitational Microlensing Surveys:

Surveys that rely on the Microlensing Method include the Optical Gravitational Lensing Experiment (OGLE) at the University of Warsaw. Led by Andrzej Udalski, the director of the University’s Astronomical Observatory, this international project uses the 1.3 meter “Warsaw” telescope at Las Campanas, Chile, to search for microlensing events in a field of 100 stars around the galactic bulge.

The Astronomical Observatory at the University of Warsaw, used to conduct the OGLE project. Credit: ogle.astrouw.edu.pl

There is also the Microlensing Observations in Astrophysics (MOA) group, a collaborative effort between researchers in New Zealand and Japan. Led by Professor Yasushi Muraki of Nagoya University, this group uses the Microlensing Method to conduct surveys for dark matter, extra-solar planets, and stellar atmospheres from the southern hemisphere.

And then there’s the Probing Lensing Anomalies NETwork (PLANET), which consists of five 1-meter telescopes distributed around the southern hemisphere. In collaboration with RoboNet, this project is able to provide near-continuous observations for microlensing events caused by planets with masses as low as Earth’s.

The most sensitive survey to date is the Korean Microlensing Telescope Network (KMTNet), a project initiated by the Korea Astronomy and Space Science Institute (KASI) in 2009. KMTNet relies on the instruments at three southern observatories to provide 24-hour continuous monitoring of the Galactic bulge, searching for microlensing events that will point the way towards earth-mass planets orbiting with their stars habitable zones.

We have written many interesting articles on exoplanet detection here at Universe Today. Here is What are Extra Solar Planets?, What is the Transit Method?, What is the Radial Velocity Method?, What is Gravitational Lensing? and Kepler’s Universe: More Planets in our Galaxy than Stars

For more information, be sure to check out NASA’s page on Exoplanet Exploration, the Planetary Society’s page on Extrasolar Planets, and the NASA/Caltech Exoplanet Archive.

Astronomy Cast also has relevant episodes on the subject. Here’s Episode 208: The Spitzer Space Telescope, Episode 337: Photometry, Episode 364: The CoRoT Mission, and Episode 367: Spitzer Does Exoplanets.

Sources:

Messier 64 – The Black Eye Galaxy

Image of the Black Eye Galaxy (Messier 64), taken with Hubble's Wide Field Planetary Camera 2 (WFPC2). Credit: NASA and The Hubble Heritage Team (AURA/STScI)

Welcome back to Messier Monday! Today, we continue in our tribute to our dear friend, Tammy Plotner, by looking at that “evil” customer known as Messier 64 – aka. the “Black Eye Galaxy”!

In the 18th century, while searching the night sky for comets, French astronomer Charles Messier kept noting the presence of fixed, diffuse objects he initially mistook for comets. In time, he would come to compile a list of approximately 100 of these objects, hoping to prevent other astronomers from making the same mistake. This list – known as the Messier Catalog – would go on to become one of the most influential catalogs of Deep Sky Objects.

One of these objects is known as Messier 64, which is also known as the “Black Eye” or “Evil Eye Galaxy”. Located in the Coma Berenices constellation, roughly 24 million light-years from Earth, this spiral galaxy is famous for the dark band of absorbing dust that lies in front of the galaxy’s bright nucleus (relative to Earth). Messier 64 is well known among amateur astronomers because it is discernible with small telescopes.

Description:

Residing about 19 million light years from our home galaxy, the “Sleeping Beauty” extends across space covering an area nearly 40,000 light years across, spinning around at a speed of 300 kilometers per second. Toward its core is a counter-rotating disc approximate 4,000 light years wide and the friction between these two may very well be the contributing factor to the huge amounts of starburst activity and distinctive dark dust lane.

Infrared image taken by the Hubble Space Telescope, which penetrated the dust clouds swirling around the centers of the M64 galaxy. Credits: Torsten Boeker, Space Telescope Science Institute and NASA/ESA

Stars themselves appear to be forming in two waves, first evolving outside following the density gradient where abundant interstellar matter was waiting, and then evolving slowly. As the material from the mature stars began beig pushed back by their stellar winds, supernovae, and planetary nebulae, increased amounts of interstellar matter once again compressed, beginning the process of star formation again. This “second wave” may very well be represented by the dark, obscuring dust lane we see.

But, M64 isn’t without it share of turmoil. Its dual rotation may have started as a collision when two galaxies merged some billion years ago – or so theory would suggest. But did it? As Robert Braun and Rene Walterbos explained in their 1995 study:

“This galaxy is known to contain two nested, counter rotating, gas disks of a few 108 solar mass each, with the inner disk extending to approximately 1 kpc and the outer disk extending beyond. The stellar kinematics along the major axis, extending across the transition region between the two gas disks, show no hint of velocity reversal or increased velocity dispersion.  The stars always rotate in the same sense as the inner gas disk, and thus it is the outer disk which ‘counterrotates’. The projected circular velocities inferred from the stellar kinematics and from the H I disks agree to within approximately 10 km/s, supporting other evidence that the stellar and gaseous disks are coplanar to approximately 7 deg. This upper limit is comparable to the mass of detected counter rotating gas. This low mass of counter rotating material, combined with the low-velocity dispersion in the stellar disk, implies that NGC 4826 cannot be the product of a retrograde merger of galaxies, unless they differed by at least an order of magnitude in mass. The velocities of the ionized gas along the major axis are in agreement with that of the stars for R less than 0.75 kpc. The subsequent transition toward apparent counter rotation of the ionized gas is spatially well resolved, extending over approximately 0.6 kpc in radius. The kinematics of this region are not symmetric with respect to the galaxy center. On the southeast side there is a significant region in which vproj (H II) much less than vcirc approximately 150 km/s, but sigma (H II) approximately 65 km/s. The kinematic asymmetries cannot be explained with any stationary dynamical model, even is gas inflow or warps were invoked. The gas in this transition region shows a diffuse spatial structure, strong (N II) and (S II) emission, as well as the high-velocity dispersion. These data present us with the conundrum of explaining a galaxy in which a stellar disk, and two counter rotating H I disks, at smaller and much larger radii, appear in equilibrium and nearly coplanar, yet in which the transition region between the gas disks is not in steady state.”

So is all what it really appears to be? Are new stars being born in the darkness? As A. Majeed (et al) indicated in their 1999 study:

“The Evil Eye galaxy (NGC 4826; M64) is distinguished by an asymmetrically placed, strongly absorbing dust lane across its prominent bulge. We obtained a long-slit spectrum of NGC 4826, with the slit across the galaxy’s nucleus, covering equal parts of the obscured and the unobscured portions of the bulge. By comparing the spectral energy distributions at corresponding positions on the bulge, symmetrically placed with respect to the nucleus, we were able to study the wavelength dependent effects of absorption, scattering, and emission by the dust, as well as the presence of ongoing star formation in the dust lane. We report the detection of strong extended red emission (ERE) from the dust lane within about 15 arcsec distance from the nucleus of NGC 4826. The ERE band extends from 5400 A to 9400 A, with a peak near 8800 A. The integrated ERE intensity is about 75 % of that of the estimated scattered light from the dust lane. The ERE shifts toward longer wavelengths and diminishes in intensity as a region of star formation, located beyond 15 arcsec distance, is approached. We interpret the ERE as originating in photoluminescence by nanometer-sized clusters, illuminated by the galaxy’s radiation field, in addition to the illumination by the star-forming complex within the dust lane. When examined within the context of ERE observations in the diffuse ISM of our Galaxy and in a variety of other dusty environments such as nebulae, we conclude that the ERE photon conversion efficiency in NGC 4826 is as high as found elsewhere, but that the size of the nanoparticles in NGC 4826 is about twice as large as those thought to exist in the diffuse ISM of our Galaxy.”

Messier 64 (“Black Eye Galaxy”) imaged using amateur telescope. Credit: Jeff Johnson.

But the debate is still on. As R.A. Walterbos (et al) expressed in their 1993 study:

“The close to coplanar orientation of the gas disks is one aspect which is in good agreement with what is expected on the basis of a merger model for the counter-rotating gas. The rotation direction of the inner gas disk with respect to the stars, however, is not. In addition, the existence of a well defined exponential disk probably implies that if a merger did occur it must have been between a gas-rich dwarf and a spiral, not between two equal mass spirals. The stellar spiral arms of NGC 4826 are trailing over part of the disk and leading in the outer disk. Recent numerical calculations by Byrd et al. for NGC 4622 suggest that long lasting leading arms could be formed by a close retrograde passage of a small companion. In this scenario, the outer counter-rotating gas disk in NGC 4826 might be the tidally stripped gas from the dwarf. However, in NGC 4826 the outer arms are leading, while it appears that in NGC 4622 the inner arms are leading. A realistic N-body/hydro simulation of a dwarf-spiral encounter is clearly needed. It may also be possible that the counter-rotating outer gas disk is due to gradual infall of gas from the halo, rather than from a discrete merger event.”

History of Observation:

M64 was discovered by Edward Pigott on March 23, 1779, just 12 days before Johann Elert Bode found it independently on April 4, 1779. Roughly a year later, Charles Messier independently rediscovered it on March 1, 1780 and cataloged it as M64. Said Pigot:

“.. on the 23rd of March [1779], I discovered a nebula in the constellation of Coma Berenices, hitherto, I presume, unnoticed; at least not mentioned in M. de la Lande’s Astronomy, nor in M. Messier’s ample Catalogue of nebulous Stars [of 1771]. I have observed it in an acromatic instrument, three feet long, and deduced its mean R.A. by comparing it to the following stars Mean R.A. of the nebula for April 20, 1779, of 191d 28′ 38″. Its light being exceedingly weak, I could not see it in the two-feet telescope of our quadrant, so was obliged to determine its declination likewise by the transit instrument. The determination, however, I believe, may be depended upon to two minutes: hence, the declination north is 22d 53″1/4. The diameter of this nebula I judged to be about two minutes of a degree.”

However, Pigott’s discovery got published only when read before the Royal Society in London on January 11, 1781, while Bode’s was published during 1779 and Messier’s in late summer, 1780. Pigott’s discovery was more or less ignored and recovered only by Bryn Jones in April 2002! (May the good Mr. Pigot know that he was remembered here and his reports placed first!!)

Messier 64, the Black Eye Galaxy. Credit: Miodrag Sekulic

So how did it get the name “Black Eye Galaxy”? We have Sir William Herschel to thank for that: “A very remarkable object, much elongated, about 12′ long, 4′ or 5′ broad, contains one lucid spot like a star with a small black arch under it, so that it gives one the idea of what is called a black eye, arising from fighting.” Of course, John Herschel perpetuated it when he wrote in his own notes:

“The dark semi-elliptic vacancy (indicated by an unshaded or bright portion in the figure,) which partially surrounds the condensed and bright nucleus of this nebula, is of course unnoticed by Messier. It was however seen by my Father, and shown by him to the late Sir Charles Blagden, who likened it to the appearance of a black eye, an odd, but not inapt comparison. The nucleus is somewhat elongated, and I have a strong suspicion that it may be a close double star, or extremely condensed double nebula.”

Locating Messier 64:

Locating M64 isn’t particularly easy. Begin by identifying bright orange Arcturus and the Coma Berenices star cluster (Melotte 111) about a hand span to the general west. As you relax and let your eyes dark adapt, you will see the three stars that comprise the constellation of Coma Berenices, but if you live under light polluted skies, you may need binoculars to find its faint stars. Once you have confirmed Alpha Comae, star hop approximately 4 degrees north/northwest to 35 Comae. You will find M64 around a degree to the northeast of star 35.

While Messier 64 is binocular possible, it will require very dark skies for average binoculars and will only show as a very small, oval contrast change. However, in telescopes as small as 102mm, its distinctive markings can be seen on dark nights with good clarity. Don’t fight over it… There’s plenty of dark dustlane in this Sleeping Beauty to go around!

The location of Messier 64 in the Coma Berenices constellation. Credit: IAU/Sky & Telescope magazine (Roger Sinnott & Rick Fienberg)

And here are the quick facts on this Messier Object to help you get started:

Object Name: Messier 64
Alternative Designations: M64, NGC 4826, The Black Eye Galaxy, Sleeping Beauty Galaxy, Evil Eye Galaxy
Object Type: Type Sb Spiral Galaxy
Constellation: Coma Berenices
Right Ascension: 12 : 56.7 (h:m)
Declination: +21 : 41 (deg:m)
Distance: 19000 (kly)
Visual Brightness: 8.5 (mag)
Apparent Dimension: 9.3×5.4 (arc min)

We have written many interesting articles about Messier Objects here at Universe Today. Here’s Tammy Plotner’s Introduction to the Messier ObjectsM1 – The Crab Nebula, and David Dickison’s articles on the 2013 and 2014 Messier Marathons.

Be to sure to check out our complete Messier Catalog. And for more information, check out the SEDS Messier Database.

Sources:

Top 2018 Astronomy Events

The final occultation of the bright star Aldebaran by the Moon for 2017. Dave Dickinson
2018 Astronomy – The final occultation of the bright star Aldebaran by the Moon for 2017. Dave Dickinson

Happy New Year 2018.

One of the toughest choices we made last year was to not write a full astronomy guide for 2018. We’ve done this in one iteration or another now for about a decade, but an ongoing project (also astronomical in nature) has consumed most of our writing hours… but we recently realized that we can still take stock in what’s in the sky for the year ahead, and give you a sneak peek at part of our project for the end of 2018.

The Rules:

What we’ve constructed is a simple three month strip chart denoting the top astronomical events by date. The big idea was to make a latitude independent version of the familiar hourglass chart, and distill the events down to the very best.

For the top events listed below for the entire year, we considered:

Meteor showers with a ZHR greater than 10, where the phase of the Moon is not within a week of Full;

-Oppositions of the outer planets;

-Elongations of the inner planets;

Eclipses of the Sun and Moon;

-The closest conjunction of two naked eye planets for 2018;

-The best easily visible occultation of a bright star and a planet for 2018;

Comets slated to reach perihelion in 2018 and forecast to break +10th magnitude.

The Best of 2018: (events in bold are the “best of the best”)

-Meteor Showers: Lyrids (April 22), Daytime Arietids (June 7), Perseids (Aug 12), Draconid Outburst? (Oct 8) Orionids (Oct 10), Andromedids (Dec 3), Geminids (Dec 14).

-Oppositions: Mars (Jul 27), Jupiter (May 8), Saturn (Jun 27), Uranus (Oct 23), Neptune (Sep 7), Pluto (Jul 12)

-Elongations: Mercury (Jan 1, Mar, 15, Apr 29, Jul 12, Aug 26, Nov 6, Dec 15). Venus (Aug 17)

-Eclipses: A Total Lunar eclipse for Asia, Australia the Pacific and western North America (Jan 31), a partial solar for the southern tip of South America (Feb 15), a partial solar for Tasmania and southernmost Australia (Jul 13), a total lunar for South America, Europe, Africa, Australia and Asia (Jul 27), and a partial solar for Scandinavia and northern Asia (Aug 11),

-Closest conjunctions: Mars-Jupiter (January 7)

-Best occultation (planet): Mars for the southern tip of South America (Nov 16). The Moon occults 4 planets in 2018: Mercury (2), Mars (1), Venus (1), and Saturn (1)

-Best occultation (star): Aldebaran for northern Asia and Europe (Feb 23) The Moon occults Aldebaran 9 times and Regulus 5 times in 2018.

-Periodic Comets over magnitude +10 with perihelion dates: C/2016 M1 PanSTARRS (Aug 10, +9), C/2016 R2 PanSTARRS (May 9, mag +9), C/2017 S3 PanSTARRS (Aug 16, +4), 21P/Giacobini-Zinner (Sep 10, mag +4), 38P/Stephan-Oterma (Nov 11, mag +9), 46P/Wirtanen (Dec 13, mag +3)

The astronomical strip chart for the first 3 months of 2018:

Astronomical events for Jan-Mar 2018 (click the chart to see the full-sized version).

What’s Up for January-March 2018:

-The month of January 2018 kicks off with a Full Moon on the night of January 1-2, the first of two Full Moons in the month, the second of which is sometimes referred to as a Blue Moon. March 2018 also contains two Full Moons (March 2 and March 31), while the 28 day month of February lacks a Full Moon, the only month that can do so.

The Moon also continues its cycle of occultations of the bright stars Regulus and Aldebaran, favoring the following locations;

January 5- Regulus (Northern North America)

January 27-Aldebaran (Northern Pacific)

February 1- Regulus (NE Asia)

February 23- Aldebaran (northern Europe/northern Asia)

March 1-Regulus (North Atlantic)

March 22-Aldebaran (North Atlantic)

March 28-Regulus (NE Asia/Alaska)

The Moon also occults Mercury for NW North America (in the daytime) on February 15th, then Venus just 22 hours later favoring the southern tip of South America (in the daytime), though both events are too close to the Sun to observe.

The first of two eclipse seasons for 2018 also begins in January, with a total lunar eclipse centered over the Pacific Ocean and surrounding regions on January 31st and a 60% partial solar eclipse for the southern tip of South America on February 15.

Venus reaches superior conjunction on January 9th, and moves into the dusk sky for a brilliant dusk apparition later in 2018. Mercury reaches greatest elongation 23 degrees west of the Sun in the dawn sky on January 2, then reaches superior conjunction on the farside of the Sun on February 17 before catching up with Venus and passing just 66′ from it on March 4.

Mars, Jupiter and Saturn remain dawn objects through the first quarter of 2018, with Mars passing just 12′ from Jupiter on January 12.

Let us know what you think, as this quarterly product is very much a work in progress… we plan on bringing you the quarterly astronomical graphic chart here on Universe Today every three months.

We’re looking forward to bringing you another great year of sky watching in 2018!

In Preparation for its Inaugural Launch, the Falcon Heavy Receives its Special Cargo – Musk’s Tesla Roadster!

Elon Musk's Tesla Roadster being loaded aboard the Falcon Heavy's payload capsule. Credit: SpaceX

After years of preparation, SpaceX is gearing up for the inaugural launch of its Falcon Heavy rocket. As the name would suggest, this rocket is the heaviest launch vehicle in the SpaceX arsenal. With a payload capacity of 54 metric tons (119,000 lbs), it can lift over twice as much weight of the next heaviest launch vehicle (the ULA’s Delta IV Heavy). And in time, SpaceX hopes to use this rocket to send astronauts into orbit, to the Moon, and on to Mars.

Basically, the Falcon Heavy is integral to SpaceX’s mission to usher in an age of affordable space travel and restoring domestic launch capability to the United States. With the inaugural launch scheduled to take place no earlier than January of 2018, the company is currently putting the final touches on the rocket. This includes releasing pictures of the payload which will be sent into space, which is none other than Elon Musk’s own cherry-red Tesla Roadster.

The inaugural launch will take place at SpaceX’s Launch Complex 39A, which is located at the Kennedy Space Center in Florida. This same launch pad was where the historic Apollo 11 mission launched from on July 16th, 1969, sending the first astronauts to the Moon. After it launches, the rocket will send send a payload into a heliocentric solar orbit, which will put it at a distance that is about the same as Mars’ distance from the Sun.

In addition, the company will use this inaugural launch to attempt a landing of all three of the Falcon 9 engine cores, which make up the first stage of the Falcon Heavy. In the past, the company has demonstrated its ability to successfully land the first stages of Falcon 9 rockets on land and at sea. However, this will be the first time that multiple cores are recovered from a single launch.

It will also demonstrate that SpaceX is capable of reusing all stages of a heavy launch, bringing it a step closer to fulfilling its promise to reduce costs by developing fully-reusable rockets. Two of the rocket cores will land at Cape Canaveral Air Force Station while the third will land on SpaceX’s drone ship (Of Course I Still Love You) out in the Atlantic Ocean.

NASA is also offering offering viewing opportunities of the launch to the public at the Kennedy Space Center Visitor Complex. In the past, Musk has proposed sending some truly odd things into space, including a wheel of cheese. On December 1st of this year, Musk tweeted that for this momentous occasion, the special cargo would be one of his very own electric cars. As he posted on Twitter:

The Tesla Roadster being loaded into the payload fairing. Credit: SpaceX

Last week, SpaceX released photos of the Tesla Roadster being loaded aboard the rocket’s payload fairing. Forthe purposes of launching it into space, the Roadster has been mounted on a special adapter structure, which are typically used when launching satellites into orbit. The photos also showed the Roadster being enclosed inside the rocket’s payload fairing, which will carry the car into space and place it at its heliocentric orbit.

Musk naturally avoided making any predictions about the launch, saying only that the launch was “Guaranteed to be exciting, one way or another.” However, when asked about his choice of cargo, Musk was both candid and cheeky in his response, tweeting:

“I love the thought of a car drifting apparently endlessly through space and perhaps being discovered by an alien race millions of years in the future.”

One can only imagine what they will conclude about humans. Perhaps that they were are both environmentally friendly and pretty flashy! While the exact date of the launch is still yet to be determined, Musk is certainly correct in predicting that it will be an exciting event. Given the sheer significance of this flight, the eyes of the world will be firmly fixed on Launch Complex 39A when it does take place.

Good luck SpaceX! And good luck to you too little Roadster!

Further Reading: Kennedy Space Center, Spaceflight Now, SpaceX

Mysterious Filament is Stretching Down Towards the Milky Way’s Supermassive Black Hole

A radio image from the NSF’s Karl G. Jansky Very Large Array showing the center of our galaxy. The mysterious radio filament is the curved line located near the center of the image, & the supermassive black hole Sagittarius A* (Sgr A*), is shown by the bright source near the bottom of the image. Credit: NSF/VLA/UCLA/M. Morris et al.

The core of the Milky Way Galaxy has always been a source of mystery and fascination to astronomers. This is due in part to the fact that our Solar System is embedded within the disk of the Milky Way – the flattened region that extends outwards from the core. This has made seeing into the bulge at the center of our galaxy rather difficult. Nevertheless, what we’ve been able to learn over the years has proven to be immensely interesting.

For instance, in the 1970s, astronomers became aware of the Supermassive Black Hole (SMBH) at the center of our galaxy, known as Sagittarius A* (Sgr A*). In 2016, astronomers also noticed a curved filament that appeared to be extending from Sgr A*. Using a pioneering technique, a team of astronomers from the Harvard-Smithsonian Center for Astrophysics (CfA) recently produced the highest-quality images of this structure to date.

The study which details their findings, titled “A Nonthermal Radio Filament Connected to the Galactic Black Hole?“, recently appeared in The Astrophysical Journal Letters. In it, the team describes how they used the National Radio Astronomy Observatory’s (NRAO) Very Large Array to investigate the non-thermal radio filament (NTF) near Sagittarius A* – now known as the Sgr A West Filament (SgrAWF).

Detection of an unusually bright X-Ray flare from Sagittarius A*, a supermassive black hole in the center of the Milky Way galaxy. Credit: NASA/CXC/Stanford/I. Zhuravleva et al.

As Mark Morris – a professor of astronomy at the UCLA and the lead authority the study – explained in a CfA press release:

“With our improved image, we can now follow this filament much closer to the Galaxy’s central black hole, and it is now close enough to indicate to us that it must originate there. However, we still have more work to do to find out what the true nature of this filament is.”

After examining the filament, the research team came up with three possible explanations for its existence. The first is that the filament is the result of inflowing gas, which would produce a rotating, vertical tower of magnetic field as it approaches and threads Sgr A*’s event horizon. Within this tower, particles would produce radio emissions as they are accelerated and spiral in around magnetic field lines extending from the black hole.

The second possibility is that the filament is a theoretical object known as a cosmic string. These are basically long, extremely thin cosmic structures that carry mass and electric currents that are hypothesized to migrate from the centers of galaxies. In this case, the string could have been captured by Sgr A* once it came too close and a portion crossed its event horizon.

The third and final possibility is that there is no real association between the filament and Sgr A* and the positioning and direction it has shown is merely coincidental. This would imply that there are many such filaments in the Universe and this one just happened to be found near the center of our galaxy. However, the team is confident that such a coincidence is highly unlikely.

Labelled image of the center of our galaxy, showing the mysterious radio filament & the supermassive black hole Sagittarius A* (Sgr A*). Credit: NSF/VLA/UCLA/M. Morris et al.

As Jun-Hui Zhao of the Harvard-Smithsonian Center for Astrophysics in Cambridge, and a co-author on the paper, said:

“Part of the thrill of science is stumbling across a mystery that is not easy to solve. While we don’t have the answer yet, the path to finding it is fascinating. This result is motivating astronomers to build next generation radio telescopes with cutting edge technology.”

All of these scenarios are currently being investigated, and each poses its own share of implications. If the first possibility is true – in which the filament is caused by particles being ejected by Sgr A* – then astronomers would be able to gleam vital information about how magnetic fields operate in such an environment. In short, it could show that near an SMBH, magnetic fields are orderly rather than chaotic.

This could be proven by examining particles farther away from Sgr A* to see if they are less energetic than those that are closer to it. The second possibility, the cosmic string theory, could be tested by conducting follow-up observations with the VLA to determine if the position of the filament is shifting and its particles are moving at a fraction of the speed of light.

If the latter should prove to be the case, it would constitute the first evidence that theoretical cosmic strings actually exists. It would also allow astronomers to conduct further tests of General Relativity, examining how gravity works under such conditions and how space-time is affected. The team also noted that, even if the filament is not physically connected to Sgr A*, the bend in the filament is still rather telling.

In short, the bend appears to be coincide with a shock wave, the kind that would be caused by an exploding star. This could mean that one of the massive stars which surrounds Sgr A* exploded in proximity to the filament in the past, producing the necessary shock wave that altered the course of the inflowing gas and its magnetic field. All of these mysteries will be the subject of follow-up surveys conducted with the VLA.

As co-author Miller Goss from the National Radio Astronomy Observatory in New Mexico (and a co-author on the study) said, “We will keep hunting until we have a solid explanation for this object. And we are aiming to next produce even better, more revealing images.”

Further Reading: CfA, AJL

Just a Billion Years After the Earth Formed, Life had Already Figured out Plenty of Tricks

J. William Schopf and colleagues from UCLA and the University of Wisconsin analyzed the microorganisms with cutting-edge technology called secondary ion mass spectroscopy. Credit: John Vande Wege/UCLA

Life on Earth has had a long and turbulent history. Scientists estimate that roughly 4 billion years ago, just 500 million years after planet Earth formed, the first single-celled lifeforms arose. By the Archean Eon (4 to 2.5 billion years ago), multi-celled lifeforms are believed to have emerged. While the existence of such organisms (Archaea) has been inferred from carbon isotopes found in ancient rocks, fossil evidence has remained elusive.

All of that has changed, thanks to a recent study performed by a team of researchers from UCLA and the University of Wisconsin–Madison. After examining ancient rock samples from Western Australia, the team determined that they contained the fossilized remains of diverse organisms that are 3.465 billion years old. Combined with the recent spate of exoplanet discoveries, this study strengthens the theory that life is plentiful in the Universe.

The study, titled “SIMS analyses of the oldest known assemblage of microfossils document their taxon-correlated carbon isotope compositions“, recently appeared in the Proceedings of the National Academy of Sciences. As the research team indicated, their study consisted of a carbon isotope analysis of 11 microbial fossils taken from the ~3,465-million-year-old Western Australian Apex Chert.

Apex chert in Western Australia, where the 3.465 billion year old fossils were found. Credit: John Valley/UW-Madison

These 11 fossils were diverse in nature and the researchers divided them into five species groups based on their apparent biological functions. Whereas two of the fossil samples appear to have performed a primitive form of photosynthesis, another apparently produced methane gas. The remaining two appear to have been methane-consumers, which they used to build and maintain their cell walls (much like how mammals use fat).

As J. William Schopf – a professor of paleobiology in the UCLA College and the lead author on the study – indicated in a UCLA Newsroom press release:

“By 3.465 billion years ago, life was already diverse on Earth; that’s clear — primitive photosynthesizers, methane producers, methane users. These are the first data that show the very diverse organisms at that time in Earth’s history, and our previous research has shown that there were sulfur users 3.4 billion years ago as well.

This study, which is the most detailed ever conducted on microorganisms preserved as ancient fossils, builds on work that Schopf and his associates have been performing for over two decades. Back in 1993, Schopf and another team of researchers conducted a study that first described these types of fossils. This was followed in 2002 by another study which substantiated their biological origin.

In this latest study, Schopf and his team established what kind of organisms they are and how complex they are. To do this, they analyzed the microorganisms using a technique called Secondary Ion Mass Spectroscopy (SIMS), which reveals the ratio of carbon-12 to carbon-13. Whereas carbon-12 is stable and the most common type found in nature, carbon-13 is a less common but similarly stable isotope that is used in organic chemistry research.

A microorganism analyzed by the researchers. Credit: J. William Schopf/UCLA

By separating the carbon from each fossil into its constituent isotopes and determining their ratios, the team was able to conclude how long ago the microorganisms lived, as well as how they lived. This task was performed by the Wisconsin researchers, who were led by professor John Valley. “The differences in carbon isotope ratios correlate with their shapes,” said Valley. “Their C-13-to-C-12 ratios are characteristic of biology and metabolic function.”

According to the current scientific consensus, advanced photosynthesis had not yet evolved and oxygen would not appear on Earth until 500 million years later. By 2 billion year ago, concentrations of oxygen gas began increasing rapidly. This means that these fossils, being around roughly 1 billion years after Earth formed, would have lived at a time when their was little oxygen in the atmosphere.

Given that oxygen would be poisonous to these types of primitive photosynthesizers, they are quite rare today. In truth, they can only be found in places where there is sufficient light but no oxygen, something which is rarely found in combination. What’s more, the rocks themselves were a source of great interest since the average lifespan of rock exposed to the surface of Earth is only about 200 million years.

When Shopf first began his career, the oldest-known rock samples were 500 million years old. This means that the fossil-bearing rocks he and his team examined are as old as rocks on Earth can get. To find fossilized life in such ancient samples demonstrates that diverse organisms and a life cycle had already evolved on Earth by the early Archaen Eon, something which scientists only suspected up until this point.

In the future, SIMS technology could be used to look for signs of fossilized life on Mars. Credit: NASA/JPL)

These findings naturally have implications for the study of how and when life emerged on Earth. Beyond Earth, the study also has implications since it demonstrates that life emerged when Earth was still very young and in a primitive state. It is therefore not unlikely that a similar process has been taking place elsewhere in the Universe. As Schopf explained:

“This tells us life had to have begun substantially earlier and it confirms that it was not difficult for primitive life to form and to evolve into more advanced microorganisms. But, if the conditions are right, it looks like life in the universe should be widespread.”

This study was made possible thanks to funding provided by the NASA Astrobiology Institute. Looking to the future, Schopf indicated that the same technology used to date these fossils will likely be used to study rocks brought back by NASA’s crewed mission to Mars. Scheduled for the 2030s, this mission will entail retrieving samples obtained by the Mars 2020 Rover and bringing them back to Earth for analysis.

Further Reading: UCLA, PNAS