This is a Photo of Neptune, From the Ground! ESO’s New Adaptive Optics Makes Ground Telescopes Ignore the Earth’s Atmosphere

This image of the planet Neptune was obtained during the testing of the Narrow-Field adaptive optics mode of the MUSE/GALACSI instrument on ESO’s Very Large Telescope. The corrected image is sharper than a comparable image from the NASA/ESA Hubble Space Telescope. Credit: ESO/P. Weilbacher (AIP)

In 2007, the European Southern Observatory (ESO) completed work on the Very Large Telescope (VLT) at the Paranal Observatory in northern Chile. This ground-based telescope is the world’s most advanced optical instrument, consisting of four Unit Telescopes with main mirrors (measuring 8.2 meters in diameter) and four movable 1.8-meter diameter Auxiliary Telescopes.

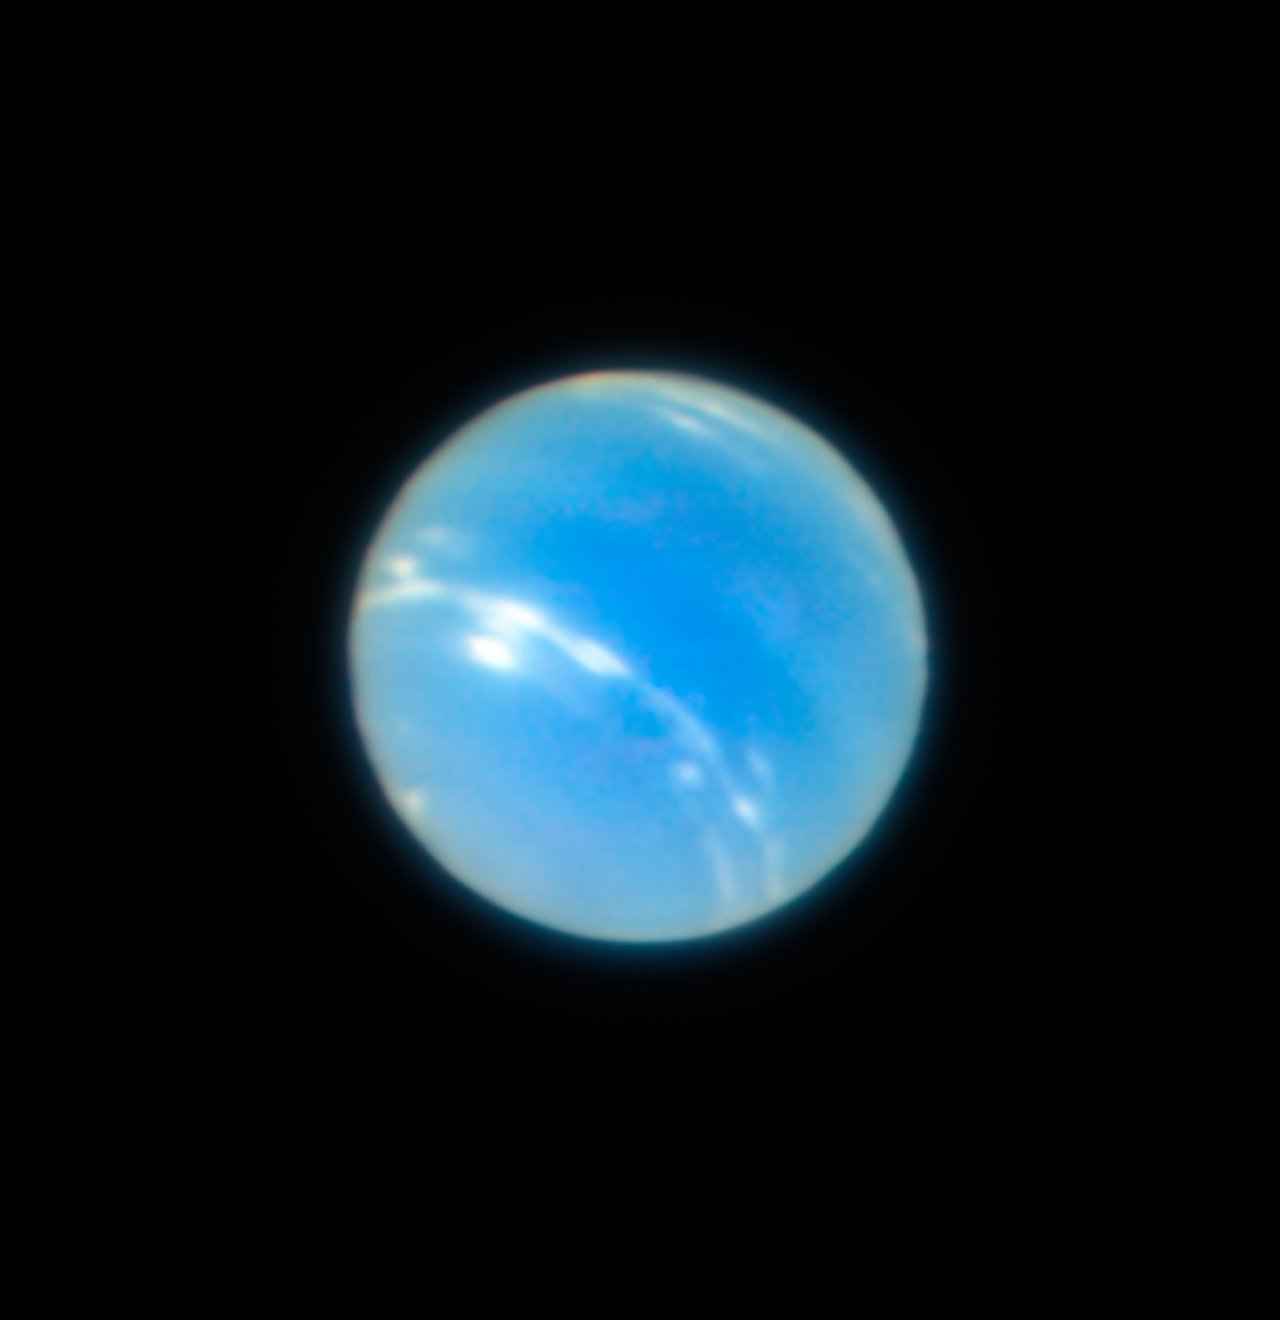
Recently, the VLT was upgraded with a new instrument known as the Multi Unit Spectroscopic Explorer (MUSE), a panoramic integral-field spectrograph that works at visible wavelengths. Thanks to the new adaptive optics mode that this allows for (known as laser tomography) the VLT was able to recently acquire some images of Neptune, star clusters and other astronomical objects with impeccable clarity.

In astronomy, adaptive optics refers to a technique where instruments are able to compensate for the blurring effect caused by Earth’s atmosphere, which is a serious issue when it comes to ground-based telescopes. Basically, as light passes through our atmosphere, it becomes distorted and causes distant objects to become blurred (which is why stars appear to twinkle when seen with the naked eye).

Images of the planet Neptune obtained during the testing of the Narrow-Field adaptive optics mode of the MUSE/GALACSI instrument on ESO’s Very Large Telescope. Credit: ESO/P. Weilbacher (AIP

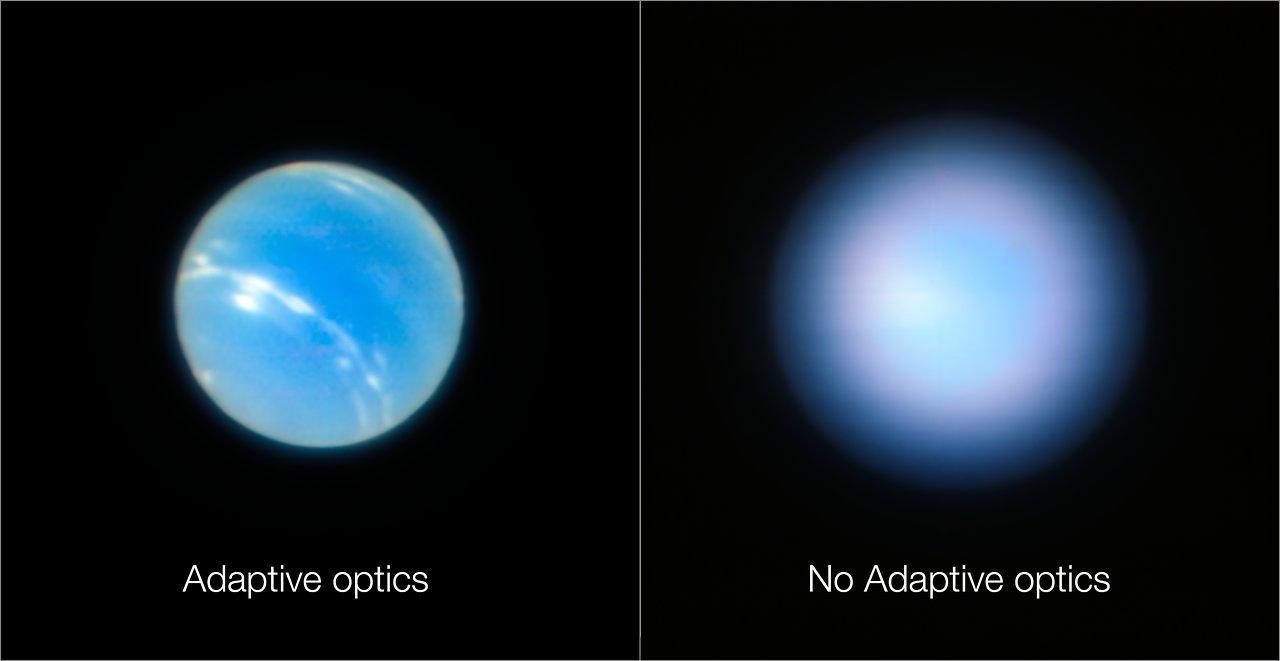
One solution to this problem is to deploy telescopes into space, where atmospheric disturbance is not an issue. Another is to rely on advanced technology that can artificially correct for the distortions, thus resulting in much clearer images. One such technology is the MUSE instrument, which works with an adaptive optics unit called a GALACSI – a subsystem of the Adaptive Optics Facility (AOF).

The instrument allows for two adaptive optics modes – the Wide Field Mode and the Narrow Field Mode. Whereas the former corrects for the effects of atmospheric turbulence up to one km above the telescope over a comparatively wide field of view, the Narrow Field mode uses laser tomography to correct for almost all of the atmospheric turbulence above the telescope to create much sharper images, but over a smaller region of the sky.

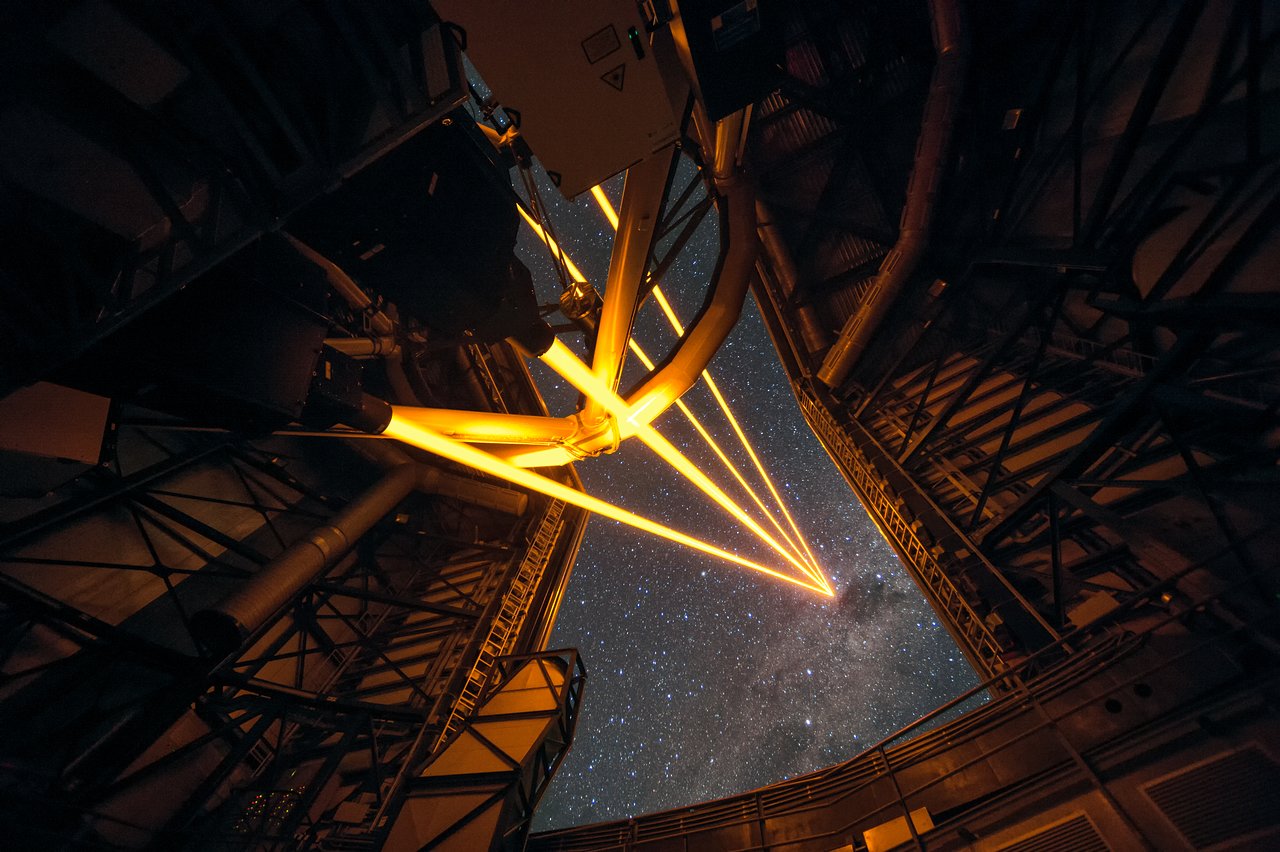
This consists of four lasers that are fixed to the fourth Unit Telescope (UT4) beaming intense orange light into the sky, simulating sodium atoms high in the atmosphere and creating artificial “Laser Guide Stars”. Light from these artificial stars is then used to determine the turbulence in the atmosphere and calculate corrections, which are then sent to the deformable secondary mirror of the UT4 to correct for the distorted light.

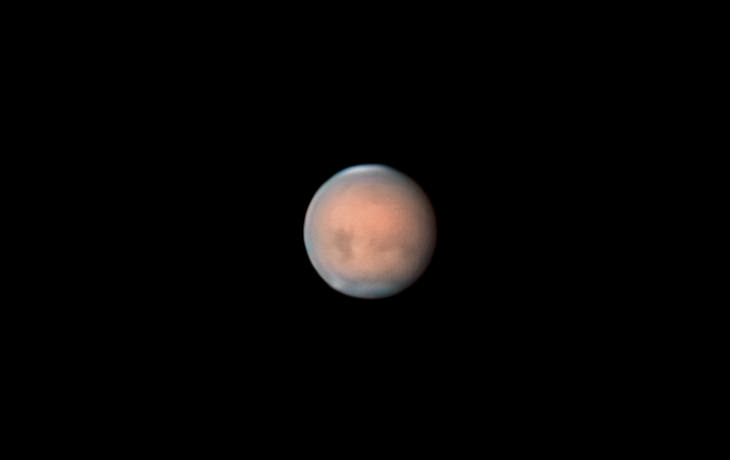
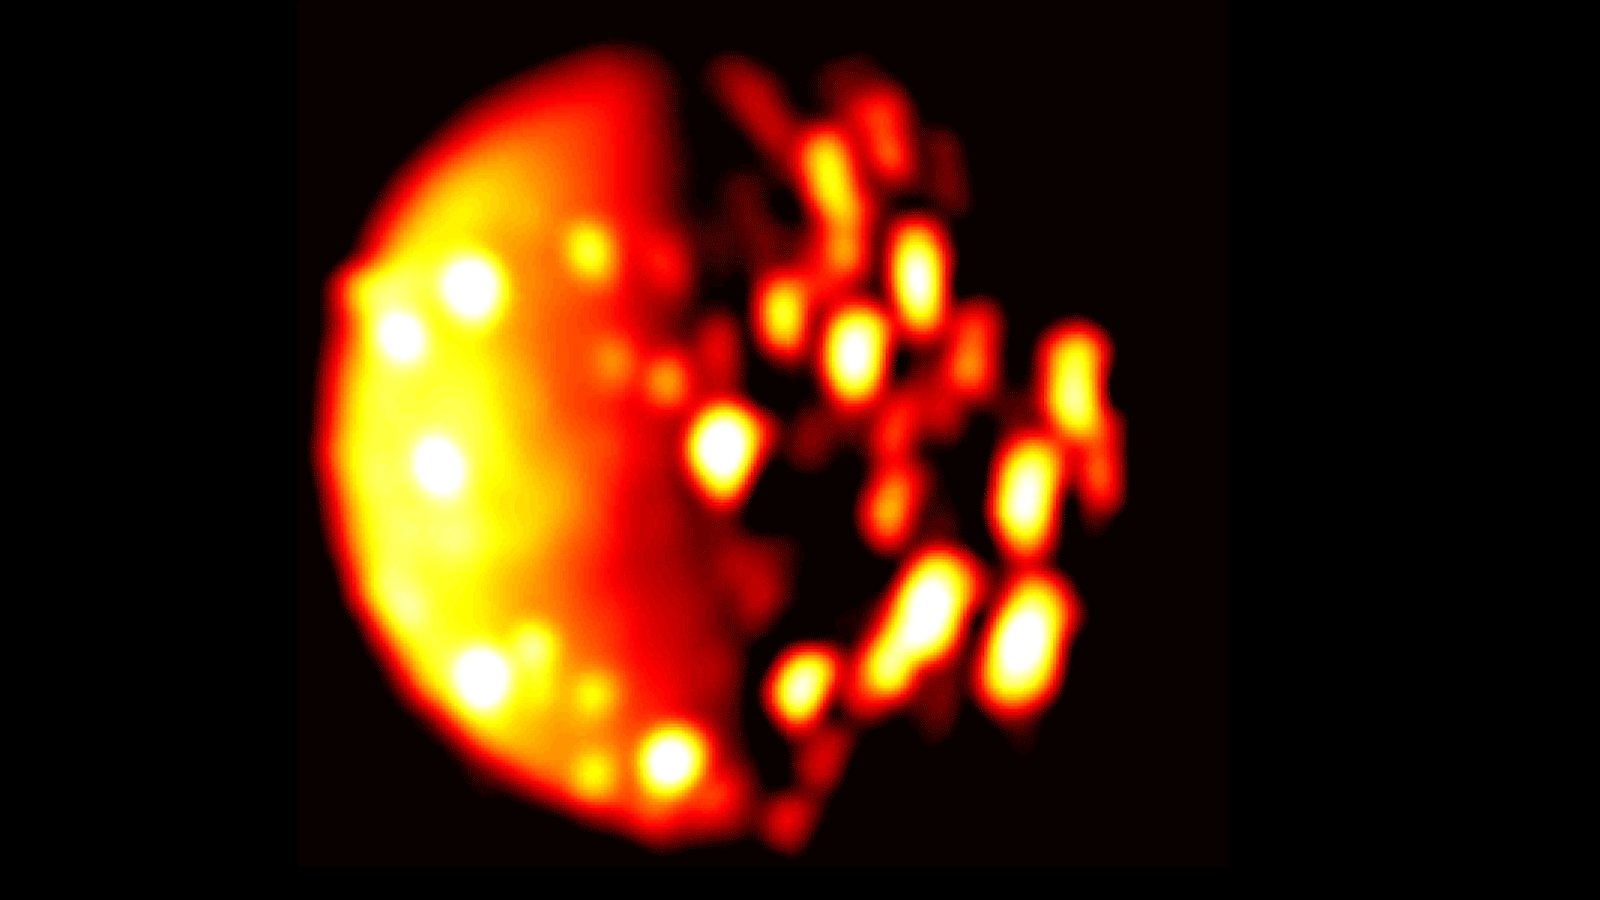
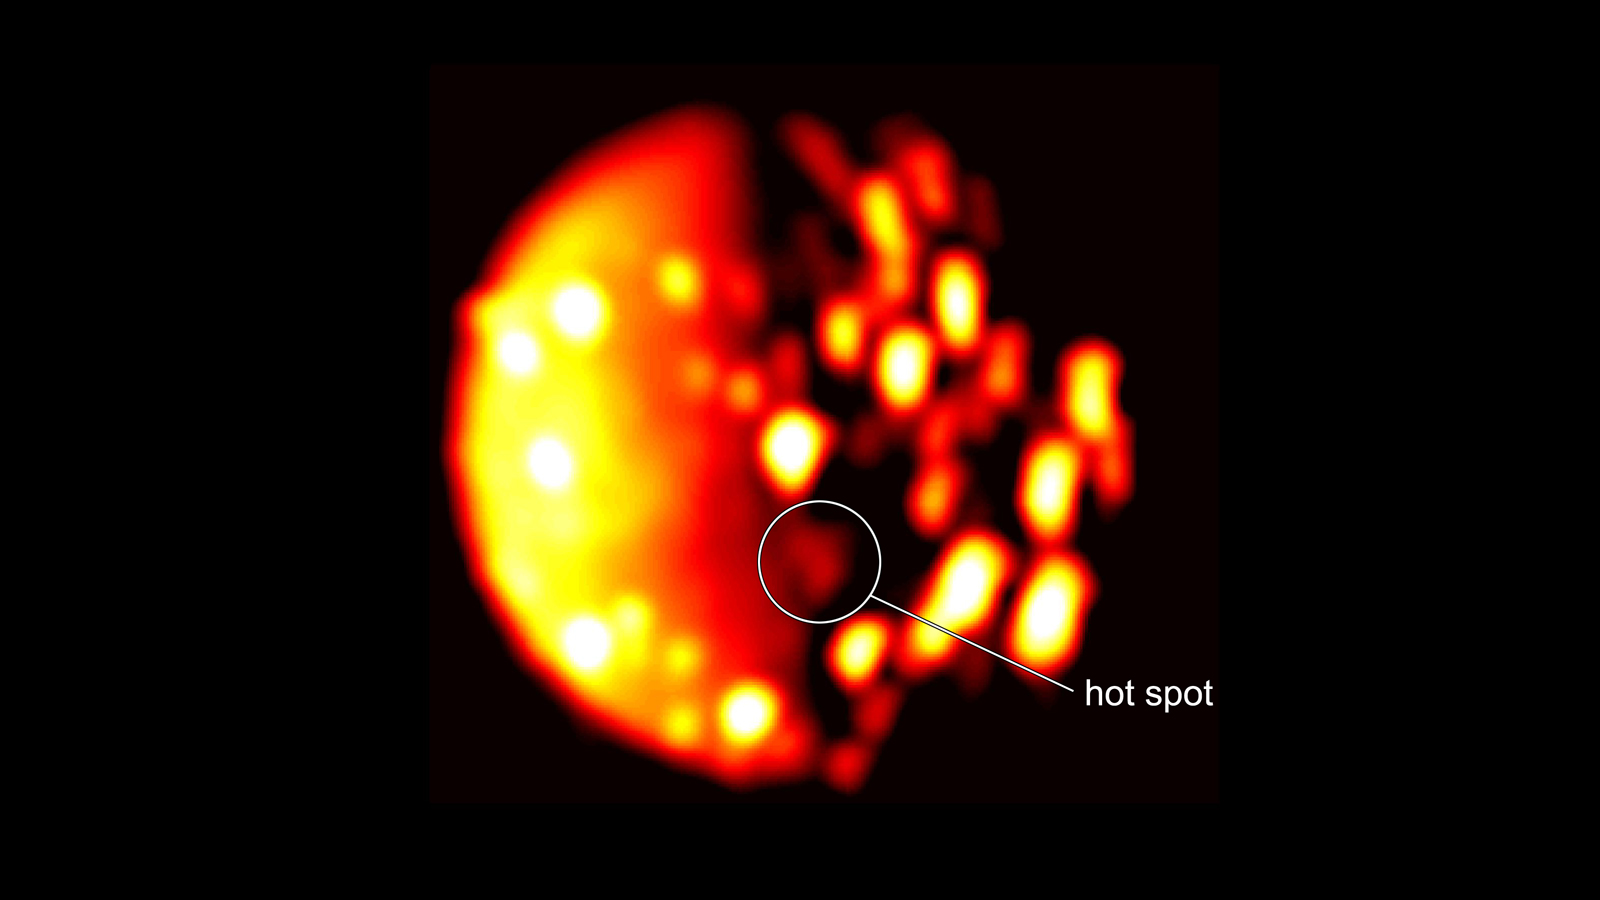
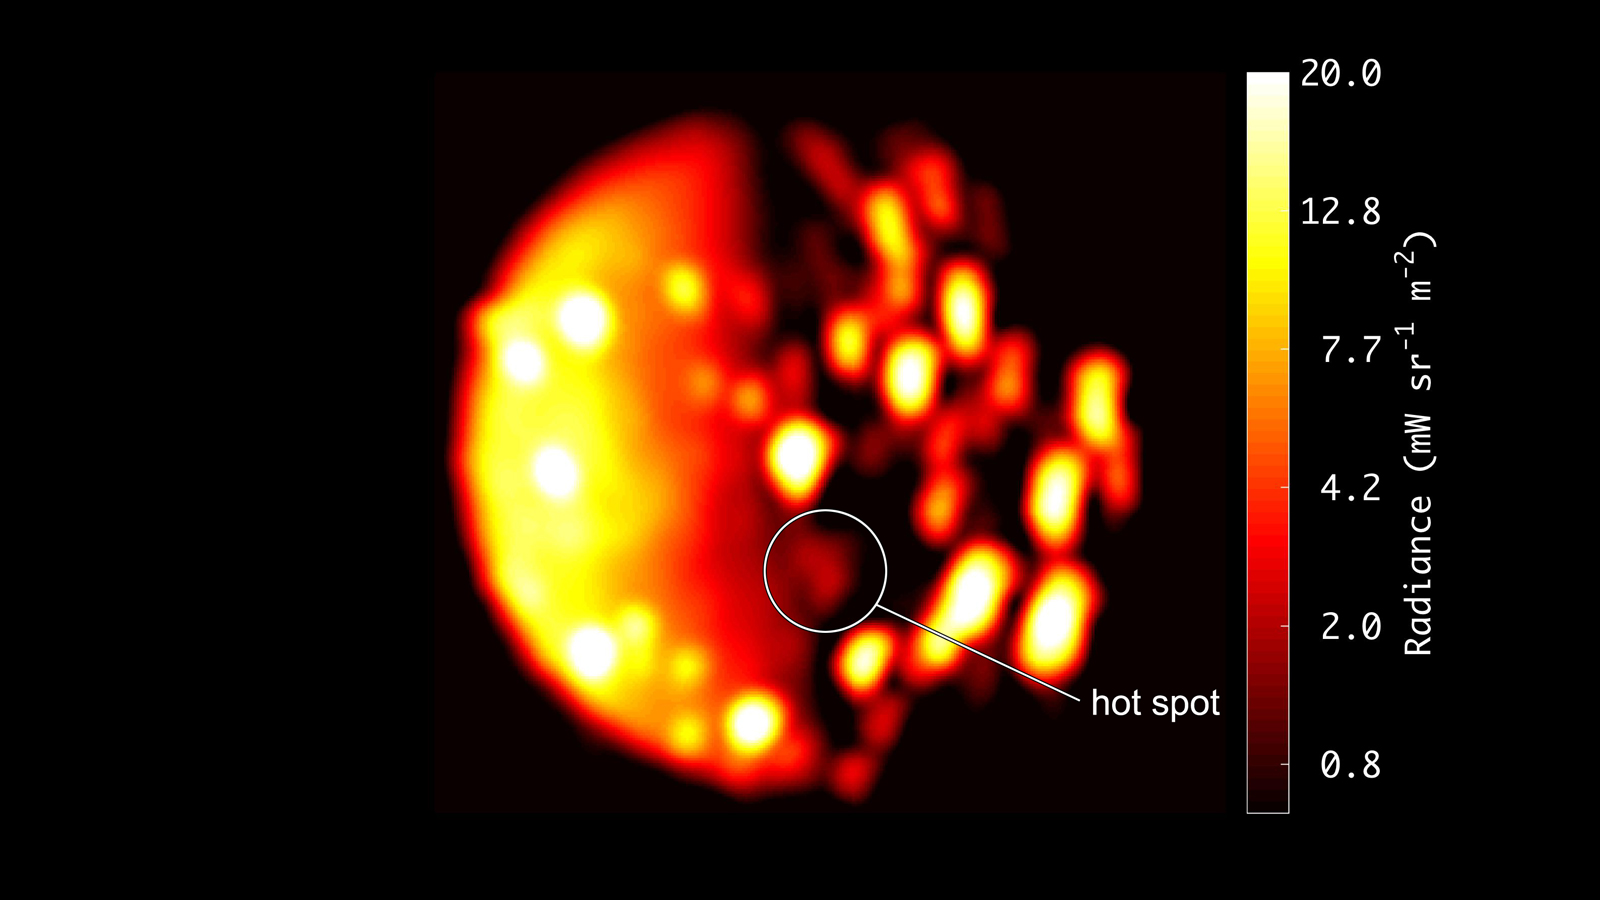
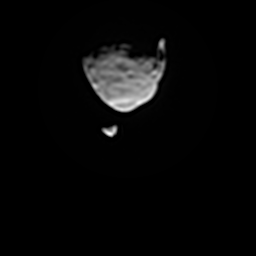
Using this Narrow Field Mode, the VLT was able to capture remarkably sharp test images of the planet Neptune, distant star clusters (such as the globular star cluster NGC 6388), and other objects. In so doing, the VLT demonstrated that its UT4 mirror is able to reach the theoretical limit of image sharpness and is no longer limited by the effects of atmospheric distortion.

The most powerful laser guide star system in the world sees first light at the Paranal Observatory. Credit: ESO

This essentially means that it is now possible for the VLT to capture images from the ground that are sharper than those taken by the Hubble Space Telescope. The results from UT4 will also help engineers to make similar adaptations to the ESO’s Extremely Large Telescope (ELT), which will also rely on laser tomography to conduct its surveys and accomplish its scientific goals.

These goals include the study of supermassive black holes (SMBHs) at the centers of distant galaxies, jets from young stars, globular clusters, supernovae, the planets and moons of the Solar System, and extra-solar planets. In short, the use of adaptive optics – as tested and confirmed by the VLT’s MUSE – will allow astronomers to use ground-based telescopes to study the properties of astronomical objects in much greater detail than ever before.

In addition, other adaptive optics systems will benefit from work with the Adaptive Optics Facility (AOF) in the coming years. These include the ESO’s GRAAL, a ground layer adaptive optics module that is already being used by  the Hawk-I infrared wide-field imager. In a few years, the powerful Enhanced Resolution Imager and Spectrograph (ERIS) instrument will also be added to the VLT.

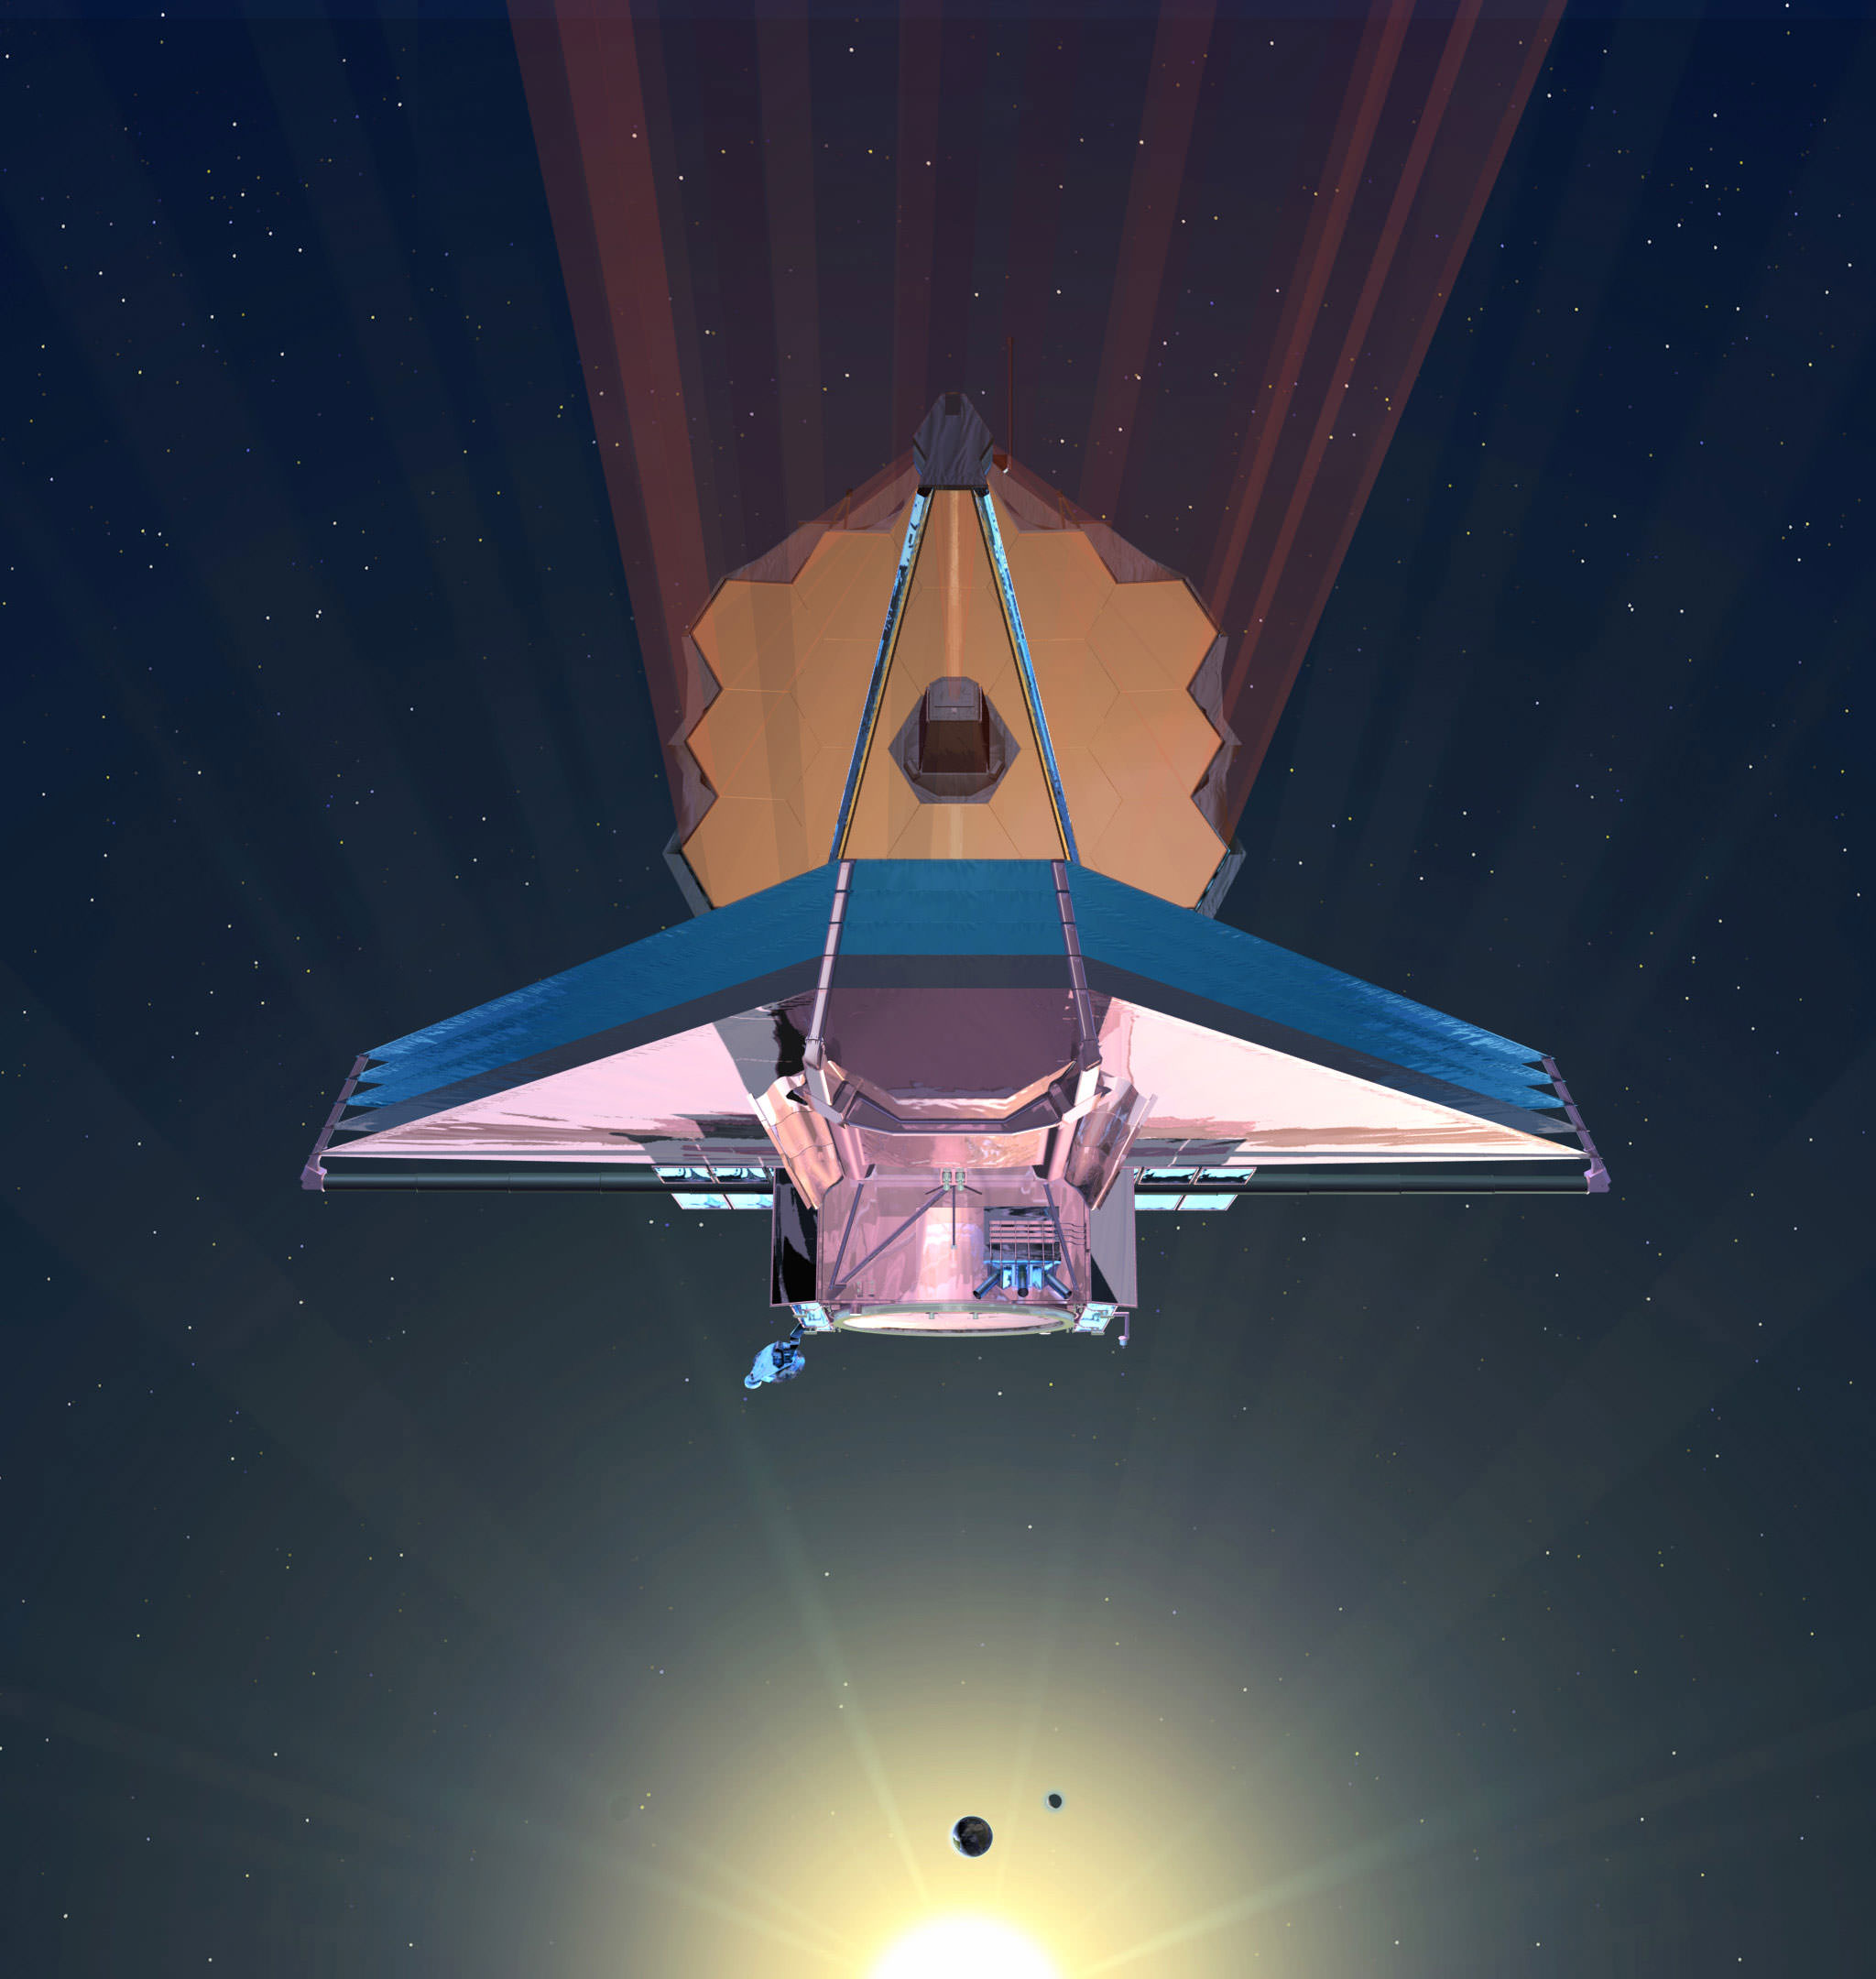
Between these upgrades and the deployment of next-generation space telescopes in the coming years (like the James Webb Space Telescope, which will be deploying in 2021), astronomers expect to bringing a great deal more of the Universe “into focus”. And what they see is sure to help resolve some long-standing mysteries, and will probably create a whole lot more!

And be sure to enjoy these videos of the images obtained by the VLT of Neptune and NGC 6388, courtesy of the ESO:

Further Reading: ESO

This Stunning Photo Shows the Martian Dust Storm as it was Just Getting Going

True color image of a storm front located near Utopia Planitia, near the northern polar ice cap of Mars. Credit: Credits: ESA/DLR/FU Berlin

The weather patterns on Mars are rather fascinating, owing to their particular similarities and differences with those of Earth. For one, the Red Planet experiences dust storms that are not dissimilar to storms that happen regularly here on Earth. Due to the lower atmospheric pressure, these storms are much less powerful than hurricanes on Earth, but can grow so large that they cover half the planet.

Recently, the ESA’s Mars Express orbiter captured images of the towering cloud front of a dust storm located close to Mars’ northern polar region. This storm, which began in April 2018, took place in the region known as Utopia Planitia, close to the ice cap at the Martian North Pole. It is one of several that have been observed on Mars in recent months, one which is the most severe to take place in years.

The images (shown above and below) were created using data acquired by the Mars ExpressHigh Resolution Stereo Camera (HRSC). The camera system is operated by the German Aerospace Center (DLR), and managed to capture images of this storm front – which would prove to be the harbinger of the Martian storm season – on April 3rd, 2018, during its 18,039th orbit of Mars.

Anaglyph 3D image of the dust storm front forming above the subpolar plains in northern Mars. Credit: Credits: ESA/DLR/FU Berlin

This storm was one of several small-scale dust storms that have been observered in recent months on Mars. A much larger storm emerged further southwest in the Arabia Terra region, which began in May of 2018 and developed into a planet-wide dust storm within several weeks.

Dust storms occur on Mars when the southern hemisphere experiences summer, which coincides with the planet being closer to the Sun in its elliptical orbit. Due to increased temperatures, dust particles are lifted higher into the atmosphere, creating more wind. The resulting wind kicks up yet more dust, creating a feedback loop that NASA scientists are still trying to understand.

Since the southern polar region is pointed towards the Sun in the summer, carbon dioxide frozen in the polar cap evaporates. This has the effect of thickening the atmosphere and increases surface pressure, which enhances the storms by helping to suspend dust particles in the air. Though they are common and can begin suddenly, Martian dust storms typically stay localized and last only a few weeks.

While local and regional dust storms are frequent, only a few of them develop into global phenomena. These storms only occur every three to four Martian years (the equivalent of approximately 6 to 8 Earth years) and can persist for several months. Such storms have been viewed many times in the past by missions like Mariner 9 (1971), Viking I (1971) and the Mars Global Surveyor (2001).

This global map of Mars shows a growing dust storm as of June 6, 2018. The map was produced by the Mars Color Imager (MARCI) camera on NASA’s Mars Reconnaissance Orbiter spacecraft. The blue dot indicates the approximate location of Opportunity. Image Credit: NASA/JPL-Caltech/MSSS

In 2007, a large storm covered the planet and darkened the skies over where the Opportunity rover was stationed – which led to two weeks of minimal operations and no communications. The most recent storm, which began back in May, has been less intense, but managed to create a state of perpetual night over Opportunity’s location in Perseverance Valley.

As a result, the Opportunity team placed the rover into hibernation mode and shut down communications in June 2018. Meanwhile, NASA’s Curiosity rover continues to explore the surface of Mars, thanks to its radioisotope thermoelectric generator (RTG), which does not rely on solar panels. By autumn, scientists expect the dust storm will weaken significantly, and are confident Opportunity will survive.

According to NASA, the dust storm will also not affect the landing of the InSight Lander, which is scheduled to take place on November 26th, 2018. In the meantime, this storm is being monitored by all five active ESA and NASA spacecraft around Mars, which includes the 2001 Mars Odyssey, the Mars Reconnaissance Orbiter, the Mars Atmosphere and Volatile EvolutioN (MAVEN), the Mars Express, and the Exomars Trace Gas Orbiter.

Understanding how global storms form and evolve on Mars will be critical for future solar-powered missions. It will also come in handy when crewed missions are conducted to the planet, not to mention space tourism and colonization!

Further Reading: DLR

Twelve New Moons Discovered Around Jupiter, and One of Them is Pretty Odd!

Illustration of Jupiter and the Galilean satellites. Credit: NASA

The gas giant Jupiter, which was named in honor of the king of the gods in the Roman pantheon, has always lived up to its name. In addition to being the largest planet in the Solar System – with two and a half times the mass of all the other planets combined – it also has an incredibly powerful magnetic field and the most intense storms of any planet in the Solar System.

What’s more, it is home to some of the largest moons in the Solar System (known as the Galilean Moons), and has more known moons than any other planet. And thanks to a recent survey led by Scott S. Sheppard of the Carnegie Institution of Science, twelve more moons have been discovered. This brings the total number of known moons around Jupiter to 79, and could provide new insight into the history of the Solar System.

The team was led by Scott S. Sheppard and included Dave Tholen (University of Hawaii) and Chad Trujillo (Northern Arizona University). It was this same team that first suggested the existence of a massive planet in the outer reaches of the Solar System (Planet 9 or Planet X) in 2014, based on the unusual behavior of certain populations of extreme Trans-Neptunian Objects (eTNOs).

Artist’s impression of Jupiter’s moons, with the newly-discovered moons indicated in blue and red. Credit: Carnegie Institution of Science/Roberto Molar Candanosa

Curiously enough, it was while Sheppard and his colleagues were hunting for this elusive planet that they spotted the first of these new moons in 2017. As Sheppard explained in a recent Carnegie press release:

“Jupiter just happened to be in the sky near the search fields where we were looking for extremely distant Solar System objects, so we were serendipitously able to look for new moons around Jupiter while at the same time looking for planets at the fringes of our Solar System.”

The initial discoveries were made using the Blanco 4-meter telescope at the Cerro Tololo Inter-American Observatory (CTIO) in Chile. They were then confirmed with the help of the Dark Energy Camera (DECam), which was added to the Blanco telescope as past of the Dark Energy Survey. Additional data was provided by the Carnegie Observatories 6.5-meter Magellan Telescopes.

The orbits of the newly-discovered moons were then calculated by Gareth Williams of the International Astronomical Union’s Minor Planet Center (MPC), based on the team’s observations.  “It takes several observations to confirm an object actually orbits around Jupiter,” he said. “So, the whole process took a year.”

As you can see from the image above, two of the newly-discovered moons (indicated in blue) are part of the inner group that have prograde orbits (i.e. they orbit in the same direction as the planet’s rotation). They complete a single orbit in a little less than a year, and have similar orbital distances and angles of inclination. This is a possible indication that these moons are fragments of a larger moon that was broken apart, possibly due to a collision.

Nine of the new moons (indicated in red) are part of the distant outer group that have retrograde orbits, meaning they orbit in the opposite direction of Jupiter’s rotation. These moons take about two years to complete a single orbit of Jupiter and are grouped into three orbital groups that have similar distances and inclination. As such, they are also thought to be remnants of three larger moons that broke apart due to past collisions.

The team observed one other moon that does not fit into either group, and is unlike any known moon orbiting Jupiter. This “oddball moon” is more distant and more inclined than the prograde moons and takes about one and a half years to orbit Jupiter, which means its orbit crosses the outer retrograde moons. Because of this, head-on collisions are much more likely to occur with the retrograde moons, which are orbiting in the opposite direction.

The orbit of this oddball moon was also confirmed by Bob Jacobson and Marina Brozovic at NASA’s Jet Propulsion Laboratory in 2017. This was motivated in part to ensure that the moon would not be lost before it arrived at the predicted location in its orbit during the recovery observations made in 2018. As Sheppard explained,

“Our other discovery is a real oddball and has an orbit like no other known Jovian moon. It’s also likely Jupiter’s smallest known moon, being less than one kilometer in diameter…This is an unstable situation. Head-on collisions would quickly break apart and grind the objects down to dust.”

Caption: Recovery images of Valetudo from the Magellan telescope in May 2018. The moon can be seen moving relative to the steady state background of distant stars. Jupiter is not in the field but off to the upper left.

Here too, the team thinks that this moon could be the remains of a once-larger moon; in this case, one that had a prograde orbit that formed some of the retrograde moons through past collisions. The oddball moon already has a suggested name for it – Valetudo, after the Jupiter’s great-granddaughter, the goddess of health and hygiene in the Roman pantheon.

In addition to adding to Jupiter’s overall moon count, the study of what shaped these moon’s orbital histories could teach scientists a great deal about the earliest period of the Solar System. For instance, the fact that the smallest moons in Jupiter’s various orbital groups (prograde, retrograde) are still abundant suggests that the collisions that created them occurred after the era of planet formation.

According to the Nebular Hypothesis of Solar System formation, the Sun was still surrounded by a rotating protoplanetary disk at this time – i.e. the gas and dust from which the planets formed. Because of their sizes – 1 to 3 km – these moons would have been more influenced by surrounding gas and dust, which would have placed a drag on their orbits and caused them to fall inwards towards Jupiter.

The fact that these moons still exist shows that they likely formed after this gas and dust dissipated. In this respect, these moons are much like time capsules or geological records, preserving pieces of Jupiter’s (and the Solar Systems) history of formation and evolution.

This research was partially funded by a NASA Planetary Astronomy grant, and was made possible thanks to assistance by multiple observatories. These included the 4-meter Discovery Channel Telescope at Lowell Observatory Arizona, the 8-meter Subaru Telescope and the University of Hawaii’s 2.2 meter telescope, and the 8-meter Gemini Telescope in Hawaii.

Further Reading: Carnegie Institute of Science

NASA’s James Webb Space Telescope will Inspect the Atmospheres of Distant Gas Giants

Artist's impression of the Jupiter-size extrasolar planet, HD 189733b, being eclipsed by its parent star. Credits: ESA, NASA, M. Kornmesser (ESA/Hubble), and STScI

The James Webb Space Telescope is like the party of the century that keeps getting postponed. Due to its sheer complexity and some anomalous readings that were detected during vibration testing, the launch date of this telescope has been pushed back many times – it is currently expected to launch sometime in 2021. But for obvious reasons, NASA remains committed to seeing this mission through.

Once deployed, the JWST will be the most powerful space telescope in operation, and its advanced suite of instruments will reveal things about the Universe that have never before been seen. Among these are the atmospheres of extra-solar planets, which will initially consist of gas giants. In so doing, the JWST will refine the search for habitable planets, and eventually begin examining some potential candidates.

The JWST will be doing this in conjunction with the Transiting Exoplanet Survey Satellite (TESS), which deployed to space back in April of 2018. As the name suggests, TESS will be searching for planets using the Transit Method (aka. Transit Photometry), where stars are monitored for periodic dips in brightness – which are caused by a planet passing in front of them relative to the observer.

Artist Illustration of TESS and its 4 telescopes. Credit: NASA/MIT
Artist concept of the Transiting Exoplanet Survey Satellite and its 4 telescopes. Credit: NASA/MIT

Some of Webb’s first observations will be conducted through the Director’s Discretionary Early Release Science program –  a transiting exoplanet planet team at Webb’s science operation center. This team is planning on conducting three different types of observations that will provide new scientific knowledge and a better understanding of Webb’s science instruments.

As Jacob Bean of the University of Chicago, a co-principal investigator on the transiting exoplanet project, explained in a NASA press release:

“We have two main goals. The first is to get transiting exoplanet datasets from Webb to the astronomical community as soon as possible. The second is to do some great science so that astronomers and the public can see how powerful this observatory is.”

As Natalie Batalha of NASA Ames Research Center, the project’s principal investigator, added:

“Our team’s goal is to provide critical knowledge and insights to the astronomical community that will help to catalyze exoplanet research and make the best use of Webb in the limited time we have available.”

For their first observation, the JWST will be responsible for characterizing a planet’s atmosphere by examining the light that passes through it. This happens whenever a planet transits in front of a star, and the way light is absorbed at different wavelengths provides clues as to the atmosphere’s chemical composition. Unfortunately, existing space telescopes have not had the necessary resolution to scan anything smaller than a gas giant.

The JWST, with its advanced infrared instruments, will examine the light passing through exoplanet atmospheres, split it into a rainbow spectrum, and then infer the atmospheres’ composition based on which sections of light are missing. For these observations, the project team selected WASP-79b, a Jupiter-sized exoplanet that orbits a star in the Eridanus constellation, roughly 780 light-years from Earth.

The team expects to detect and measure the abundances of water, carbon monoxide, and carbon dioxide in WASP-79b, but is also hoping to find molecules that have not yet been detected in exoplanet atmospheres. For their second observation, the team will be monitoring a “hot Jupiter” known as WASP-43b, a planet which orbits its star with a period of less than 20 hours.

Like all exoplanets that orbit closely to their stars, this gas giant is tidally-locked – where one side is always facing the star. When the planet is in front of the star, astronomers are only able to see its cooler backside; but as it orbits, the hot day-side slowly comes into view. By observing this planet for the entirety of its orbit, astronomers will be able to observe those variations (known as a phase curve) and use the data to map the planet’s temperature, clouds, and atmospheric chemistry.

This data will allow them to sample the atmosphere to different depths and obtain a more complete picture of the planet’s internal structure. As Bean indicated:

“We have already seen dramatic and unexpected variations for this planet with Hubble and Spitzer. With Webb we will reveal these variations in significantly greater detail to understand the physical processes that are responsible.”

An exoplanet about ten times Jupiter’s mass located some 330 light years from Earth. X-ray: NASA/CXC/SAO/I.Pillitteri et al; Optical: DSS; Illustration: NASA/CXC/M.Weiss

For their third observation, the team will be attempting to observe a transiting planet directly. This is very challenging, seeing as how the star’s light is much brighter and therefore obscures the faint light being reflected off the planet’s atmosphere. One method for addressing this is to measure the light coming from a star when the planet is visible, and again when it disappears behind the star.

By comparing the two measurements, astronomers can calculate how much light is coming from the planet alone. This technique works best for very hot planets that glow brightly in infrared light, which is why they selected WASP-18b for this observation – a hot Jupiter that reaches temperatures of around 2,900 K (2627 °C; 4,800 °F). In the process, they hope to determine the composition of the planet’s smothering stratosphere.

In the end, these observations will help test the abilities of the JWST and calibrate its instruments. The ultimate goal will be to examine the atmospheres of potentially-habitable exoplanets, which in this case will include rocky (aka. “Earth-like”) planets that orbit low mass, dimmer red dwarf stars. In addition to being the most common star in our galaxy, red dwarfs are also believed to be the most likely place to find Earth-like planets.

Image: James Webb Space Telescope
NASA’s James Webb Telescope, shown in this artist’s conception, will provide more information about previously detected exoplanets. Beyond 2020, many more next-generation space telescopes are expected to build on what it discovers. Credit: NASA

As Kevin Stevenson, a researcher with the Space Telescope Science Institute and a co-principal investigator on the project, explained:

“TESS should locate more than a dozen planets orbiting in the habitable zones of red dwarfs, a few of which might actually be habitable. We want to learn whether those planets have atmospheres and Webb will be the one to tell us. The results will go a long way towards answering the question of whether conditions favorable to life are common in our galaxy.”

The James Webb Space Telescope will be the world’s premier space science observatory once deployed, and will help astronomers to solve mysteries in our Solar System, study exoplanets, and observe the very earliest periods of the Universe to determine how its large-scale structure evolved over time. For this reason, its understandable why NASA is asking that the astronomical community be patient until they are sure it will deploy successfully.

When the payoff is nothing short of ground-breaking discoveries, it’s only fair that we be willing to wait. In the meantime, be sure to check out this video about how scientists study exoplanet atmospheres, courtesy of the Space Telescope Science Institute:

Further Reading: NASA

Enter the Red Planet: Our Guide to Mars Opposition 2018

Mars Dust Storm
A dusty view of Mars from July 11th. Image credit and copyright: Waskogm.
Mars Dust Storm
A dusty view of Mars from July 11th as Mars opposition 2018 nears. Image credit and copyright: Waskogm.

Have you checked out Mars this season? Mars reaches opposition on July 27th at 5:00 Universal Time (UT) shining at magnitude -2.8 and appearing 24.3” across—nearly as large as it can appear, and the largest since the historic opposition of 2003. We won’t have an opposition this favorable again until September 15th, 2035.

Mars starts this week near the +4th magnitude star Psi Capricorni, loops westward through retrograde briefly into the astronomical constellation of Sagittarius the Archer in late August before heading back into Capricornus in September.

Mars opened up 2018 just 4.8” across, trekking through the early dawn sky. What a difference a few months make: Mars broke 15” arc seconds—a maximum size for an unfavorable opposition near aphelion—on May 30th, and now dominates the summer sky around midnight.

Path of Mars
The path of Mars from July through September 2018. Credit: Starry Night.

There’s one downside, however, to the 2018 opposition of Mars: it’s occurring very nearly as far south along the ecliptic as it can. This is great news for observers in Australia, South Africa and South America, as the Red Planet rides high near the zenith at local midnight. Up north, however, we are still looking at Mars through the murk of the atmosphere lower to the horizon. For example, here in Norfolk, Virginia at latitude 37 degrees north, we never see Mars rise more than 29 degrees altitude above the southern horizon this season.

Down with Dust Storms

Does Mars seem a bit… peachy colored to you this season? It’s not your imagination: a planetary dust storm is indeed underway. It’s the middle of autumn for northern hemisphere of Mars, and this seems to be shaping up to be one of those oppositions where the planet, though at its closest, presents a featureless, dust-shrouded disk. This seems to be the case roughly every third opposition or so… our best hope now is that it may clear in the coming final weeks of July. We checked out Mars over the past weekend, and could just spy the pole cap and some slight detail under a veil of haze.

Curiosity dust storm
The Curiosity rover’s dusty view from late June. Credit: NASA

Despite the depiction of Martian dust storms in science fiction blockbusters such as The Martian as furious and unrelenting, these storms are actually pretty mild-mannered, barely able to chase a leaf before them through the tenuous Martian atmosphere, if deciduous trees grew on Mars. One thing Martian dust storms can do, however, is coat solar panels with a battery-killing film, and it has yet to be seen if the aging Opportunity rover will awaken and phone home from Meridiani Planum.

Unlike the Earth, Mars has a markedly elliptical orbit, varying from 1.7 (AU) astronomical units from the Sun at aphelion to 1.4 AU near perihelion. This all means that not every opposition of Mars is equal; in fact, Mars can range from 55 million to 102 million kilometers from the Earth near opposition and appear 13.8” to 25.1” across, depending on where it’s at in its orbit. And although Mars laps the Earth roughly every 26 months, a cycle of favorable oppositions repeat every 15 years.

Mars 2018
Still dusty… Mars from July 16th. Image credit and copyright: Shahrin Ahmad.

In 2018, Mars reaches opposition on July 27th at 5:00 UT/1:00 AM EDT 57.8 million kilometers from the Earth, then makes its closest approach four days later on July 31st at 8:00 UT/4:00 AM EDT, 57.6 million kilometers distant. Why the discrepancy? Well, opposition is simply reckoned as the point where an outer planet reaches an ecliptic longitude of 180 degrees opposite from the Sun. Mars, however, is still headed inward towards perihelion on September 16th, while Earth just came off of aphelion on July 6th.

Visually, Mars can on occasion “go yellow” and present a saffron color even to the naked eye if a planetary wide sandstorm is underway. At the eyepiece, the most prominent feature is always the pole cap, a white dollop on the planet’s pumpkin hued limb. Crank up the magnification, and dark patches come into view, as Mars is the only planet in the solar system presenting an actual surface available for amateur scrutiny. Mars has a day very similar to Earth’s at only 37 minutes longer in duration, meaning that if you observe Mars at the same time every evening, you’ll see nearly the same longitude of the planet turned towards you, shifted 10 degrees westward. A great tool for comparing what features on Mars are currently turned Earthward is Mars Previewer.

Can you spy Mars… daytime? This month is a good time to try, as it currently shines brighter than Jupiter. The easiest thing to do is lock on to it with a telescope near dawn as it sets to the west and the Sun rises in the east, then simply track it into the daytime sky. We’ve seen Mars in 2003 and again this year while the Sun is still above the horizon… having the Moon nearby also helps, though of course, Mars is very close to the horizon at sunset/sunrise right at opposition.

And speaking of which, viewers in Europe, Africa, Asia and Australia are in for a special treat on the evening of July 27th, as a total eclipse of the Moon occurs just 15 hours after Mars passes opposition. Ironically, this is also a Minimoon eclipse, as the Moon also passes apogee just 14 hours prior to entering the Earth’s shadow. Expect to see the Red Planet just seven degrees from the blood red Moon at mid-eclipse (more on the eclipse next week).

eclipse vs mars
Mars versus the total lunar eclipse on the night of July 27th. Credit: Stellarium

The Moon won’t occult (pass in front of) Mars again until November 16th, 2018 for the very southernmost tip of South America. Stick around until July 26th, 2344 AD, and you can witness the Moon occulting the planet Saturn during an eclipse, though you’ll have to journey to southern Japan to do it.

But you may not have to wait that long… stick around until April 27th, 2078, and you can witness the Moon occult Mars… during a penumbral lunar eclipse:

2078 occultation
The April 27th, 2078 occultation of Mars… during a penumbral lunar eclipse. Credit: NASA/GSFC/Occult 4.2/Starry Night

This current evening apparition of Mars ends over a year from now on September 2nd, 2019, as Mars reaches solar conjunction on the farside of the Sun.

Finally, opposition is a great time to try and check the tiny Martian moons Phobos and Deimos off of your life list. These two moons were actually discovered by Asaph Hall from the United States Naval Observatory’s newly installed 26-inch refractor during a favorable parihelic apparition of Mars in 1877.

phobos and deimos
An alien sky… Phobos occults Deimos as seen from the surface of Mars, courtesy of the Curiosity rover. NASA/JPL-Caltech/Malin Space Science Systems/Texas A&M Univ

Shining at magnitude +12.4 (Deimos) and +11.3 (Phobos), seeing these moons would be a cinch… were it not for the presence of Mars shining a million times brighter nearby. Your best bet is to construct an occulting bar eyepiece (we’ve used a thin strip of foil and a guitar string affixed to an eyepiece to accomplish this) or simply place brilliant Mars just out of view. Phobos orbits once every 7.7 hours and substends 20” from the disk of Mars, while Deimos goes around Mars once every 30.35 hours and journeys 66” with each elongation from the Martian disk. PDS rings node or a good planetarium program such as Starry Night or Stellarium will show the current orientation of the Martian moons, aiding in your decision of whether or not to take up the quest.

Don’t miss out on Mars this opposition season… it’ll be almost another two decades before we get another favorable view.

Read all about viewing the planets, from observation to imaging and sketching in our new book: The Universe Today Guide to the Cosmos out October 23rd, now available for pre-order.

NASA’s Juno Mission Spots Another Possible Volcano on Jupiter’s Moon Io

Infrared image of the southern hemisphere of Jupiter’s moon Io taken by NASA's Juno spacecraft on Dec. 16, 2017. Credits: NASA/JPL-Caltech/SwRI/ASI/INAF/JIRAM

When the Juno spacecraft arrived in orbit around Jupiter in 2016, it became the second spacecraft in history to study Jupiter directly – the first being the Galileo probe, which orbited Jupiter between 1995 and 2003. With every passing orbit (known as a perijove, which take place every 53 days), the spacecraft has revealed more about Jupiter’s atmosphere, weather patterns, and magnetic environment.

In addition, Juno recently discovered something interesting about Jupiter’s closest orbiting moon Io. Based on data collected by its Jovian InfraRed Auroral Mapper (JIRAM) instrument, Juno detected a new heat source close to the south pole of Io that could indicate the presence of a previously undiscovered volcano. This is just the latest discovery made by the probe during its mission, which NASA recently extended to 2021.

Annotated image of the new heat source in the southern hemisphere of the Jupiter moon Io. Credits: NASA/JPL-Caltech/SwRI/ASI/INAF/JIRAM

The infrared data was collected on Dec. 16th, 2017, when the Juno spacecraft was about 470,000 km (290,000 mi) away from Io. As Alessandro Mura, a Juno co-investigator from the National Institute for Astrophysics (INAF) in Rome, explained in a recent NASA press release:

“The new Io hotspot JIRAM picked up is about 200 miles (300 kilometers) from the nearest previously mapped hotspot. We are not ruling out movement or modification of a previously discovered hot spot, but it is difficult to imagine one could travel such a distance and still be considered the same feature.”

Aside from Juno and Galileo, many NASA missions have visited or passed through the Jovian System in the past few decades. These have including the Pioneer 10 and 11 missions in 1973/74, the Voyager 1 and 2 missions in 1979, and the Cassini and New Horizons missions in 2000 and 2007, respectively. Each of these missions managed to snap pictures of the Jovians moons on their way to the outer Solar System.

Annotated image of the new heat source close to the south pole of Io, with a scale depicting the range of temperatures displayed in the infrared image. Credits: NASA/JPL-Caltech/SwRI/ASI/INAF/JIRAM

Combined with ground-based observations, scientists have accounted for over 150 volcanoes on the surface of Io so far, with estimates claiming there could over 400 in total. Since it entered Jupiter’s orbit on July 4th, 2016, the Juno probe has traveled nearly 235 million km (146 million mi) from one pole to other. On July 16th, Juno will conduct its 13th perijove maneuver, once again passing low over Jupiter’s cloud tops at a distance of about 3,400 km (2,100 mi).

During these flybys, Juno probes beneath the upper atmosphere to study the planet’s auroras to learn more about it’s structure, atmosphere and magnetosphere. By shedding light on these characteristics, the Juno probe will also teach us more about the planet’s origins and evolution. This in turn will teach scientists a great deal more about the formation and evolution of our Solar System, and perhaps how life began here.

Further Reading: NASA

How Fast is the Universe Expanding? Hubble and Gaia Team Up to Conduct the Most Accurate Measurements to Date

Using two of the world’s most powerful space telescopes - NASA’s Hubble and ESA’s Gaia - astronomers have made the most precise measurements to date of the universe’s expansion rate. Credits: NASA, ESA, and A. Feild (STScI)

In the 1920s, Edwin Hubble made the groundbreaking discovery that the Universe was in a state of expansion. Originally predicted as a consequence of Einstein’s Theory of General Relativity, measurements of this expansion came to be known as Hubble’s Constant. Today, and with the help of next-generation telescopes – like the aptly-named Hubble Space Telescope (HST) – astronomers have remeasured and revised this law many times.

These measurements confirmed that the rate of expansion has increased over time, though scientists are still unsure why. The latest measurements were conducted by an international team using Hubble, who then compared their results with data obtained by the European Space Agency’s (ESA) Gaia observatory. This has led to the most precise measurements of the Hubble Constant to date, though questions about cosmic acceleration remain.

The study which describes their findings appeared in the July 12th issue of the Astrophysical Journal, titled “Milky Way Cepheid Standards for Measuring Cosmic Distances and Application to Gaia DR2: Implications for the Hubble Constant.” The team behind the study included members from the Space Telescope Science Institute (STScI), the Johns Hopkins University, the National Institute for Astrophysics (INAF), UC Berkeley, Texas A&M University, and the European Southern Observatory (ESO).

This illustration shows three steps astronomers used to measure the universe’s expansion rate (Hubble constant) to an unprecedented accuracy. Credits: NASA, ESA, A. Feild (STScI), and A. Riess (STScI/JHU)

Since 2005, Adam Riess – a Nobel Laureate Professor with the Space Telescope Science Institute and the Johns Hopkins University – has been working to refine the Hubble Constant value by streamlining and strengthening the “cosmic distance ladder”. Along with his team, known as Supernova H0 for the Equation of State (SH0ES), they have successfully reduced the uncertainty associated with the rate of cosmic expansion to just 2.2%

To break it down, astronomers have traditionally used the “cosmic distance ladder” to measure distances in the Universe. This consists of relying on distance markers like Cepheid variables in distant galaxies – pulsating stars whose distances can be inferred by comparing their intrinsic brightness with their apparent brightness. These measurements are then compared to the way light from distant galaxies is redshifted to determine how fast the space between galaxies is expanding.

From this, the Hubble Constant is derived. Another method that is used is to observe the Cosmic Microwave Background (CMB) to trace the expansion of the cosmos during the early Universe – circa. 378,000 years after the Big Bang – and then using physics to extrapolate that to the present expansion rate. Together, the measurements should provide an end-to-end measurement of how the Universe has expanded over time.

However, astronomers have known for some time that the two measurements don’t match up. In a previous study, Riess and his team conducted measurements using Hubble to obtain a Hubble Constant value of 73 km/s (45.36 mps) per megaparsec (3.3 million light-years). Meanwhile, results based on the ESA’ Planck observatory (which observed the CMB between 2009 and 2013) predicted that the Hubble constant value should now be 67 km/s (41.63 mps) per megaparsec and no higher than 69 km/s (42.87 mps) – which represents a discrepancy of 9%.

A multi-color all-sky image of the microwave sky. Credit: ESA, HFI and LFI consortia

As Riess indicated in a recent NASA press release:

“The tension seems to have grown into a full-blown incompatibility between our views of the early and late time universe. At this point, clearly it’s not simply some gross error in any one measurement. It’s as though you predicted how tall a child would become from a growth chart and then found the adult he or she became greatly exceeded the prediction. We are very perplexed.”

In this case, Riess and his colleagues used Hubble to gauge the brightness of distant Cepheid variables while Gaia provided the parallax information – the apparent change in an objects position based on different points of view – needed to determine the distance. Gaia also added to the study by measuring the distance to 50 Cepheid variables in the Milky Way, which were combined with brightness measurements from Hubble.

This allowed the astronomers to more accurately calibrate the Cepheids and then use those seen outside the Milky Way as milepost markers. Using both the Hubble measurements and newly released data from Gaia, Riess and his colleagues were able to refine their measurements on the present rate of expansion to 73.5 kilometers (45.6 miles) per second per megaparsec.

ESA’s Gaia is currently on a five-year mission to map the stars of the Milky Way. Image credit: ESA/ATG medialab; background: ESO/S. Brunier.

As Stefano Casertano, of the Space Telescope Science Institute and a member of the SHOES team, added:

“Hubble is really amazing as a general-purpose observatory, but Gaia is the new gold standard for calibrating distance. It is purpose-built for measuring parallax—this is what it was designed to do. Gaia brings a new ability to recalibrate all past distance measures, and it seems to confirm our previous work. We get the same answer for the Hubble constant if we replace all previous calibrations of the distance ladder with just the Gaia parallaxes. It’s a crosscheck between two very powerful and precise observatories.”

Looking to the future, Riess and his team hope to continue to work with Gaia so they can reduce the uncertainty associated with the value of the Hubble Constant to just 1% by the early 2020s. In the meantime, the discrepancy between modern rates of expansion and those based on the CMB will continue to be a puzzle to astronomers.

In the end, this may be an indication that other physics are at work in our Universe, that dark matter interacts with normal matter in a way that is different than what scientists suspect, or that dark energy could be even more exotic than previously thought. Whatever the cause, it is clear the Universe still has some surprises in store for us!

Further Reading: NASA

NASA Simulation Shows How Europa’s “Fossil Ocean” Rises to the Surface Over Time

Based on new evidence from Jupiter's moon Europa, astronomers hypothesize that chloride salts bubble up from the icy moon's global liquid ocean and reach the frozen surface where they are bombarded with sulfur from volcanoes on Jupiter's innermost large moon Io. The new findings propose answers to questions that have been debated since the days of NASA's Voyager and Galileo missions. This illustration of Europa (foreground), Jupiter (right) and Io (middle) is an artist's concept. Credit: NASA/JPL-Caltech

In the 1970s, the Jupiter system was explored by a succession of robotic missions, beginning with the Pioneer 10 and 11 missions in 1972/73 and the Voyager 1 and 2 missions in 1979. In addition to other scientific objectives, these missions also captured images of Europa’s icy surface features, which gave rise to the theory that the moon had an interior ocean that could possibly harbor life.

Since then, astronomers have also found indications that there are regular exchanges between this interior ocean and the surface, which includes evidence of plume activity captured by the Hubble Space Telescope. And recently, a team of NASA scientists studied the strange features on Europa’s surface to create models that show how the interior ocean exchanges material with the surface over time.

The study, which recently appeared in the the Geophysical Research Letters under the title “Band Formation and Ocean-Surface Interaction on Europa and Ganymede“, was conducted by Samuel M. Howell and Robert T. Pappalardo – two researchers from the NASA Jet Propulsion Laboratory. For their study, the team examined both Ganymede and Europa to see what the moons surface features indicated about how they changed over time.

Images from NASA’s Galileo spacecraft show the intricate detail of Europa’s icy surface. Image: NASA/JPL-Caltech

Using the same two-dimensional numerical models that scientists have used to solve mysteries about motion in the Earth’s crust, the team focused on the linear features known as “bands” and “groove lanes” on Europa and Ganymede. The features have long been suspected to be tectonic in nature, where fresh deposits of ocean water have risen to the surface and become frozen over previously-deposited layers.

However, the connection between this band-forming processes and exchanges between the ocean and the surface has remained elusive until now. To address this, the team used their 2-D numerical models to simulate ice shell faulting and convection.Their simulations also produced a beautiful animation that tracked the movement of “fossil” ocean material, which rises from the depths, freezes into the base of the icy surface, and deforms it over time.

Whereas the white layer at the top is the surface crust of Europa, the colored band in the middle (orange and yellow) represents the stronger sections of the ice sheet. Over time, gravitational interactions with Jupiter cause the ice shell to deform, pulling the top layer of ice apart and creating faults in the upper ice. At the bottom is the softer ice (teal and blue), which begins to churn as the upper layers pull apart.

This causes water from Europa’s interior ocean, which is in contact with the softer lower layers of the icy shell (represented by white dots), to mix with the ice and slowly be transported to the surface. As they explain in their paper, the process where this “fossil” ocean material becomes trapped in Europa’s ice shell and slowly rises to the surface can take hundreds of thousands of years or more.

Artist’s concept of a Europa Clipper mission. Credit: NASA/JPL

As they state in their study:

“We find that distinct band types form within a spectrum of extensional terrains correlated to lithosphere strength, governed by lithosphere thickness and cohesion. Furthermore, we find that smooth bands formed in weak lithosphere promote exposure of fossil ocean material at the surface.”

In this respect, once this fossil material reaches the surface, it acts as a sort of geological record, showing how the ocean was millions of years ago and not as it is today. This is certainly significant when it comes to future missions to Europa, such as NASA’s Europa Clipper mission. This spacecraft, which is expected to launch sometime in the 2020s, will be the first to study Europa exclusively.

In addition to studying the composition of Europa’s surface (which will tell us more about the composition of the ocean), the spacecraft will be studying surface features for signs of current geological activity. On top of that, the mission intends to look for key compounds in the surface ice that would indicate the possible presence of life in the interior (i.e. biosignatures).

Artist’s impression of a hypothetical ocean cryobot (a robot capable of penetrating water ice) in Europa. Credit: NASA

If what this latest study indicates is true, then the ice and compounds the Europa Clipper will be examining will essentially be “fossils” from hundreds of thousands or even millions of years ago. In short, any biomarkers the spacecraft detects – i.e. signs of potential life – will essentially be dated. However, this need not deter us from sending missions to Europa, for even evidence of past life would be groundbreaking, and a good indication that life still exists there today.

If anything, it makes the case for a lander that can explore Europa’s plumes, or perhaps even a Europa submarine (cryobot), all the more necessary! If there is life beneath Europa’s icy surface, we are determined to find it – provided we don’t contaminate it in the process!

Further Reading: NASA, Geophysical Research Letters

Juno Data Shows that Some of Jupiter’s Moons are Leaving “Footprints” in its Aurorae

The Juno Infrared Auroral Mapper (JIRAM) captured this infrared image of Jupiter's south pole. This part of Jupiter cannot be seen from Earth. Image: NASA/JPL-Caltech/SwRI/MSSS

Since it arrived in orbit around Jupiter in July of 2016, the Juno mission has been sending back vital information about the gas giant’s atmosphere, magnetic field and weather patterns. With every passing orbit – known as perijoves, which take place every 53 days – the probe has revealed things about Jupiter that scientists will rely on to learn more about its formation and evolution.

Interestingly, some of the most recent information to come from the mission involves how two of its moons affect one of Jupiter’s most interesting atmospheric phenomenon. As they revealed in a recent study, an international team of researchers discovered how Io and Ganymede leave “footprints” in the planet’s aurorae. These findings could help astronomers to better understand both the planet and its moons.

The study, titled “Juno observations of spot structures and a split tail in Io-induced aurorae on Jupiter“, recently appeared in the journal Science. The study was led by A. Mura of the International Institute of Astrophysics (INAF) and included members from NASA’s Goddard Space Flight Center, NASA’s Jet Propulsion Laboratory, the Italian Space Agency (ASI), the Southwest Research Institute (SwRI), the Johns Hopkins University Applied Physics Laboratory (JHUAPL), and multiple universities.

Infrared images obtained by the Cassini probe, showing disturbances in Jupiter’s aurorae caused by Io and Ganymede. Credit: (c) Science (2018).

Much like aurorae here on Earth, Jupiter’s aurorae are produced in its upper atmosphere when high-energy electrons interact with the planet’s powerful magnetic field. However, as the Juno probe recently demonstrated using data gathered by Ultraviolet Spectrograph (UVS) and Jovian Energetic Particle Detector Instrument (JEDI), Jupiter’s magnetic field is significantly more powerful than anything we see on Earth.

In addition to reaching power levels 10 to 30 times greater than anything higher than what is experienced here on Earth (up to 400,000 electron volts), Jupiter’s norther and southern auroral storms also have oval-shaped disturbances that appear whenever Io and Ganymede pass close to the planet. As they explain in their study:

“A northern and a southern main auroral oval are visible, surrounded by small emission features associated with the Galilean moons. We present infrared observations, obtained with the Juno spacecraft, showing that in the case of Io, this emission exhibits a swirling pattern that is similar in appearance to a von Kármán vortex street.”

A Von Kármán vortex street, a concept in fluid dynamics, is basically a repeating pattern of swirling vortices caused by a disturbance. In this case, the team found evidence of a vortex streaming for hundreds of kilometers when Io passed close to the planet, but which then disappeared as the moon moved farther away from the planet.

Reconstructed view of Jupiter’s northern lights through the filters of the Juno Ultraviolet Imaging Spectrograph instrument on Dec. 11, 2016, as the Juno spacecraft approached Jupiter, passed over its poles, and plunged towards the equator. Credit: NASA/JPL-Caltech/Bertrand Bonfond

The team also found two spots in the auroral belt created by Ganymede, where the extended tail from the main auroral spots eventually split in two. While the team was not sure what causes this split, they venture that it could be caused by interaction between Ganymede and Jupiter’s magnetic field (since Ganymede is the only Jovian moon to have its own magnetic field).

These features, they claim, suggest that magnetic interactions between Jupiter and Ganymede are more complex than previously thought. They also indicate that neither of the footprints were where they expected to find them, which suggests that models of the planet’s magnetic interactions with its moons may be in need of revision.

Studying Jupiter’s magnetic storms is one of the primary goals of the Juno mission, as is learning more about the planet’s interior structure and how it has evolved over time. In so doing, astronomers hope to learn more about how the Solar System came to be. NASA also recently extended the mission to 2021, giving it three more years to gather data on these mysteries.

And be sure to enjoy this video of the Juno mission, courtesy of the Jet Propulsion Laboratory:

Further Reading: phys.org, Science

Cassini’s “Grande Finale” Earns an Emmy Nomination!

An artist's illustration of the Cassini probe's Grand Finale. Image: NASA/JPL/CalTech

In 1997, the NASA/ESA Cassini-Huygens mission launched from Earth and began its long journey towards the Saturn system. In 2004, the Cassini orbiter arrived around Saturn and would spend the next thirteen years studying the gas giant, its rings, and its system of Moons. On September 15th, 2017, the mission ended when the probe entered Saturn’s upper atmosphere and burned up.

This was known as Cassini’s “Grand Finale“, which began with the probe plunging into the unexplored region that lies between Saturn’s atmosphere and its rings and culminated with live coverage of it entering the atmosphere. In honor of the mission and NASA’s outstanding coverage of its final months, NASA was recently nominated for an Emmy Award by The Academy of Television Arts & Sciences.

The award is in the category of Outstanding Original Interactive Program, which recognizes the JPL’s multi-month digital campaign that celebrated the mission’s science and engineering accomplishments – which included news, web, education, television and social media efforts. It is also a nod to the agency’s success in communicating why the spacecraft concluded its mission in the skies of Saturn.

Essentially, the spacecraft was intentionally destroyed in Saturn’s atmosphere to prevent the possibility of it contaminating any of Saturn’s moons. Throughout the thirteen years it spent studying the Saturn system, Cassini found compelling evidence for the possible existence of life on Titan and in Enceladus’ interior ocean. In addition, scientists have speculated that there may be interior oceans within Rhea and Dione.

In this respect, Cassini ended its mission the same way the Galileo probe did in 2003. After spending 8 years studying Jupiter and its system the moons, the probe crashed into the gas giant’s upper atmosphere in order to prevent any possible contamination of Europa or Ganymede, which are also thought to have an interior oceans that could support life.

The “Grand Finale” campaign began on April 26th, 2017, and continued until the craft entered Saturn’s atmosphere on Sept. 15th, 2017, with the spacecraft sending back science to the very last second. The campaign utilized several different forms of media, was interactive, and was very comprehensive, providing regular updates and vital information about the mission.

As NASA indicated on their Cassini website:

“The multi-faceted campaign included regular updates on Twitter, Facebook, Snapchat, Instagram and the Cassini mission website; multiple live social, web and TV broadcasts during which reporter and public questions were answered; a dramatic short film to communicate the mission’s story and preview its endgame; multiple 360-degree videos, including NASA’s first 360-degree livestream of a mission event from inside JPL mission control; an interactive press kit; a steady drumbeat of articles to keep fans updated with news and features about the people behind the mission; state-standards aligned educational materials; a celebration of art by amateur space enthusiasts; and software to provide real-time tracking of the spacecraft, down to its final transmission to Earth.”

The short film, titled “For Your Consideration: The NASA Cassini Grand Finale“, showcases the missions many accomplishments, pays tribute to all those who made it happen and who helped inform the public and communicate the importance of the mission.

The Primetime Emmys will be awarded be on September 17th in Los Angeles. The Creative Arts Emmys, which includes interactive awards, will be presented during a separate ceremony on Saturday, Sept. 15th, at the Microsoft Theatre in Los Angeles. Other contenders include Back to the Moon, a Google Spotlight Stories App; Blade Runner 2049: Memory Lab, Coco VR, and Spiderman Homecoming, three Oculus VR experiences.

And be sure to check out the videos, FYC: NASA Cassini Grand Finale, below:

Further Reading: NASA