
[/caption]You may have heard about the restaurant at the end of the Universe, but have you heard of the bar in the middle of the Milky Way?
Nearly 80 years ago, astronomers determined that our home, the Milky Way Galaxy, is a large spiral galaxy. Despite being stuck inside and not being able to see what the entire the structure looks like — as we can with the Pinwheel Galaxy, or our nearest neighbor, the Andromeda Galaxy — researchers have suspected our galaxy is actually a “barred” spiral galaxy. Barred spiral galaxies feature an elongated stellar structure , or bar, in the middle which in our case is hidden by dust and gas. There are many galaxies in the Universe that are barred spirals, and yet, there are numerous galaxies which do not feature a central bar.
How do these central bars form, and why are they only present in some, but not all spiral galaxies?
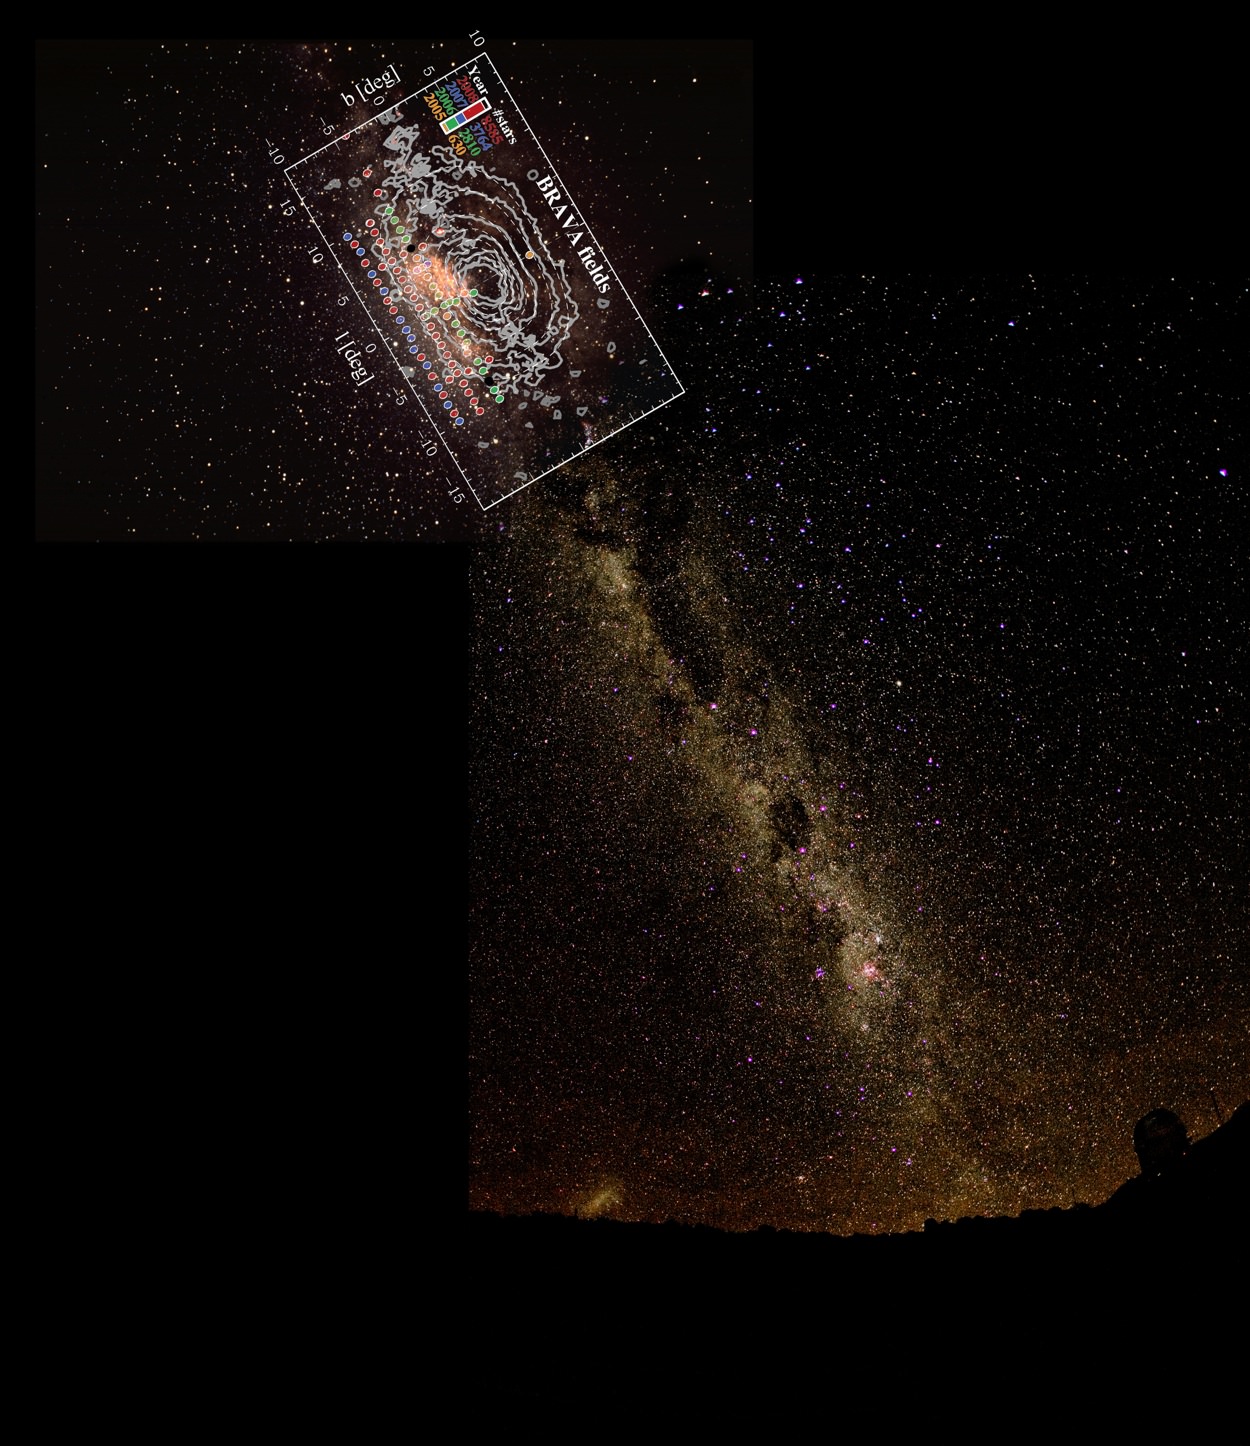
A research team led by Dr. R. Michael Rich (UCLA), dubbed BRAVA (Bulge Radial Velocity Assay), measured the velocity of many old, red stars near the center of our galaxy. By studying the spectra (combined light) of the M class giant stars, the team was able to calculate the velocity of each star along our line of sight. During a four-year time span, the spectra for nearly 10,000 stars was acquired with the CTIO Blanco 4-meter telescope located in Chile’s Atacama desert.
Analyzing the velocities of stars in their study, the team was able to confirm that the Milky Way’s central bulge does contain a massive bar, with one end nearly pointed right at our solar system. One other discovery made by the team is that while our galaxy rotates like a wheel, the BRAVA study found that the rotation of the central bar is more like that of a roll of paper towels in a dispenser. The team’s discoveries provide vital clues to help explain the formation of the Milky Way’s central region.

The spectra data set was compared to a computer simulation created by Dr. Juntai Shen (Shanghai Observatory) showing how the bar formed from a pre-existing disk of stars. The team’s data fits the model quite well, suggesting that before the central bar existed, there was a massive disk of stars. The conclusion reached by the team is in stark contrast to the commonly accepted model of formation of our galaxy’s central region – a model that predicts the Milky Way’s central region formed from an early chaotic merger of gas clouds. The “take-away” point from the team’s conclusions is that gas did play some role in the formation of our galaxy’s central region, which organized into a massive rotating disk, and then turned into a bar due to the gravitational interactions of the stars.
One other benefit to the team’s research is that stellar spectra data will allow the team to analyze the chemical composition of the stars. All stars are composed of mostly hydrogen and helium, but the tiny amounts of other elements (astronomers refer to anything past helium as “metals”) provides insight into the conditions present during a star’s formation.
The BRAVA team found that stars closest to the plane of the Milky Way Galaxy have fewer “metals” than stars further from its galactic plane. The team’s conclusion does confirm standard views of stellar formation, yet the BRAVA data covers a significant area of the galactic bulge that can be chemically analyzed. If researchers map the metal content of stars throughout the Milky Way, a clear picture of stellar formation and evolution emerges, similar to how mapping CO2 concentrations in the Antarctic ice shelf can reveal the past weather patterns here on Earth.
If you’d like to read the full paper, a pre-print version is available at: http://arxiv.org/abs/1112.1955
Source: National Optical Astronomy Observatory press release