Planck Spacecraft Loses Its Cool(ant) But Keeps Going

Artist's impression of the Planck spacecraft. Credit: ESA

[/caption]

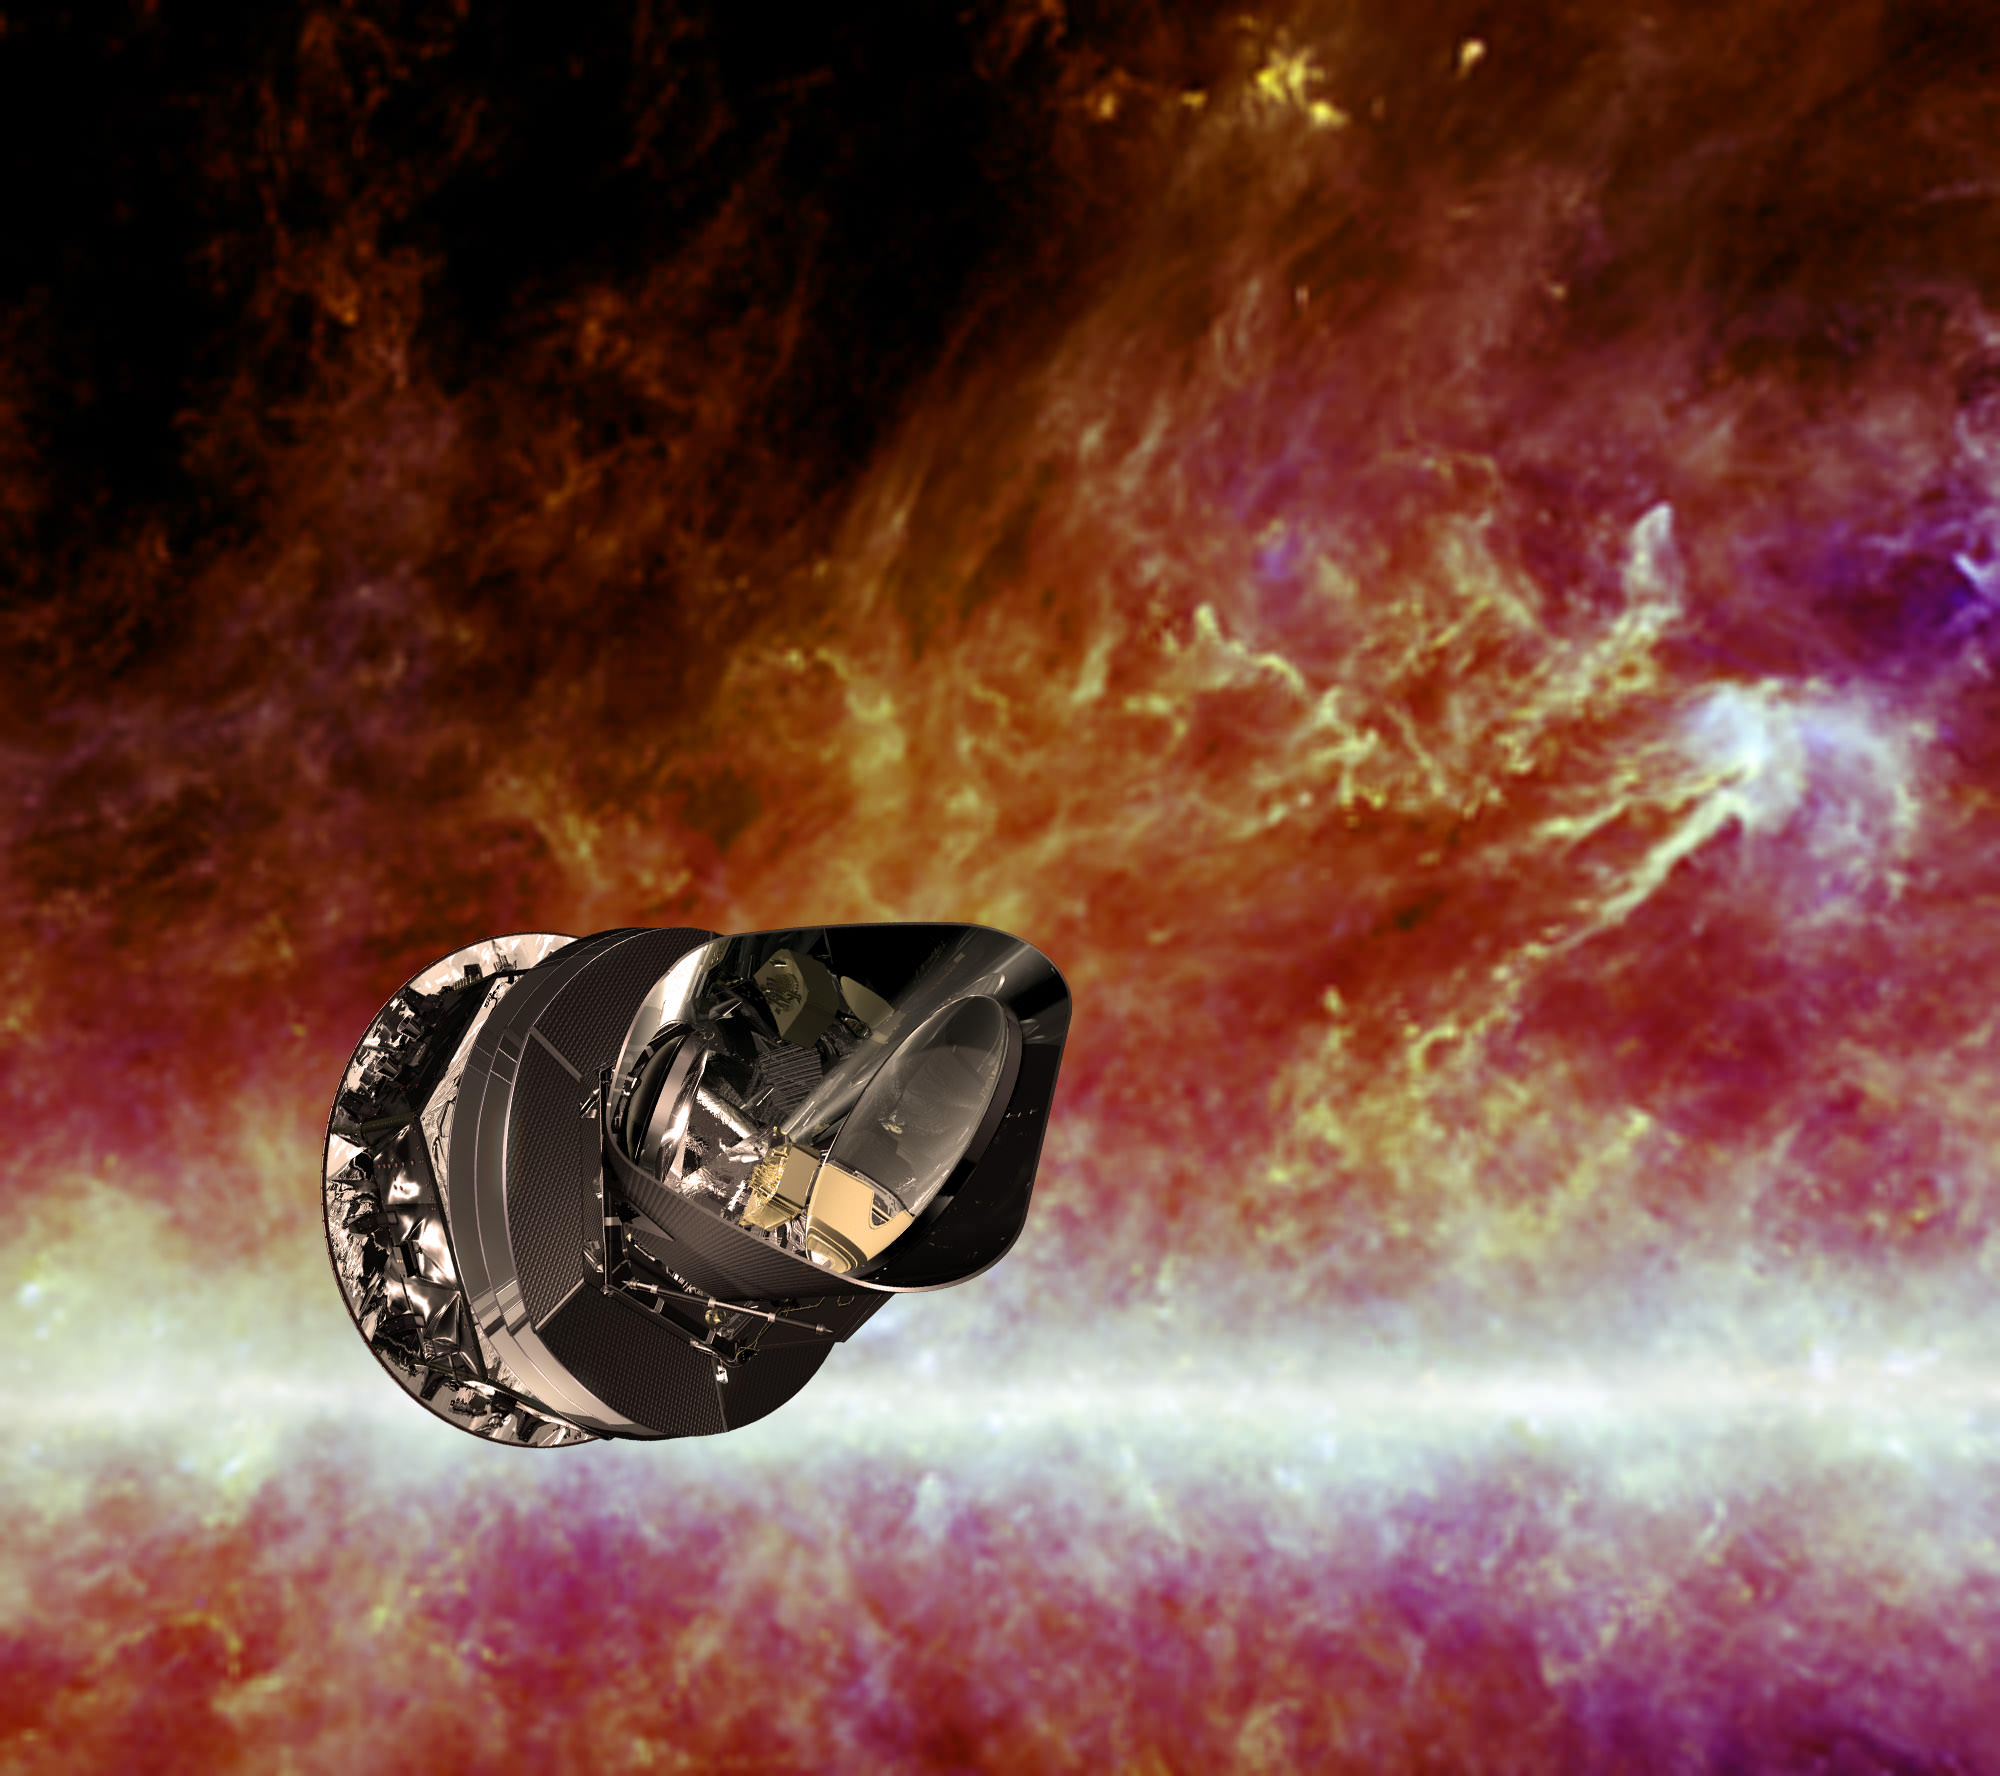
After two and a half years of observing the Cosmic Microwave Background, the ESA Planck spacecraft’s High Frequency Instrument ran out of its on-board coolant gases over this past weekend, reaching the end of its very successful mission. But that doesn’t mean the end for Planck observations. The Low Frequency Instrument, which does not need to be super-cold (but is still at a bone-chilling -255 C), will continue taking data.

“The Low Frequency Instrument will now continue operating for another year,” said Richard Davis, of the University of Manchester in the UK. “During that time it will provide unprecedented sensitivity at the lower frequencies.”

From its location at the Earth/Sun’s L2 Lagrangian point, Planck was designed to ‘see’ the microwaves from the CMB and detects them by measuring temperature. The expansion of the Universe means that the CMB is brightest when seen in microwave light, with wavelengths between 100 and 10,000 times longer than visible light. To measure such long wavelengths Planck’s detectors have to be cooled to very low temperatures. The colder the spacecraft, the lower the temperatures the spacecraft can detect.

The High Frequency Instrument (HFI) was cooled to as close to 2.7K (about –270°C, near absolute zero) as possible.

Planck worked perfectly for 30 months, about twice the span originally required, and completed five full-sky surveys with both instruments.

“Planck has been a wonderful mission; spacecraft and instruments have been performing outstandingly well, creating a treasure trove of scientific data for us to work with,” said Jan Tauber, ESA’s Planck Project Scientist.

While it was the combination of both instruments that made Planck so powerful, there is still work for the LFI to do.

Now and Then. This single all-sky image simultaneously captured two snapshots that straddle virtually the entire 13.7 billion year history of the universe. One of them is ‘now’ – our galaxy and its structures seen as they are over the most recent tens of thousands of years (the thin strip extending across the image is the edge-on plane of our galaxy – the Milky Way). The other is ‘then’ – the red afterglow of the Big Bang seen as it was just 380,000 years after the Big Bang (top and bottom of image). The time between these two snapshots therefore covers about 99.997% of the 13.7 billion year age of the universe. The image was obtained by the Planck spacecraft. Credit: ESA

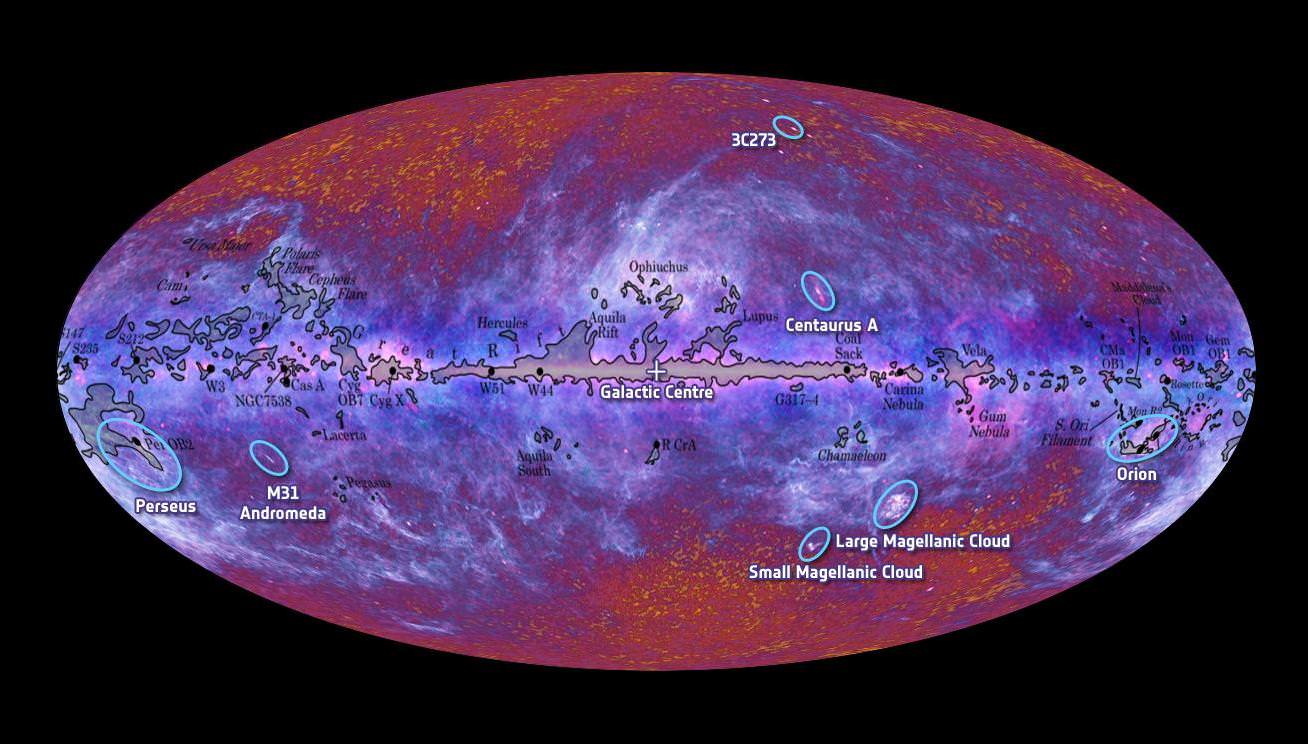
The scientists involved in Planck have been busy understanding and analyzing the data since Planck launched in May 2009. Initial results from Planck were announced last year, and with Planck data, scientists have created a map of the CMB identifying which bits of the map are showing light from the early Universe, and which parts are due to much closer objects, such as gas and dust in our galaxy, or light from other galaxies. The scientists have also produced a catalog of galaxy clusters in the distant Universe — many of which had not been seen before — and included some gigantic ‘superclusters,’ which are probably merging clusters.

The scientists expect to release data about star formation later next month, and reveal cosmological findings from the Big Bang and the very early Universe in 2013.

“The fact that Planck has worked so perfectly means that we have an incredible amount of data,” said George Efstathiou, a Planck Survey Scientist from the University of Cambridge. “Analyzing it takes very high-performance computers, sophisticated software, and several years of careful study to ensure that the results are correct.”

Source: ESA, UK Space Agency

Astronomy Without A Telescope – One Crowded Nanosecond

Labelled version of the Planck space observatory's all-sky survey. Credit: ESA.

[/caption]

Remember how you could once pick up a book about the first three minutes after the Big Bang and be amazed by the level of detail that observation and theory could provide regarding those early moments of the universe. These days the focus is more on what happened between 1×10-36 and 1×10-32 of the first second as we try to marry theory with more detailed observations of the cosmic microwave background.

About 380,000 years after the Big Bang, the early universe became cool and diffuse enough for light to move unimpeded, which it proceeded to do – carrying with it information about the ‘surface of last scattering’. Before this time photons were being continually absorbed and re-emitted (i.e. scattered) by the hot dense plasma of the earlier universe – and never really got going anywhere as light rays.

But quite suddenly, the universe got a lot less crowded when it cooled enough for electrons to combine with nuclei to form the first atoms. So this first burst of light, as the universe became suddenly transparent to radiation, contained photons emitted in that fairly singular moment – since the circumstances to enable such a universal burst of energy only happened once.

With the expansion of the universe over a further 13.6 and a bit billion years, lots of these photons probably crashed into something long ago, but enough are still left over to fill the sky with a signature energy burst that might have once been powerful gamma rays but has now been stretched right out into microwave. Nonetheless, it still contains that same ‘surface of last scattering’ information.

Observations tell us that, at a certain level, the cosmic microwave background is remarkably isotropic. This led to the cosmic inflation theory, where we think there was a very early exponential expansion of the microscopic universe at around 1×10-36 of the first second – which explains why everything appears so evenly spread out.

However, a close look at the cosmic microwave background (CMB) does show a tiny bit of lumpiness – or anisotropy – as demonstrated in data collected by the aptly-named Wilkinson Microwave Anisotropy Probe (WMAP).

Really, the most remarkable thing about the CMB is its large scale isotropy and finding some fine grain anisotropies is perhaps not that surprising. However, it is data and it gives theorists something from which to build mathematical models about the contents of the early universe.

The apparent quadrupole moment anomalies in the cosmic microwave background might result from irregularities in the early universe - including density fluctuations, dynamic movement (vorticity) or even gravity waves. However, a degree of uncertainty and 'noise' from foreground light sources is apparent in the data, making firm conclusions difficult to draw. Credit: University of Chicago.

Some theorists speak of CMB quadrupole moment anomalies. The quadrupole idea is essentially an expression of energy density distribution within a spherical volume – which might scatter light up-down or back-forward (or variations from those four ‘polar’ directions). A degree of variable deflection from the surface of last scattering then hints at anisotropies in the spherical volume that represents the early universe.

For example, say it was filled with mini black holes (MBHs)? Scardigli et al (see below) mathematically investigated three scenarios, where just prior to cosmic inflation at 1×10-36 seconds: 1) the tiny primeval universe was filled with a collection of MBHs; 2) the same MBHs immediately evaporated, creating multiple point sources of Hawking radiation; or 3) there were no MBHs, in accordance with conventional theory.

When they ran the math, scenario 1 best fits with WMAP observations of anomalous quadrupole anisotropies. So, hey – why not? A tiny proto-universe filled with mini black holes. It’s another option to test when some higher resolution CMB data comes in from Planck or other future missions to come. And in the meantime, it’s material for an astronomy writer desperate for a story.

Further reading: Scardigli, F., Gruber,C. and Chen (2010) Black hole remnants in the early universe.