What Is Atmospheric Pressure

Thermosphere
The Moon viewed from Earth's thermosphere. Credit: NASA

[/caption]

Just answering the question ‘what is atmospheric pressure?’ is not enough to give a full understanding of its importance. By definition atmospheric pressure is ‘force per unit area exerted against a surface by the weight of air above that surface’. Atmospheric pressure is closely related to the hydrostatic pressure caused by the weight of air above the measurement point. The term standard atmosphere is used to express the pressure in a system(hydraulics and pneumatics) and is equal to 101.325 kPa. Other equivalent units are 760 mmHg and 1013.25 millibars.

Mean sea level pressure (MSLP) is the pressure at sea level. This is the pressure normally given in weather reports. When home barometers are set to match local weather reports, they will measure pressure reduced to sea level, not your local atmospheric pressure. The reduction to sea level means that the normal range of fluctuations in pressure are the same for everyone.

Atmospheric pressure is important in altimeter settings for flight. A altimeter can be set for QNH or QFE. Both are a method of reducing atmospheric pressure to sea level, but they differ slightly. QNH will get the altimeter to show elevation at the airfield and altitude above the air field. QFE will set the altimeter to read zero for reference when at a particular airfield. QNH is transmitted around the world in millibars, except in the United States and Canada . These two countries use inches (or hundredths of an inch) of mercury.

Atmospheric pressure is often measured with a mercury barometer; however, since mercury is not a substance that humans commonly come in contact with, water often provides a more intuitive way to visualize the pressure of one atmosphere. One atmosphere is the amount of pressure that can lift water approximately 10.3m. A diver who is 10.3m underwater experiences a pressure of about 2 atmospheres (1of air plus 1of water). Low pressures like natural gas lines can be expressed in inches of water(w.c). A typical home gas appliance is rated for a maximum of 14 w.c.(about 0.034 atmosphere).

You can see that understanding ‘what is atmospheric pressure’ is just the tip of the iceberg. Once you have the definition in mind, it really comes together when you see the wide variety of applications.

We have written many articles about atmospheric pressure for Universe Today. Here’s an article about atmospheric pressure, and here’s an article about air pressure.

If you’d like more info on the Atmospheric Pressure, check out NASA’s Discussion Video on Atmospheric Pressure, and here’s a link to How Atmospheric Pressure Affects the Weather?

We’ve also recorded an entire episode of Astronomy Cast all about the Atmospheric Pressure. Listen here, Episode 151: Atmospheres.

Man-Made Aurora Will Help to Better Predict Space Weather

Northern Lights
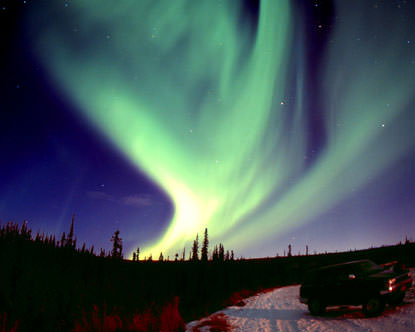
The Aurora Borealis seen in Alaska.

[/caption]

New experiments that create a man-made aurora are helping researchers better understand how nitrogen in our atmosphere reacts when it is bombarded by the solar wind. Scientists from the Jet Propulsion Laboratory fired electrons of differing energies through a cloud of nitrogen gas to measure the ultraviolet light emitted by this collision, and the findings show our previous understanding of the processes that create the aurorae – which can also adversely affect orbiting satellites– may have been in error.

For more than 25 years, our understanding of terrestrial space weather has been partly based on incorrect assumptions about how nitrogen — the most abundant gas in our atmosphere –reacts when it collides with electrons produced by energetic ultraviolet sunlight and solar wind.

The new research has found that well-trusted measurements published in a 1985 journal paper by researchers Ajello and Shemansky contain a significant experimental error, putting decades of space weather findings dependent on this work on unstable ground.

New technology has allowed the researchers to better create and control the collisions and avoid the analytical pitfalls that plagued the 1985 findings.

The new results from the team at JPL suggest that the intensity of a broad band of ultraviolet light emitted from the collision changes significantly less with bombarding electron energies than previously thought.

The researchers studied ultraviolet light within the so called ‘Lyman-Birge-Hopfield’ (LBH) band to better understand the physical and chemical processes occurring in our upper atmosphere and in near-Earth space.

“Our measurement of LBH energy-dependence differs significantly from widely accepted results published 25 years ago,” said Dr. Charles Patrick Malone from JPL. “Aeronomers can now turn the experiment around and apply it to atmospheric studies and determine what kind of collisions produce the observed light.”

In addition to helping researchers to better understand space weather, which can help protecting the ever-growing population of satellites in Earth orbit, the new findings will also help further our understanding of phenomena like Aurora Borealis (the Northern Lights) and similarly the Aurora Australis (Southern Lights), which are caused by collisional processes involving solar wind particles exciting terrestrial oxygen and nitrogen particles at the North and South Pole.

The researchers are hopeful that their findings will also assist the Cassini project understand happenings on Saturn’s largest moon, Titan, as LBH emissions have been detected by the orbiting robotic spacecraft.

The research was published in IOP Publishing’s Journal of Physics B: Atomic, Molecular and Optical Physics.

What was the Largest Tornado Ever Recorded?

Determining the biggest tornado can be a tricky endeavor. First of all, there is no direct absolute way to measure the width of a tornado. There is also the fact that a tornado can be ranked by many factors such as wind speed, level of destruction caused, drop in barometric pressure, or the length of travel path. Each of these play a role in determining the overall power of a tornado.

Another problem is that in many cases like in the Tornado Alley of the Midwestern United States, a storm system often produces multiple tornadoes. This can make it difficult to measure an individual tornado since it destructive force is combined with that of other tornadoes spawned by the same storm system.

While there is no definitive method there are some records that can give us a general idea about some of the greatest tornadoes in recorded history. The most powerful tornadoes tend to be in the United States, but there are others that can compete in other parts of the world.

The title of most devastating tornado goes to the Tri-State tornado of 1925. The twister traveled through three states and killed 698 people. This makes it the deadliest tornado in US history. It also had the longest track and duration traveling a distance of over 200 miles and lasting 3.5 hours. Even then this is just for the United States. The deadliest tornado in the world occurred in 1989 in Bangladesh taking over 1300 lives.

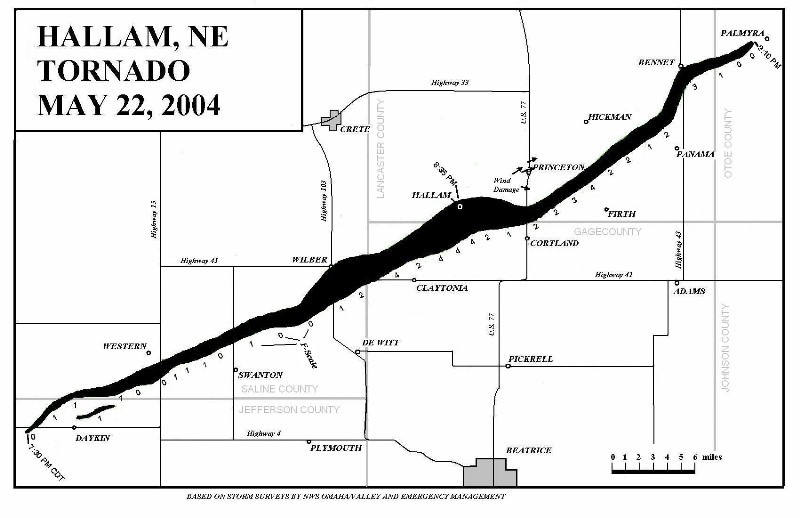
The closest measure to the Biggest tornado would be the widest damage path. This the with of the destruction a tornado causes not it actual size. This measure is a good estimate for the actual width of the tornado’s funnel cloud. The storm that holds the record occurred in Wilber-Halland Nebraska. The tornado had a destruction path with a width of over two miles. The tornado destroyed most of the buildings in the area.

As you can see you define the largest tornado by many factors. This just shows the various ways in which we as casual observers can measure and determine the power of a tornado. This provides an interesting insight into what makes a tornado so destructive and hard to predict. It is also important to remember once again that tornadoes rarely occur as singular phenomenons. A group of smaller tornadoes in an outbreak can be as effectively powerful and destructive as one major tornado.

If you enjoyed this article there are other pieces on Universe Today that you will loved to read. There is an interesting article about the winds on Venus. There is also another interesting article on Global warming.

You can also check out resources online. There is a great article about Tornadoes on National Oceanic and Atmospheric Administration website There is another interesting piece on tornadoes on the University Corporation for Atmospheric Research website.

You can also check out Astronomy Cast. Episode 151 talks about atmospheres.

Gases In The Atmosphere

Atmosphere layers. Image credit: NASA

[/caption]There are different gases in the atmosphere. There’s nitrogen (the most abundant of them all), oxygen, and argon. There are of course a lot more but they’re no more than 1% of the entire atmosphere.

Among the minority are the greenhouse gases, carbon dioxide being the most prominent of them all. These gases are presently cast as harmful to the planet, being the primary cause of global warming. Of course, they’re only harmful because they’ve exceeded their ideal levels. Anything that comes in excess is not good, right?

At ideal levels, greenhouse gases play an important role in keeping our planet warm enough for us and other organisms to live comfortably. Unfortunately, the rapid rate of industrialization has caused greenhouse gases to accumulate, forming a layer too thick for infrared radiation (which originally came in from the Sun as solar radiation) to escape.

The different gases in the atmosphere actually make up five principal layers. Starting from the lowest layer, there’s the Troposphere, followed by Stratosphere, then the Mesosphere, then Thermosphere, and finally the Exosphere.

The peak of Mount Everest, high as it is, is still part of the Troposphere. The Stratosphere is the layer at which most weather balloons fly. The Mesosphere is where meteors mostly ignite. The Thermosphere is where the International Space Station orbits.

Since the Karman line (which serves as the boundary between the Earth’s immediate atmosphere and outer space) is found in the lower region of the Thermosphere, much of this layer of gases in the atmosphere is considered outer space. Finally, the exosphere, being the outermost layer, is where you can find the lightest gases: hydrogen and helium.

Many properties of the gases in the atmosphere are dependent on the altitude at which they are found. For instance, average density of these gases generally decrease as one rises to higher altitudes. As a result, the pressure (being due to the collisions of the particles that make up the gas) also decreases in the same manner.

Since the force of gravity pulls down on the masses of these gases, the heavier gases are typically found near the surface of the Earth while the lightest ones (e.g. hydrogen and helium) are found in higher altitudes. All these properties are just generalizations though. Temperature and fluid dynamics also influence these properties.

Want to learn more about the atmosphere and air pressure? You can read about both here in Universe Today.

Of course, you can find more info at NASA too. Follow these links:
Earth’s Atmosphere
Earth

Tired eyes? We recommend you let your ears do the work for a change. Here are some episodes from Astronomy Cast:
Atmospheres
Plate Tectonics

Earth’s Upper Atmosphere is Cooling

New measurements from a NASA satellite show a dramatic cooling in the upper atmosphere that correlates with the declining activity of the current solar cycle. For the first time, researchers can show a timely link between the Sun and the climate of Earth’s thermosphere, the region above 100 km, an essential step in making accurate predictions of climate change in the high atmosphere. This finding also correlates with a fundamental prediction of climate change theory that says the upper atmosphere will cool in response to increasing carbon dioxide.

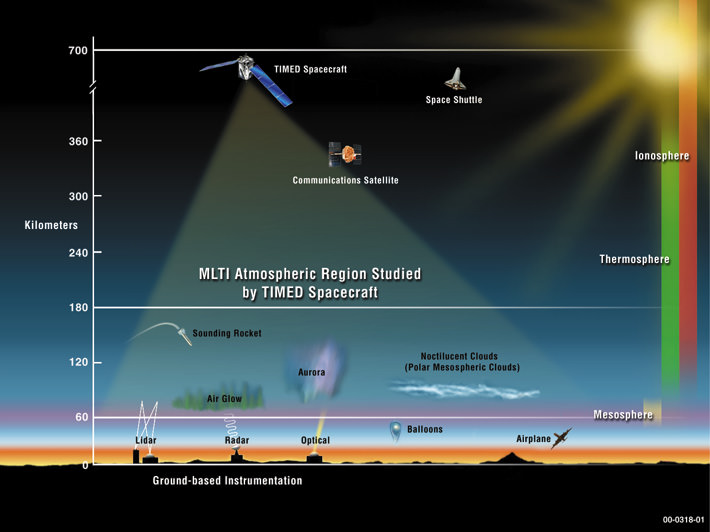
Earth’s thermosphere and mesosphere have been the least explored regions of the atmosphere, in fact some have called it the “ignorosphere.” The NASA Thermosphere-Ionosphere-Mesosphere Energetics and Dynamics (TIMED) mission was developed to explore the Earth’s atmosphere above 60 km altitude and was launched in December 2001. One of four instruments on the TIMED mission, the Sounding of the Atmosphere using Broadband Emission Radiometry (SABER) instrument, was specifically designed to measure the energy budget of the mesosphere and lower thermosphere. The SABER dataset now covers eight years of data and has already provided some basic insight into the heat budget of the thermosphere on a variety of timescales.

The extent of current solar minimum conditions has created a unique situation for recent SABER datasets. The end of solar cycle 23 has offered an opportunity to study the radiative cooling in the thermosphere under exceptionally quiescent conditions.

“The Sun is in a very unusual period,” said Marty Mlynczak, SABER associate principal investigator and senior research scientist at NASA Langley. “The Earth’s thermosphere is responding remarkably — up to an order of magnitude decrease in infrared emission/radiative cooling by some molecules.”

The TIMED measurements show a decrease in the amount of ultraviolet radiation emitted by the Sun. In addition, the amount of infrared radiation emitted from the upper atmosphere by nitric oxide molecules has decreased by nearly a factor of 10 since early 2002. These observations imply that the upper atmosphere has cooled substantially since then. The research team expects the atmosphere to heat up again as solar activity starts to pick up in the next year.

While this warming has no implications for climate change in the troposphere, a fundamental prediction of climate change theory is that the upper atmosphere will cool in response to increasing carbon dioxide. Emissions of carbon dioxide may warm the lower atmosphere, but they cool the upper atmosphere, because of the density of the atmospheric layer.

As the atmosphere cools the density will increase, which ultimately may impact satellite operations through increased drag over time.

The SABER dataset is the first global, long-term, and continuous record of the Nitric oxide (NO) and Carbon dioxide (CO2) emissions from the thermosphere.

“We suggest that the dataset of radiative cooling of the thermosphere by NO and CO2 constitutes a first climate data record for the thermosphere,” says Mlynczak.

The TIMED data provide a fundamental climate data record for validation of upper atmosphere climate models which is an essential step in making accurate predictions of climate change in the high atmosphere. SABER provides the first long-term measurements of natural variability in key terms of the upper atmosphere climate. As the TIMED mission continues, these data derived from SABER will become important in assessing long term changes due to the increase of carbon dioxide in the atmosphere.

The findings were presented at the American Geophysical Union fall meeting in San Francisco.

Source: NASA Langley

Earth’s Atmosphere Came from Outer Space

A new study from the University of Heidelberg suggests that flash-heating and carbon depletion could have been intrinsic to the emergence and evolution of life on Earth. Credit: NASA

[/caption]

A new study finds the gases which formed the Earth’s atmosphere – as well as its oceans – did not come from inside the Earth but from comets and meteorites hitting Earth during the Late Heavy Bombardment period. A research team tested volcanic gases to uncover the new evidence. “We found a clear meteorite signature in volcanic gases,” said Dr. Greg Holland the project’s lead scientist. “From that we now know that the volcanic gases could not have contributed in any significant way to the Earth’s atmosphere. Therefore the atmosphere and oceans must have come from somewhere else, possibly from a late bombardment of gas and water rich materials similar to comets.”

Holland said textbook images of ancient Earth with huge volcanoes spewing gas into the atmosphere will have to be rethought.

According to the theory of the Late Heavy Bombardment, the inner solar system was pounded by a sudden rain of solar system debris only 700 million years after it formed, which likely had monumental effects on the nascent Earth. So far, the evidence for this event comes primarily from the dating of lunar samples, which indicates that most impact melt rocks formed in this very narrow interval of time. But this new research on the origin of Earth’s atmosphere may lend credence to this theory as well.

The researchers analyzed the krypton and xenon found in upper-mantle gases leaking from the Bravo Dome gas field in New Mexico. They found that the two noble gases have isotopic signatures characteristic of early Solar System material similar to me teorites instead of the modern atmosphere and oceans. It therefore appears that noble gases trapped within the young Earth did not contribute to Earth’s later atmosphere.
The study is also the first to establish the precise composition of the Krypton present in the Earth’s mantle.

“Until now, no one has had instruments capable of looking for these subtle signatures in samples from inside the Earth – but now we can do exactly that,” said Holland.

The team’s research, “Meteorite Kr in Earth’s Mantle Suggests a Late Accretionary Source for the Atmosphere” was published in the journal Science.

Sources: Science, EurekAlert

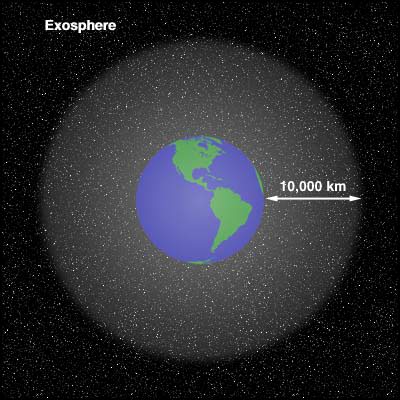
Exosphere

Exosphere

[/caption]
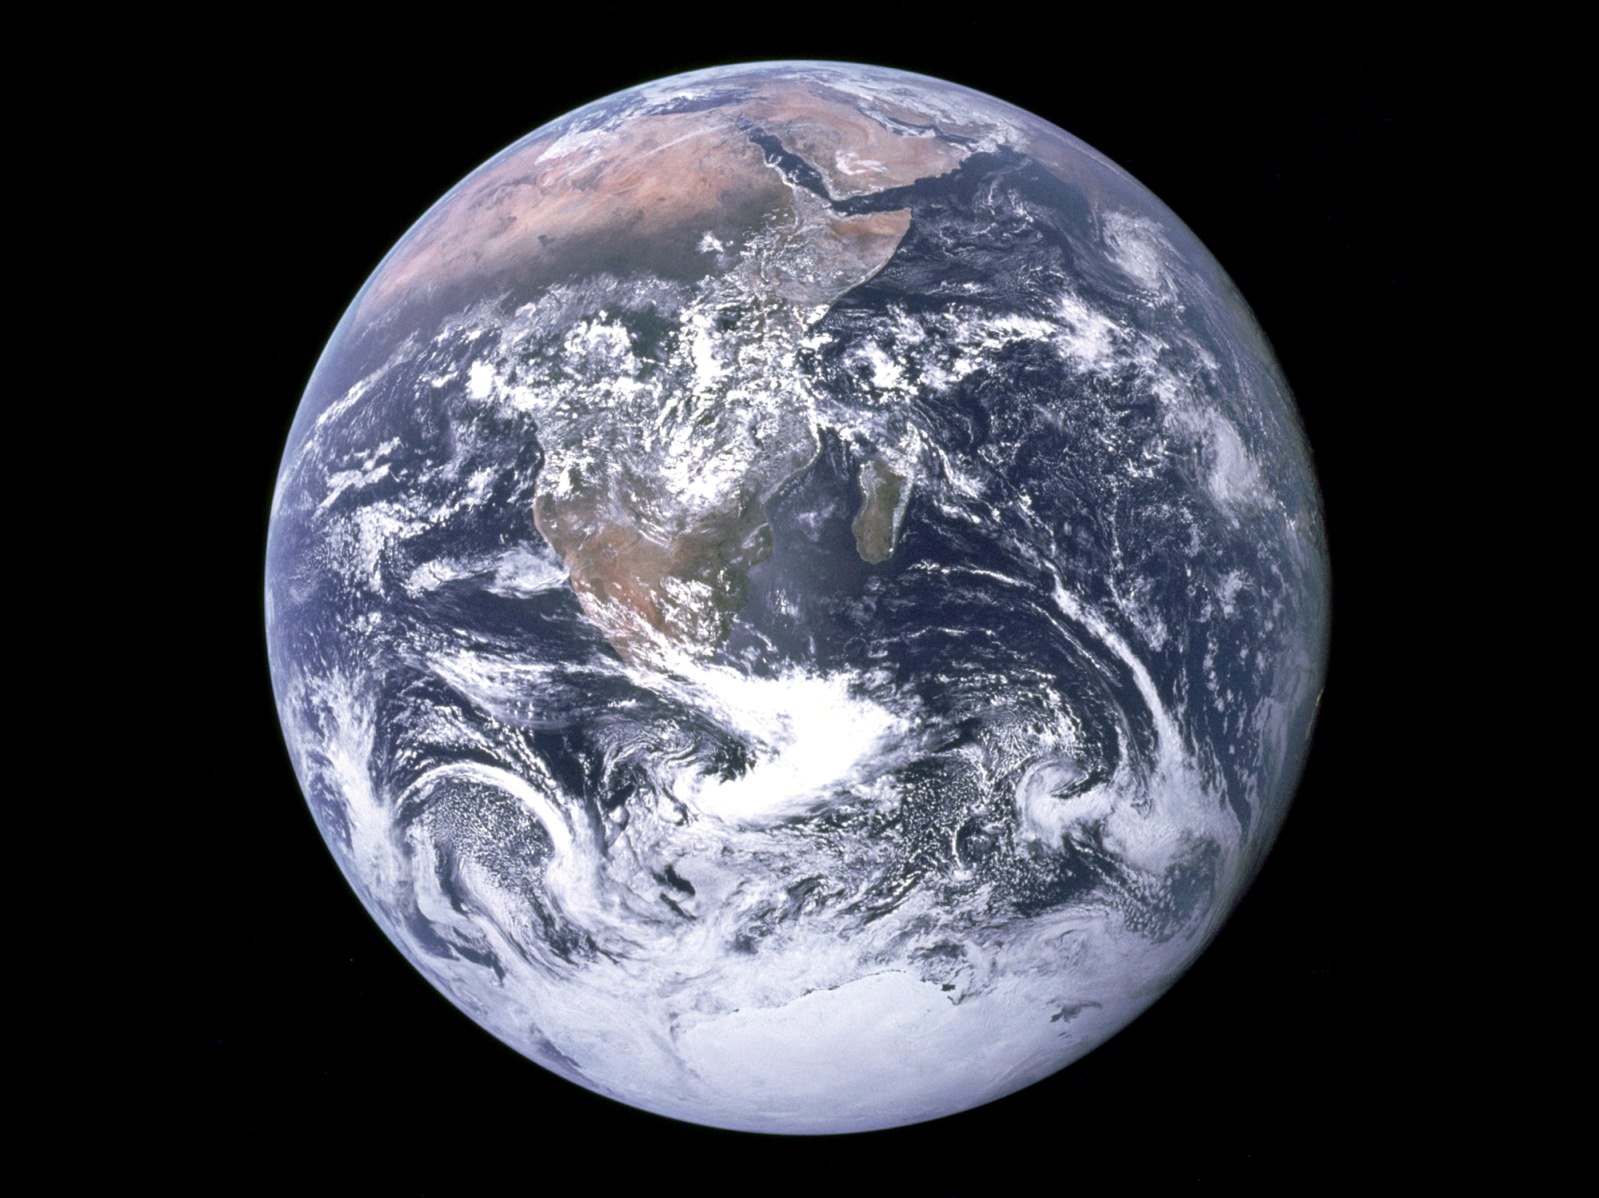
The Earth’s atmosphere is broken up into several distinct layers. We live down in the troposphere, where the atmosphere is thickest. Above that is the stratosphere, then there’s the mesosphere, thermosphere and finally the exosphere. The top of the exosphere marks the line between the Earth’s atmosphere and interplanetary space.

The exosphere is the outermost layer of the Earth’s atmosphere. It starts at an altitude of about 500 km and goes out to about 10,000 km. Within this region particles of atmosphere can travel for hundreds of kilometers in a ballistic trajectory before bumping into any other particles of the atmosphere. Particles escape out of the exosphere into deep space.

The lower boundary of the exosphere, where it interacts with the thermosphere is called the thermopause. It starts at an altitude of about 250-500 km, but its height depends on the amount of solar activity. Below the thermopause, particles of the atmosphere have atomic collisions, like what you might find in a balloon. But above the thermopause, this switches over to purely ballistic collisions.

The theoretical top boundary of the exosphere is 190,000 km (half way to the Moon). This is the point at which the solar radiation coming from the Sun overcomes the Earth’s gravitational pull on the atmospheric particles. This has been detected to about 100,000 km from the surface of the Earth. Most scientists consider 10,000 km to be the official boundary between the Earth’s atmosphere and interplanetary space.

We have written several articles about the Earth’s atmosphere for Universe Today. Here’s an article about an evaporating extrasolar planet, and this article explains how far away space is.

You can learn more about the layers of the atmosphere, including the exosphere from this page at NASA.

We have recorded a whole episode of Astronomy Cast talking about the Earth’s (and it’s atmosphere). Check it out here, Episode 51: Earth.

Atmosphere Layers

Atmosphere layers. Image credit: NASA

[/caption]
Seen from space, the Earth’s atmosphere is incredibly thin, like a slight haze around the planet. But the atmosphere has several different layers that scientists have identified; from the thick atmosphere that we breathe to the tenuous exosphere that extends out thousands of kilometers from the Earth. Let’s take a look at the different atmosphere layers.

Scientists have identified 5 distinct layers of the atmosphere, starting with the thickest near the surface, and then thinning out until it eventually merges with space.

The troposphere is the first layer above the surface of the Earth, and it contains 75% of the Earth’s atmosphere, and 99% of its water. Breathe in, that’s the troposphere. The average depth of the troposphere is about 17 km high. It gets deeper in the tropical regions, up to 20 km, and then shallower near the Earth’s poles – down to 7 km thick. Temperature and pressure are at the their highest at sea level, and then decrease with altitude. The troposphere is also where we experience weather.

The next atmosphere layer is the stratosphere, extending above the troposphere to an altitude of 51 km. Unlike the troposphere, temperature actually increases with height. Commercial airlines will typically fly in the stratosphere because it’s very stable; above weather, and allows them to optimize burning jet fuel. You might be surprised to know that bacterial life survives in the stratosphere.

Above that is the mesosphere, which starts at about 50-85 km above the Earth’s surface and extends up to an altitude of 80-90 km. Temperatures decrease the higher you go in the mesosphere, reaching a low of -100 °C, depending on the latitude and season.

Next comes the thermosphere. This region starts around 90 km above the Earth and goes up to about 320 and 380 km. The International Space Station orbits within the thermosphere. This is the region of the atmosphere where ultraviolet radiation causes ionization, and we can see auroras. Temperatures in the thermosphere can actually reach 2,500 °C; however, it wouldn’t feel warm because the atmosphere is so thin.

The 5th and final layer of the Earth’s atmosphere is the exosphere. This starts above the thermosphere and extends out for hundreds and even thousands of kilometers. Air molecules in this region can travel for hundreds of kilometers without bouncing into another particle.

We have written many articles about the Earth’s atmosphere for Universe Today. Here’s an article about the composition of the Earth’s atmosphere, and here’s information about the Earth’s early atmosphere.

Here’s a great article from NASA that explains the different layers of the atmosphere, and here’s more information from NOAA.

We have done a whole episode of Astronomy Cast just about Earth. Listen to it here, Episode 51 – Earth.