Opportunity’s Next Adventure: The Big Drive

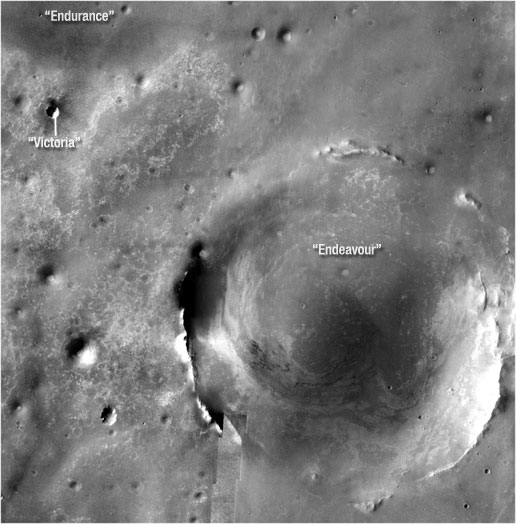
The Big Drive to Endeavour-crater. Credit: NASA/JPL

[/caption]

Opportunity, the intrepid Mars Exploration Rover, is going to put the pedal to the metal and head out for a crater nearly 12 kilometers (7 miles) away. That would match the distance the rover has traveled since landing in 2004. But the call of the unknown is compelling the rover science team to make the attempt. “We may not get there, but it is scientifically the right direction to go anyway,” said Steve Squyres, principal investigator for the science instruments on Opportunity and its twin rover, Spirit. For an “aging” rover (what age is 4 in rover years?), this might be setting the bar pretty high. But maybe it’s the journey and not the destination.

“This is a bolder, more aggressive objective than we have had before,” said John Callas, the project manager the rovers. “It’s tremendously exciting. It’s new science. It’s the next great challenge for these robotic explorers.”

“This crater is staggeringly large compared to anything we’ve seen before.” The crater, named Endeavour, is 22 kilometers (13.7 miles) across. “I would love to see that view from the rim,” Squyres said. “But even if we never get there, as we move southward we expect to be getting to younger and younger layers of rock on the surface. Also, there are large craters to the south that we think are sources of cobbles that we want to examine out on the plain. Some of the cobbles are samples of layers deeper than Opportunity will ever see, and we expect to find more cobbles as we head toward the south.”

The rover team estimates Opportunity may be able to travel about 110 yards each day it is driven toward the Endeavour crater. Even at that pace, the journey could take two years. But why not go for it, and see how long the rovers can last?

Opportunity's shadow with Victoria Crater in the background.  Credit:  NASA/JPL/ASU
Opportunity's shadow with Victoria Crater in the background. Credit: NASA/JPL/ASU

Opportunity, like Spirit, is well past its expected lifetime on Mars, and might not keep working long enough to reach the crater. However, two new resources not available during the 4-mile drive toward Victoria Crater in 2005 and 2006 are expected to aid in this new trek.

One is imaging from orbit of details smaller than the rover itself, using the High Resolution Imaging Science Experiment (HiRISE) camera on NASA’s Mars Reconnaissance Orbiter, which arrived at the Red Planet in 2006.

“HiRISE allows us to identify drive paths and potential hazards on the scale of the rover along the route,” Callas said. “This is a great example of how different parts of NASA’s Mars Exploration Program reinforce each other.”

Also, Opportunity now has a better “brain” for driving across the the plains of Mars. A new version of flight software uplinked to Opportunity and Spirit in 2006, boosts their ability to autonomously choose routes and avoid hazards such as sand dunes.

During its first year on Mars, Opportunity found geological evidence that the area where it landed had surface and underground water in the distant past. The rover’s explorations since have added information about how that environment changed over time. Finding rock layers above or below the layers already examined adds windows into later or earlier periods of time.

Source: JPL

Anything Under That Rock on Mars? Phoenix to Take a Peek

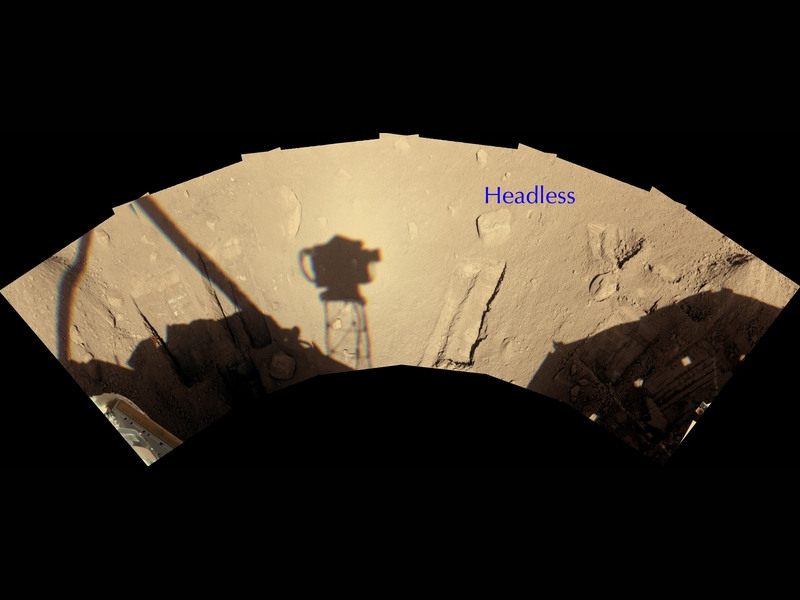
The rock "Headless." NASA/JPL-Caltech/University of Arizona/ Texas A&M University

[/caption]
Ever wondered what might crawl out from under a rock on Mars? The Phoenix lander is going to attempt to find out today by trying to nudge a rock aside today with its robotic arm to see what might be underneath. Engineers have developed a plan to try moving a rock on the north side of the lander. This rock, roughly the size and shape of a VHS videotape, is called “Headless.” Even though the Phoenix mission has been extended for a second time – the mission is now on through December, the team feels like it’s time to pull out all the stops and do as much work as possible. “We’re getting towards fall in the northern plains of Mars and our sun is dropping lower day by day,” said mission principal investigator Peter Smith on NPR’s Science Friday. “Our days are getting precious.” So, even though Phoenix’s robotic arm was not designed to move rocks, the team wants to give it a shot. “The appeal of studying what’s underneath is so strong we have to give this a try,” said Michael Mellon, a Phoenix science team member at the University of Colorado, Boulder.

“We don’t know whether we can do this until we try,” said Ashitey Trebi Ollennu, a robotics engineer at NASA’s Jet Propulsion Laboratory, Pasadena, Calif. “The idea is to move the rock with minimum disturbance to the surface beneath it. You have to get under it enough to lift it as you push it and it doesn’t just slip off the scoop.”

The lander receives commands for the whole day in the morning, so there’s no way to adjust in mid-move if the rock starts slipping. Phoenix took stereo-pair images of Headless to provide a detailed three-dimensional map of it for planning the arm’s motions. On Saturday, Sept. 20, the arm enlarged a trench close to Headless. Commands sent to Phoenix Sunday evening, Sept. 21, included a sequence of arm motions for today, intended to slide the rock into the trench.

If the technique works, the move would expose enough area for digging into the soil that had been beneath Headless.

Morning frost on Mars.  NASA/JPL-Caltech/University of Arizona/ Texas A&M University
Morning frost on Mars. NASA/JPL-Caltech/University of Arizona/ Texas A&M University

The scientific motive is related to a hard, icy layer found beneath the surface in trenches that the robotic arm has dug near the lander. Excavating down to that hard layer underneath a rock might provide clues about processes affecting the ice.

“The rocks are darker than the material around them, and they hold heat,” Mellon said. “In theory, the ice table should deflect downward under each rock. If we checked and saw this deflection, that would be evidence the ice is probably in equilibrium with the water vapor in the atmosphere.”

An alternative possibility, if the icy layer were found closer to the surface under a rock, could by the rock collecting moisture from the atmosphere, with the moisture becoming part of the icy layer.

Source: JPL

Deep Inside a Giant: Part 2 – Centaurus A by Mike Sidonio

Centaurus A Dustlane - Mike Sidonio

[/caption]

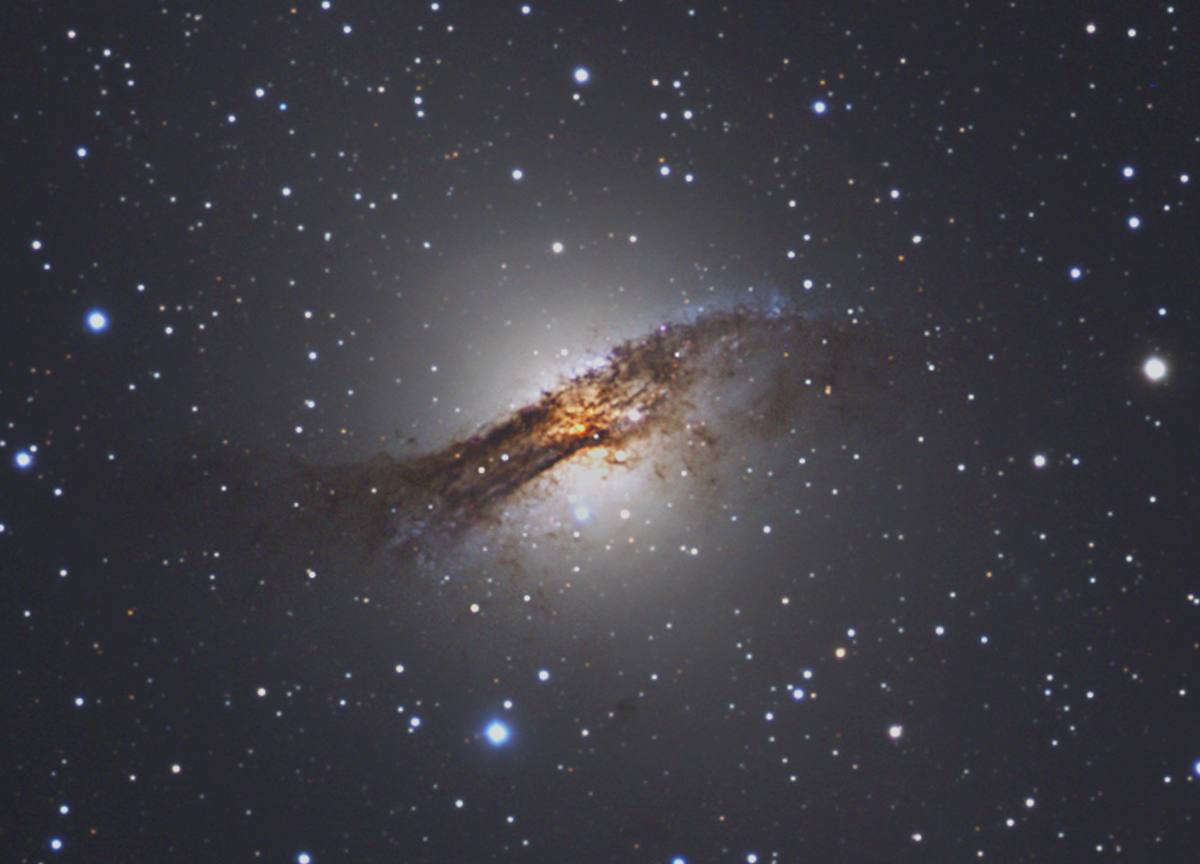
Our first glimpse into the intricacies of Centaurus A was the big picture. We soon found out that not only was the first photograph a deep study, but the study of NGC 5128 was going to go deeper as well. One of the most obvious of all features is the central dust lane which positively crackles to the eye photographically. Let’s be mindful of the radiation and get just a little closer….

In every visual representation of Centaurus A, one of the most dramatic of all features is the central dustlane. To the human eye, the dust is an obstruction – blocking the starlight and what lay beyond. But, to the camera, shifting to redder wavelengths allows us a glimpse at what lay beyond. Through carefully controlled exposures and filtering, red emission from ionized gas at the H-alpha line appears, and blue regions of star formation along the dust lane spring to life – where blue giant stars are being formed. According to 2000 study done by Wild and Eckart; “The interstellar medium of Centaurus A (NGC 5128) has been studied extensively in recent years, using mostly molecular lines tracing low to medium density gas. The amount and distribution of the dense molecular gas was largely unknown. Here we present new millimeter data of the rotational transitions and obtained spectra of the emission which traces dense molecular gas at the center and along the prominent dust lane at offset positions. We find that Centaurus A and the Milky Way are comparable in their line luminosity. However, towards the nucleus the fraction of dense molecular gas measured via the line luminosity ratio, as well as the star formation efficiency, is comparable to ultra-luminous infrared galaxies (ULIRGs). Within the off-nuclear dust lane and for Centaurus A as a whole these quantities are between those of ULIRGs and normal and infrared luminous galaxies. This suggests that most of the FIR luminosity of Centaurus A originates in regions of very dense molecular gas and high star formation efficiency.”

A highly efficient star forming region… Yes, indeed. Those brilliant blue regions you see along the edges are brand new star clusters. Merger induced star formation…

Do you see now why the dustlane in Centaurus A appears to scream? Normally star formation occurs in the dense parts of molecular clouds… collapsing themselves into a ball of plasma to form a star. But, according the work of Martig and Bournaud; “Star formation in galaxies is for a part driven by galaxy mergers. At low redshift, star formation activity is low in high-density environments like groups and clusters, and the star formation activity of galaxies increases with their isolation. This star formation-density relation is observed to be reversed at z~1, which is not explained by theoretical models so far. We study the influence of the tidal field of a galaxy group or cluster on the star formation activity of merging galaxies, using N-body simulations including gas dynamics and star formation. We find that the merger-driven star formation is significantly more active in the vicinity of such cosmological structures compared to mergers in the field. The large-scale tidal field can thus enhance the activity of galaxies in dense cosmic structures, and should be particularly efficient at high redshift before quenching processes take effect in the densest regions.”

But… But, what happens if you have a galaxy that happens to be tidally triggered into star formation and then it just happens to merge with another galaxy at the same time? Aaaaah…. You’re beginning to see the light aren’t you? The galaxy that merged with NGC 5128 was triggered into a burst of star formation, then it combined with Centaurus A and a whole new thing happened. Let’s take a look at the work of Peng and Ford: “Stellar streams in galaxy halos are the natural consequence of a history of merging and accretion. We present evidence for a blue tidal stream of young stars in the nearest giant elliptical galaxy, NGC 5128 (Centaurus A). Using optical UBVR color maps, unsharp masking, and adaptive histogram equalization, we detect a blue arc in the northwest portion of the galaxy that traces a partial ellipse with an apocenter of 8 kpc. We also report the discovery of numerous young star clusters that are associated with the arc. The brightest of these clusters is spectroscopically confirmed, has an age of 350 Myr, and may be a protoglobular cluster. It is likely that this arc, which is distinct from the surrounding shell system and the young jet-related stars in the northeast, is a tidally disrupted stellar stream orbiting the galaxy. Both the age derived from the integrated optical colors of the stream and its dynamical disruption timescale have values of 200-400 Myr. We propose that this stream of young stars was formed when a dwarf irregular galaxy, or similar-sized gas fragment, underwent a tidally triggered burst of star formation as it fell into NGC 5128 and was disrupted 300 Myr ago. The stars and star clusters in this stream will eventually disperse and become part of the main body of NGC 5128, suggesting that the infall of gas-rich dwarfs plays a role in the building of stellar halos and globular cluster systems.”

Needless to say, the developments in Centaurus A are a little shocking, aren’t they? And shocked gas is what it’s all about. Says John Graham; “Observational evidence for shock-induced star formation is found in the northeast radio lobe of the nearby radio galaxy Centaurus A (NGC 5128). A gas cloud, recently detected in H i, is impacted by the adjacent radio jet to the extent that cloud collapse is triggered and loose chains of blue supergiant stars are formed. Diffuse clouds and filaments of ionized gas have been observed near the interface of the H i cloud and the radio jet. These show velocities that cover a range of more than 550 km s−1. Line intensities in their spectra are characteristic of a shock-related origin with strong [N ii] and [S ii] relative to Hα. The [O iii]/Hα line ratio indicates a large range in excitation that is not correlated with velocity. Distinct from this component is a group of four apparently normal H ii regions that are excited by embedded young stars and whose velocities are very close to that of the H i cloud. Star formation will continue for as long as the gas cloud remains close to the radio jet. The loose chains of blue stars in the area are resolved only because NGC 5128 is so close. The reported faint blue extensions and plumes in more distant analogs probably have similar origins.”

So now we have all kinds of things we’ve learned deep inside this giant. Is there anything else we should know before we leave this part and go on? Oh, you know it… A supermassive black hole 200 million times the mass of our own Sun.

Using the infrared vision of Hubble, astronomers can now see a hot gas disk is tilted in a different direction from the orientation of the jet – the indicator of the black hole. It’s believed this may be because the merger is so recent and the disk has not yet aligned to the spin, or the galaxies may still be playing tug of war. According to Ethan Schrier of STSCI, “This black hole is doing its own thing. Aside from receiving fresh fuel from a devoured galaxy, it may be oblivious to the rest of the galaxy and the collision. We have found a complicated situation of a disk within a disk within a disk, all pointing in different directions.” The most astounding part of all is the black hole itself may possible be a merger of two independent black holes! Is this why there is core-dominated radio-loud quasars here as well? As a radio galaxy it releases 1000 times the radio energy of the Milky Way in the form of large bi-directional radio lobes that extend some 800,000 light years into intergalactic space. Well, guess what… There’s theories on that, too.

According, to Saxton, Sutherland and Bicknell, that radio source may just be a plasma bubble: “We model the northern middle radio lobe of Centaurus A (NGC 5128) as a buoyant bubble of plasma deposited by an intermittently active jet. The extent of the rise of the bubble and its morphology imply that the ratio of its density to that of the surrounding ISM is less than 10^{-2}, consistent with our knowledge of extragalactic jets and minimal entrainment into the precursor radio lobe. Using the morphology of the lobe to date the beginning of its rise through the atmosphere of Centaurus A, we conclude that the bubble has been rising for approximately 140Myr. This time scale is consistent with that proposed by Quillen et al. (1993) for the settling of post-merger gas into the presently observed large scale disk in NGC 5128, suggesting a strong connection between the delayed re-establishment of radio emission and the merger of NGC 5128 with a small gas-rich galaxy. This suggests a connection, for radio galaxies in general, between mergers and the delayed onset of radio emission. In our model, the elongated X-ray emission region discovered by Feigelson et al. (1981), part of which coincides with the northern middle lobe, is thermal gas that originates from the ISM below the bubble and that has been uplifted and compressed. The “large-scale jet” appearing in the radio images of Morganti et al. (1999) may be the result of the same pressure gradients that cause the uplift of the thermal gas, acting on much lighter plasma, or may represent a jet that did not turn off completely when the northern middle lobe started to buoyantly rise. We propose that the adjacent emission line knots (the “outer filaments”) and star-forming regions result from the disturbance, in particular the thermal trunk, caused by the bubble moving through the extended atmosphere of NGC 5128.”

And now you know just a little bit more about what’s deep inside a giant…

Many thanks to AORAIA member, Mike “Strongman” Sidonio for the use of this incredible image.

Angle of the Sun

Why Are There Seasons
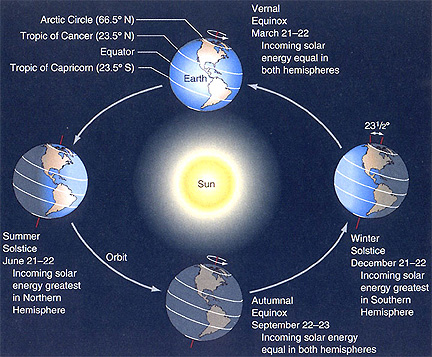
The angle of the Sun and the Earth's seasons. Image credit: NASA

[/caption]
The amount of the Sun’s energy falling at any point on the Earth depends on the angle of the Sun. This is reason why the seasons have different temperatures, and the polar regions are colder, on average than regions around the equator. Let’s take a look at why the angle of the Sun is so important, and how its change effects the Earth’s climate.

To understand how various parts of the Earth receive less energy, imagine holding a flashlight, and pointing straight at a piece of paper. Light comes out of the flashlight and forms a perfect circle on the paper. At this point, the energy from the flashlight is most concentrated in each square centimeter on the paper. Now imagine angling the paper so that the flashlight’s beam creates a big ellipse on the paper. The same amount of energy is coming out of the flashlight, but it’s being spread out across a much larger area of paper. Each square centimeter of paper is receiving less light than it was before.

Take this analogy to the Earth. When the Sun is directly overhead, like for people in the tropics, the maximum amount of energy is being soaked up by each square meter of Earth. This causes temperatures to rise. For the polar latitudes, the Sun is at a steep angle, so the same amount of energy from the Sun is falling over a much larger area.

During summer in the northern horizon, the Sun is at its maximum angle in the sky, and we get the most energy. But in the winter, the Sun is at a much steeper angle, and so we get less energy from the Sun. And this is why we experience different seasons – it’s all in the angle of the Sun.

Here’s more information from Universe Today about how the Earth has seasons. And Mars has seasons too.

Windows on the Universe has a great description of this. Here’s a handy tool you can use to calculate sunrise and sunset times, as well as the angle of the Sun.

We have recorded an episode of Astronomy Cast just about the Sun called The Sun, Spots and All.

Planetary Scientists Studying Changes in Red Spot Junior

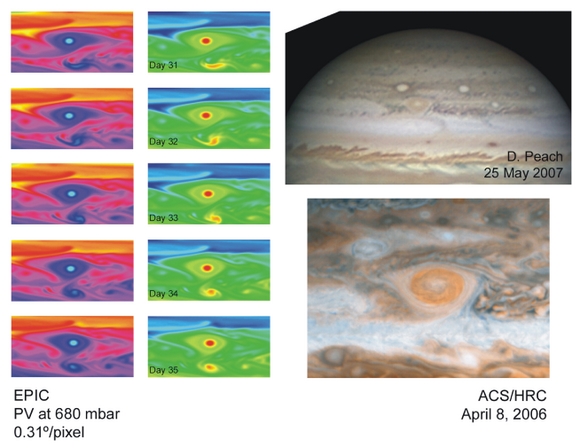
As far as storms go, nothing will rival Jupiter’s Great Red Spot (GRS). But of interest is a smaller and newer storm called Oval BA, a giant anticyclone on Jupiter also known as Red Spot Junior. ‘Smaller’ is a relative term, as although Oval BA is about half the size of GRS, it has a diameter about the size of our Earth. It formed in 2000 as several vortices converged. However, recently Oval BA has undergone some changes. Suddenly it turned from white to red in a period of just a few months, and planetary scientists are trying to understand the processes that could cause the changes. While they are able to explain some of Red Spot Junior’s attributes, they are puzzled by others.

“Our group has made an in-depth analysis of all the aspects regarding the history and evolution of Oval BA,” said Dr. Santiago Pérez-Hoyos, of the Planetary Science Group of the University of the Basque Country in Spain. “The most strongly reddened region was an annulus around its centre. However, when we calibrated images taken with the Hubble Space Telescope, we found that it didn’t actually alter in red or infrared wavelengths during the period. Instead, it became darker in blue and ultraviolet wavelengths, which made it appear visually redder.”

The apparent reddening was first reported by amateur astronomers in early 2006, but it was not until April that professional astronomers were able to image the impressive alteration of the second largest storm in the Solar System after the Great Red Spot (GRS).

Using data from Cassini, the Hubble Space Telescope, NASA’s New Horizons mission and computer models the Planetary Science Group analyzed possible causes for the color change, including alterations to dynamical, photochemical and diffusion processes.

Pérez-Hoyos said, “The most likely cause appears to be an upward and inward diffusion of either a colored compound or a coating vapor that may interact later with high energy solar photons at the upper levels of Oval BA.”

The group were able to rule out that the reddening was caused by any dynamical processes. They found no change to the strength of the “hurricane” and, although some changes in the circulation around the spot had taken place, the maximum wind speeds (which may range up to 400 kilometers per hour or more) were consistent with measurements previous to 2000 of the storms that combined to form Oval BA.

The group modeled the wind flow in detail using high resolution simulations, in order to understand why the red material may be confined to the annulus region and how the color change happened in the observed time scales. The model accounts well for the temperature and wind structure inside the oval BA.

Models also showed that the change could not be attributed to interactions of Oval BA with the GRS, which were relatively close at the time. The flow around both vortices is in the zonal directions and is so strong that separates both storms

The oval height did not change over the period and there were no large changes in the temperature gradient of the oval.

Pérez-Hoyos said, “There is much to be understood about this problem yet. Future spacecraft missions and a continuous observation of the planet (as done by amateur astronomers) will surely give us new clues on the behaviour of Jupiter’s atmosphere that will result in a better understanding of it.”
The team presented their findings at the European Planetary Science Congress in Münster on Monday, 22nd September.

Source: European Planetary Conference

Why is Mars’ Southern Polar Cap Crooked?

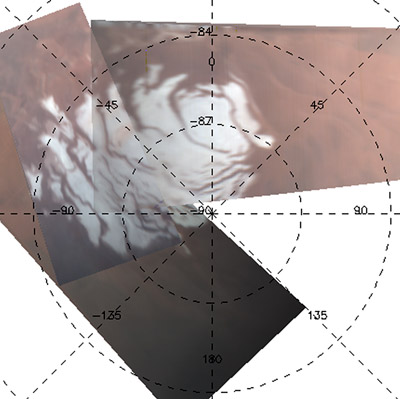
Mars Express Data from Mars South Pole. Credits: ESA/ Image Courtesy of F. Altieri (IFSI-INAF) and the OMEGA team

[/caption]
Like Earth, Mars has frozen polar caps, but unlike Earth, these caps are made of carbon dioxide ice as well as water ice. During the southern hemisphere’s summer, much of the ice cap sublimates, or evaporates directly to a gas, but leaves behind what is known as the residual polar cap. The problem is that while the winter cap is symmetrical about the south pole, the residual cap is offset by some three to four degrees. Using data from ESA’s Mars Express spacecraft, scientists say two things are to blame: the Martian weather system, and interestingly, so is the largest impact crater on Mars – even though it is nowhere near the south pole.

Using the Planetary Fourier Spectrometer (PFS) onboard Mars Express, Marco Giuranna of the Istituto di Fisica dello Spazio Interplanetario CNR (IFSI), Rome, Italy, and colleagues have measured the temperature of Mars’ atmosphere from the ground up to an altitude of 50 km above the south polar region.

They charted the way the atmosphere changes in temperature and other characteristics over more than half a Martian year, and monitored the way carbon dioxide builds into the southern ice cap as the autumn turns into winter on Mars. “It is not a straightforward process. We found that two regional weather systems developed from mid-fall through the winter,” says Giuranna.

These weather systems are derived from strong eastward winds that blow straight into the Hellas Basin, the largest impact structure on Mars with a diameter of 2300 km and a depth of 7 km. The crater’s depth and the steep rise of the walls deflect the winds and create what are called Rossby waves on Earth. This creates a low pressure system near the south pole in the western hemisphere and a high-pressure system in the eastern hemisphere, again near the south pole.

Giuranna found that the temperature of the low-pressure system is often below the condensation point for carbon dioxide, so the gas condenses and falls from the sky as snow and builds up on the ground as frost. In the high-pressure system, the conditions are never appropriate for snow, so only ground frost occurs. Thus, the south polar cap is built by two different mechanisms.

The areas that have extensive snow cover do not sublimate in the summer because they reflect more sunlight back into space than the surface frost. Frost grains tend to be larger than snow grains and have rougher surfaces. The ragged texture traps more sunlight, driving the sublimation.

So the western area of the southern polar cap, built of snow and frost, not only has a larger amount of carbon dioxide ice deposited but also sublimates more slowly during the summer, while the western area built of frost disappears completely. This explains why the residual cap is not symmetrically placed around the south pole.

“This has been a martian curiosity for many years,” says Giuranna. Thanks to Mars Express, planetary scientists now understand a new facet of this amazing, alien world.

Source: ESA

Earth’s Precious Metals Could Be From Meteorites and Asteroids

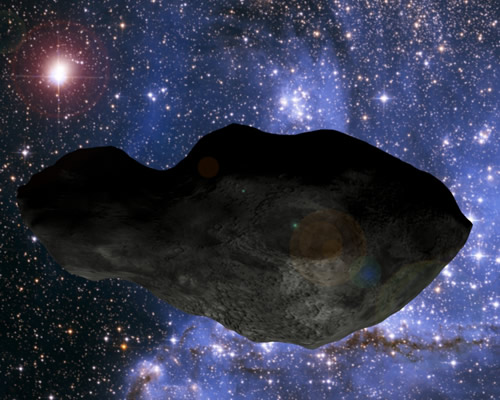
Artist impression of the Asteroid Kleopatra. Credit: NASA

[/caption]

Meteorites and asteroids from the inner solar system could be responsible for Earth’s store of precious metals such as platinum and iridium, brought to our nascent planet during the period of Late Heavy Bombardment, about 4,000 million years ago. Dr. Gerhard Schmidt from the University of Mainz, Germany, has calculated that about 160 metallic asteroids of about 20 kilometers in diameter would be sufficient to provide the concentrations of these metals, known as Highly Siderophile Elements (HSE), found in the Earth’s crust. “A key issue for understanding the origin of planets is the knowledge of the abundances of HSE in the crust and mantle of the Earth, Mars and the Moon. We have found remarkably uniform abundance distributions of HSE in our samples of the Earth’s upper crust. A comparison of these HSE values with meteorites strongly suggests that they have a cosmo-chemical source,” said Schmidt.

Schmidt and his colleagues have spent the last 12 years analyzing the concentrations of HSE at meteorite impact sites around the world, as well as in the samples from the Earth’s mantle and crust. In addition, he has compared the data from the Earth with data from impact breccias from the Moon brought by the Apollo missions and Martian meteorites, believed to be samples from the mantle and crust on Mars.

As the Earth formed, the heavy elements, including HSE that were present, sank to form the iron and nickel-rich metallic core. HSE were added again later by meteorite impacts, creating a veneer of material over the Earth’s surface after the core had formed, about 20-30 million years after the planet’s accretion. This could have been by the collision with a Mars-sized impactor that led to the formation of the Moon.

However, Schmidt believes that the meteorites responsible for the HSE elements on Earth are iron or stony-iron meteorites that match up with theoretical predications of asteroids formed in the Mercury-Venus region of our solar system.

Different classes of meteorites have characteristic elemental ratios of HSE that give indications where in the Solar System they formed. Chondrites are stony meteorites that represent the pristine material from the early Solar System, and iron or stony-iron meteorites, which are fragments of larger asteroids that had enough internal heat in the past to form a molten metal core. These most likely would have formed in the inner solar system.

The ratios of HSE found in Earth’s crust bear a much closer resemblance to iron or stony-iron meteorites, and Schmidt believes these meteorites came from the inner solar system.

There’s a problem, however. Of the 175 known impact craters on Earth, remains of the projectiles have been found for about 40, and none of these meteorites have been identified as being formed in the region between Mercury and Venus.

Intriguingly, some of the Martian meteorites found in Antarctica, which are probably represent samples of the Martian crust also have HSE values that resemble groups of iron meteorites and stony irons, suggesting that a similar process took place on Mars.

Rock on Mars found by Opportunity rover, believed to be a meteorite.  Credit:  NASA/JPL
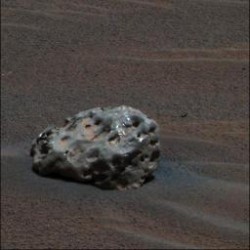
Rock on Mars found by Opportunity rover, believed to be a meteorite. Credit: NASA/JPL

Also, the first meteorite found on Mars by the Opportunity Mars Exploration Rover in 2005 was an iron
meteorite.

Dr. Schmidt presented his findings at the European Planetary Science Congress in Muenster on Monday, 22nd September.

Source: European Planetary Science Conference Press Release

Deep Inside a Giant – Centaurus A by Mike Sidonio

Centaurus A - Ultra-Deep by Mike Sidonio

[/caption]

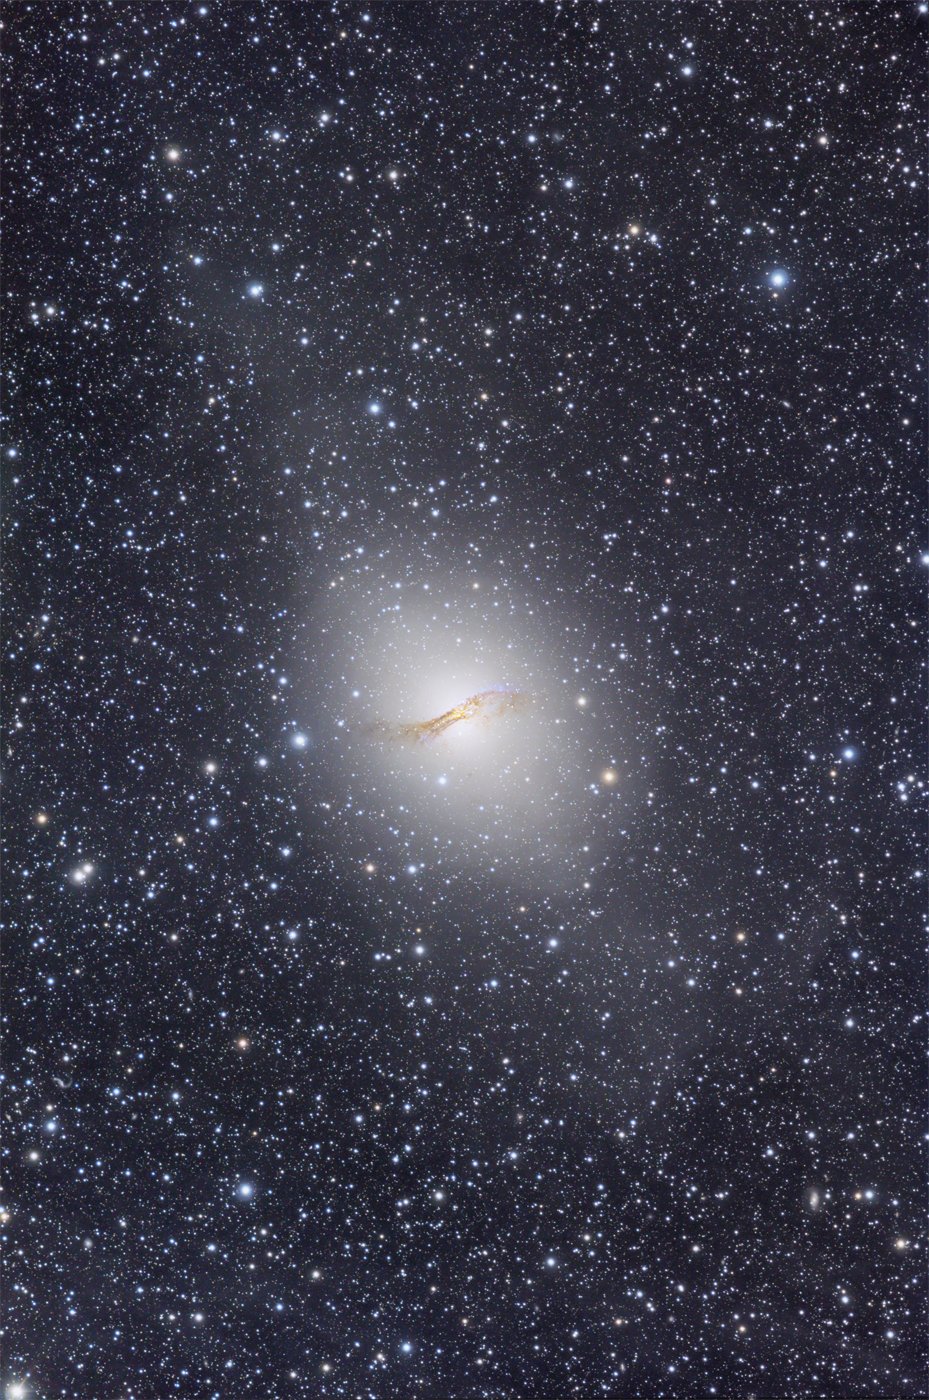
Before you dismiss this as just another photo of Centaurus A, you better look again. It’s way deeper… First discovered by James Dunlop on August 4, 1826 this incredible galaxy known as Centaurus A (NGC 5128) has been tickling the imagination of astronomers since John Herschel described it as “two semi-ovals of elliptically formed nebula appearing to be cut asunder and separated by a broad obscure band parallel to the larger axis of the nebula, in the midst of which a faint streak of light parallel to the sides of the cut appears.” in 1847. What makes this incredible galaxy tick? Step inside and let’s find out…

Regardless of the fact that J. Herschel pointed out NGC 5128’s unusual characteristics, it would be 102 years before astronomy really took this galaxy seriously – not because the science didn’t progress – but because there just wasn’t any large optical telescopes located in the southern hemisphere. However, things were about to change drastically in 1949 when the 80-foot radio antenna at Dover Heights, Australia went on-line. There astronomers John Bolton, G. Stanley, and Bruce Slee were the first to identify Centaurus A as a powerful radio galaxy – the first source to be linked to an extra-galactic hot spot.

But just how hot is it? Try a study done in July 2008 by Cuoco and Hannestad searching for ultrahigh energy neutrinos from Centaurus A and the Auger hot spot. “The Pierre Auger Collaboration has reported a correlation between ultrahigh energy cosmic rays (UHECR) and nearby active galactic nuclei (AGN) within Ëœ75Mpc. Two of these events fall within 3 degrees from Centaurus A (Cen A), the nearest AGN, clearly suggesting that this object is a strong UHECR emitter. Here we pursue this hypothesis and forecast the expected rate of ultrahigh energy neutrinos in detectors like IceCube. In our baseline model we find a rate of Ëœ0.4–0.6yr-1 events above a threshold of 100 TeV, the uncertainty of which is mainly related to the poor knowledge of the physical parameters of the source and details of the model. This situation will improve with detailed high energy gamma ray measurements of Cen A by the upcoming Gamma Ray Large Area Space Telescope (GLAST) satellite. This would make Cen A the first example where the potential of high energy multi messenger astronomy is finally realized.”

Now, let’s go back in time… Back to 1954 at Palomar Observatory’s twin telescopes with Walter Baade and Rudolph Minkowski. It was then the first proposal was made that the bar of dark dust bisecting the galaxy was the result of a merger between two galaxies – a giant elliptical and a small spiral. “The radio source Cygnus A is an extragalactic object, two galaxies in actual collision.” This simple observation was again confirmed in 2005 by Karataeva (et al); “We present the results of stellar photometry in eight fields of NGC 5128 (Cen A), a candidate polar-ring galaxy, obtained by reducing images from the Hubble Space Telescope archive. In all cases, the color-magnitude diagrams reached the red-giant region, and the distance to the galaxy was determined from the position of the tip of the red-giant branch (4.1 Mpc), in agreement with previous estimates. Comparison of the diagrams with theoretical isochrones indicates that the red supergiants in the dark lane region are metal-rich, which is atypical of the polar rings. Our results are consistent with the assumption made by several authors that the absorption of a less massive spiral galaxy by a more massive one is observed in NGC 5128.”

But, that’s not all that’s coming off Centaurus A. Massive amounts of X-rays have been detected as well, with the very first picked up in 1970 with the use of a sounding rocket and then confirmed by the UHURU satellite. The emission was very localized, but it wasn’t steady, it changed in intensities. Again, scientific curiosity was aroused and again, an answer was found – a black hole. According to the work of Marconi (et al): “We present new HST Space Telescope Imaging Spectrograph observations of the nearby radio galaxy NGC 5128 (Centaurus A). The bright emission line with longest wavelength accessible from HST was used to study the kinematics of the ionized gas in the nuclear region. The STIS data were analized in conjunction with the ground-based near-infrared Very Large Telescope ISAAC spectra to infer the presence of a supermassive black hole and measure its mass. We performed a detailed analysis of the effects on MBH of the intrinsic surface brightness distribution of the emission line, a crucial ingredient in the gas kinematical analysis. The observed velocity dispersion in our spectra can be matched with a circularly rotating disk and also the observed line profiles and the higher order moments in the Hermite expansion of the line profiles, h3 and h4, are consistent with emission from such a disk. To our knowledge, Centaurus A is the first external galaxy for which reliable BH mass measurements from gas and stellar dynamics are available and, as in the case of the Galactic Center, the MBH gas kinematical estimate is in good agreement with that from stellar dynamics. Thus Centaurus A ranks among the best cases for supermassive Black Holes in galactic nuclei.”

Yet, is that all there is? No. As early as 1972, gamma ray emissions from NGC 5128 were being explored. Which, according to the work of Ozernoy and Aharonian, may very well be tied to the black hole itself. “An analysis of the experimental data on nuclear gamma-ray lines from Cen A reveals essential energetic difficulties, associated with the usual interpretation of these lines as a result of interactions of subcosmic rays with interstellar gas; since the necessary instantaneous energy loss rate of the cosmic rays should reach tremendous values. These difficulties are eliminated if the gamma rays are produced in the relativistic non-isothermal plasma near a compact source of activity — such as a massive black hole or a magnetoid (spinar).”

But don’t stop there. By the late 1970, John Graham had also discovered an outer gas shell from the galactic merger – a shell which was studied again in 2008 by Stickel (et al): “Deep far-infrared (FIR) imaging data detected the thermal emission from cold dust in the northern shell region of NGC5128 (Centaurus A), where previously neutral hydrogen and molecular gas has been found. These observations are in agreement with recent theoretical considerations that in galaxy interactions leading to stellar shell structures the less dissipative clumpy component of the ISM from the captured galaxy can lead to gaseous shells. Alternatively, the outlying gas and dust could be a rotating ring structure resulting from an interaction or even late infall of tidal material of a merger in the distant past. With all three components (atomic gas, molecular gas, dust) of the ISM present in the northern shell region, local star formation may account for the chains of young blue stars surrounding the region to the east and north. The dust cloud may also be involved in the disruption of the large scale radio jet before entering the brighter region of the northern radio lobe.”

But, let’s get down here. The photo at the top of this page wasn’t taken with the Hubble. It didn’t go through Chandra. It was taken by a very dedicated amateur astronomer named Mike Sidonio who understood exactly what needed to be done to capture all the true beauty of this too-often photographed sky gem. Says Mike; “This unique and extremely deep colour image, compiled from nearly 20 hours of exposure with just a 6” telescope, was taken from a very dark sky in remote Australia. The image reveals the full outer halo of the peculiar radio galaxy Centaurus A (NGC 5128) in Centaurus including faint polar extensions extending from the top and bottom of the galaxy running diagonally. Also evident in this image is the extensive but extremely faint Milky Way nebulosity and dust known as “Galactic Cirrus” or “Integrated Flux” that permeates this entire region. Galactic Cirrus material lies just above the plane of our galaxy and is lit by the light of The Milky Way as a whole but due to its extreme faintness at 27mag/sq arc sec, is seldom seen in images, it is visible as faint patches of dusty looking nebulosity all over the image. The Cirrus nebulosity around Centaurus A is some of the faintest in the sky and is well below the natural sky brightness. Countless distant background galaxies of all shapes and sizes can be found scattered all over the field of view as well.”

But Mike isn’t just any astrophotographer. He’s won numerous Malin awards and Astro Awards. His work has been featured in magazines such as Sky & Telescope and Astronomy, as well as Astronomy Picture of the Day, and this single Centaurus A image is only a small fraction of the study Mr. Sidonio did on this subject. For those of you who are curious, I would highly suggest visiting Mike Sidonio’s Centaurus A Pages, where each individual image takes you on an ever deeper visual journey into this fascinating galaxy.

Many thanks to AORAIA member, Mike “Strongman” Sidonio for the use of this incredible image.

Helium Leak Forces LHC Shutdown for at Least Two Months

A series of problems forced LHC shutdown (CERN/LHC)

[/caption]
It’s this sort of news I really did not want to wake up to. At 0927 GMT Friday morning, a fault known as a “quench” resulted in the leakage of a tonne of helium coolant causing 100 of the LHC superconducting magnets to heat up 100°C. The fire services had to be called and it was some time before engineers could access the tunnels to assess the damage. It was worse than they were expecting. Although no one was hurt and there was no danger to the public, the once-supercooled magnets were one hundred times warmer than they should be and optimal vacuum conditions had been lost. To perform repairs, the rest of the damaged sector will need to be warmed up and then slowly cooled down again, resulting in a shutdown of LHC operations for at least two months

The leak occurred between the Alice and CMS detectors (sectors 3-4) after repairs to the faulty 30-tonne transformer were being finalized and the systems were being powered up to begin a new series of commissioning tests. According to the LHC logbooks, temperatures rose by 100°C and the vacuum required within the equipment for particle circulation to be possible was lost. Engineers had to wait for oxygen levels to return to normal within the tunnels before they could investigate the “meltdown.”

Although last week’s fault with the transformer caused frustration, setting LHC experiments back by a few days, scientists were optimistic the incident would have minimal effect on the first scheduled particle collisions in October. Friday’s quench, however, is a serious incident, knocking the largest experiment mankind has ever attempted offline for at least two months. Although this is sad news, many scientists are keeping a positive attitude:

This kind of incident was always a possibility with such a unique and demanding project, that’s why we were so tense on the 10th [of September]. Having seen those tantalising first signs of beam in our detectors, everyone is raring to go. So it’s really disappointing, and hard for us to keep in perspective right now. But a delay like this in a 20-year project isn’t an utter disaster and I’m sure the team at Cern will fix it, and make it more robust as they go.” – Prof Jonathan Butterworth of University College London, the UK head of the Atlas detector.

So what happened? The basic operating conditions for the LHC depend on very low temperatures and a very high vacuum state. It would appear both key conditions were lost as engineers tested the electrics of the LHC in the run-up to full commissioning. There was a faulty connection between two of the superconducting magnets, so when the system was switched on, the high current melted the connection, causing the helium leak. The loss of supercooled helium caused a rapid release of stored energy (an event known as a quench), heating the magnets and destabilizing the vacuum conditions.

After such a smooth start to the first proton circulation on September 10th, these setbacks may come as a surprise. However, probing the frontier of physics rarely happens without a few hiccups along the way, so let’s hope this incident will be the last and we can once again look forward to the first particle collisions toward the end of the year…

Sources: BBC, Telegraph

Pentax Eyepieces – Observatory Quality

Back awhile ago I did a review on plossl eyepieces. In that article I was trying to reach for the average individual looking for a high quality eyepiece on a limited budget. This time I asked for an example of observatory quality eyepieces that I know some of our readers own and enjoy. Is there a difference between how a very expensive eyepiece behaves in average equipment as opposed to an average eyepiece? Is there a difference in how it behaves in observatory class equipment? Step inside and let’s take a look…

The reputation of certain eyepieces sometimes precedes itself and the case is certainly true when it comes to Pentax Eyepieces. Known widely for delivering superb color correction and outstanding contrast, I was very anxious for these beauties to arrive and put them to the test. In this case, I have asked for the Pentax XW series, which would put it in the Erfle category – alongside such popular brands as the Nagler, the Panoptic, the Ultima LX and the QX series. In dollar amounts, the Pentax figures roughly in the same category as the first two aforementioned products, and roughly three times more expensive than the last two. But is the performance worth the price?

High dispersion, low refraction lanthanum glass… These are great words, but nothing can match the precision machined quality of the outward appearance of a Pentax eyepiece. Absolutely nothing in its construction appears to be left to chance and I very much approved not only of how the body of the eyepieces appears to be “sealed”, but the fact that they have very positive grip surfaces and little safety grooves cut right into the barrel so they can’t accidentally fall out of the focuser. I can also see from examination that the insides are blackened to reduce internal reflections and that the eyepieces are fully threaded for filters… But how do they perform?

The last of the three eyepieces I asked to test was the Pentax 40mm XW 2″ Eyepiece. If you are looking for a true observatory quality eyepiece, look no further. Combined with aperture, the 40mm delivers a wide, true field that only marginally suffers from vignetting around the edges with fast focal ratio telescopes and virtually disappears as the focal length increases. Once again, we are talking about an eyepiece that was made to perform with eye sight limitations and with just a few minor adjustments, a total pinpoint panorama of stars can be yours. While I’ve used a lot of Erfle design eyepieces, this is perhaps the first low power, wide field Erfle that I’ve used that didn’t require me to hold my head just right to take in the view. With or without glasses…

My next step was to take this eyepiece arrangement and put them to the test in a true observatory telescope – a 31″ f/7. Eyepiece after eyepiece… Outstanding performance, perfect color correction and incredible eye relief. Is seeing believing? Yes and no. In my mind to deem something “observatory quality”, it has to measure up to the bar that I set for it – and that means the durability of use that an observatory eyepiece will go through in years of service. While I can field test an eyepiece for performance qualities, what I can’t tell you is what will happen to it ten years down the road. So… I investigated.

There’s a good reason why I admired the construction of the Pentax eyepieces when I first examined them – they are weather-proof. While you would not want to drop them in a bucket of water, these eyepieces are all rated JIS Class 4. Just what does that mean? It means that dust and particles sized 1.0mm in diameter or more cannot infiltrate. It means water splashed against the enclosure from any direction shall have no harmful effects. It means that by Pentax standards they actually sprayed these eyepieces down with a stream of water for 10 minutes and nothing reached the internal lenses. It means Pentax guarantees these eyepieces for life.

In the long run, Pentax eyepieces are an investment – a worthy investment in observatory quality.

The Pentax Eyepieces provided for this review were supplied by Oceanside Photo and Telescope.