Composite Volcano

Mount Fuji - a composite volcano

[/caption]
Geologists have identified 3 major types of volcanoes. There’s the shield volcano, formed from low viscosity lava that can flow long distances. There are cinder cone volcanoes, which are made by the eruption of lava, ash and rocks that build up around a volcanic vent. But the last type is the composite volcano, and these are some of the most famous volcanoes (and most dangerous) in the world.

A composite volcano is formed over hundreds of thousands of years through multiple eruptions. The eruptions build up the composite volcano, layer upon layer until it towers thousands of meters tall. Some layers might be formed from lava, while others might be ash, rock and pyroclastic flows. A composite volcano can also build up large quantities of thick magma, which blocks up inside the volcano, and causes it to detonate in a volcanic explosion.

Composite volcanoes are fed by a conduit system which taps into a reservoir of magma deep within the Earth. This magma can erupt out of several vents across the composite volcano’s flanks, or from a large central crater at the summit of the volcano.

Some of the most famous volcanoes in the world are composite volcanoes. And some of the most devastating eruptions in history came from them. For example, Mount St. Helens, Mount Pinatubo, and Krakatoa are just examples of composite volcanoes that have erupted. Famous landmarks like Mount Fuji in Japan, Mount Ranier in Washington State, and Mount Kilimanjaro in Africa are composite volcanoes that just haven’t erupted recently.

When large composite volcanoes explode, they can leave behind a collapsed region called a caldera. These are deep, steep-walled depressions which marked the location of the volcano. And it’s in this region that a new composite volcano will build back up again.

Another name for composite volcanoes are stratovolcanoes.

We have written many articles about composite volcanoes for Universe Today. Here’s an article about the recent eruption of Mount Redoubt in Alaska, and here’s an article about Mount Etna.

You can learn more about composite volcanoes from the USGS.

And we have recorded an entire episode of Astronomy Cast just about volcanoes. Listen to it here, Episode 141: Volcanoes, Hot and Cold.

Who Discovered Jupiter?

Jupiter from the newly refurbished Hubble. Credit: NASA, ESA, M. Wong (Space Telescope Science Institute, Baltimore, Md.), H. B. Hammel (Space Science Institute, Boulder, Colo.), and the Jupiter Impact Team

[/caption]
Jupiter is one of the 5 planets visible with the unaided eye. That means you can go out on a clear night, when Jupiter is up in the sky, and see it with your own eyes. No telescope is necessary. In fact, it’s one of the brightest objects in the sky. When Jupiter is there, it’s hard not to see it. So it’s kind of hard to wonder who discovered Jupiter, since humans would have known about it for tens of thousands of years.

Ancient astronomers didn’t have telescopes, but they knew there was something strange about the planets. They tracked the motion of the planets with incredible accuracy and believed that they were somehow associated with gods in their mythologies. Jupiter is named after the Roman god, thought to be the head of the gods; he’s the same as Zeus in Greek mythology.

Perhaps a better question might be, who discovered Jupiter the planet. In other words, when did astronomers realize that Jupiter was really a planet. That discovery happened when astronomers realized that the Earth was really just a planet as well, orbiting the Sun in the Solar System. The new model for the Solar System was developed by Nicolaus Copernicus in the 16th century. By placing the Sun at the center of the Solar System, Copernicus developed a model that better explained the motions of the planets as they moved through the sky.

This model was confirmed when Galileo pointed his first rudimentary telescope at Jupiter. What he saw was the disk of Jupiter and the 4 largest moons orbiting the planet. Since all the heavenly bodies were thought to orbit the Earth, it was thought to be impossible for objects to orbit one another.

Once astronomers knew that Jupiter was a planet, and they had better telescopes to study it, the exploration of Jupiter could really begin. Better and better images were taken of the planet, and more moons and even rings were discovered orbiting the planet.

And then in the space age, the first spacecraft were sent to explore Jupiter. The first spacecraft to arrive at Jupiter was NASA’s Pioneer 10 in 1973, followed by Pioneer 11 a few months later. These spacecraft returned images of Jupiter’s swirling cloud tops, discovered more about its composition, and revealed features of its moons.

We have written many articles about the discovery of planets in the Solar System. Here’s an article about the discovery of Uranus, and another about the discovery of Neptune.

You can also learn more about Jupiter from NASA’s Solar System Exploration Guide to Jupiter.

We have also recorded an episode of Astronomy Cast all about Jupiter. Listen to it here, Episode 56: Jupiter.

Reference:
NASA

Best Ever View of Andromeda in Ultraviolet

Andromeda by the Swift Telescope. Credit: NASA/Swift/Stefan Immler (GSFC) and Erin Grand (UMCP)

[/caption]
Normally, the Swift satellite is searching for distant cosmic explosions. But recently it took some time to take a long look (total exposure time: 24 hours) with its ultraviolet eyes at the Andromeda galaxy, a.k.a. M31. The result is this gorgeous image. “Swift reveals about 20,000 ultraviolet sources in M31, especially hot, young stars and dense star clusters,” said Stefan Immler, a research scientist on the Swift team at NASA’s Goddard Space Flight Center. “Of particular importance is that we have covered the galaxy in three ultraviolet filters. That will let us study M31’s star-formation processes in much greater detail than previously possible.”

Compare this image to an optical version taken by a ground-based telescope:

Andromeda.  Credit: Bill Schoening, Vanessa Harvey/REU program/NOAO/AURA/NSF
Andromeda. Credit: Bill Schoening, Vanessa Harvey/REU program/NOAO/AURA/NSF

M31, also known as the Andromeda Galaxy, is more than 220,000 light-years across and lies 2.5 million light-years away. On a clear, dark night, the galaxy is faintly visible as a misty patch to the naked eye.

Between May 25 and July 26, 2008, Swift’s Ultraviolet/Optical Telescope (UVOT) acquired 330 images of M31 at wavelengths of 192.8, 224.6, and 260 nanometers.

“Swift is surveying nearby galaxies like M31 so astronomers can better understand star- formation conditions and relate them to conditions in the distant galaxies where we see gamma-ray bursts occurring,” said Neil Gehrels, the mission’s principal investigator. Since Swift’s November 2005 launch, the satellite has detected more than 400 gamma-ray bursts — massive, far-off explosions likely associated with the births of black holes.

For more info on this image see this page from NASA. There’s also a podcast from Swift about this image, as well.

Exosphere

Exosphere

[/caption]
The Earth’s atmosphere is broken up into several distinct layers. We live down in the troposphere, where the atmosphere is thickest. Above that is the stratosphere, then there’s the mesosphere, thermosphere and finally the exosphere. The top of the exosphere marks the line between the Earth’s atmosphere and interplanetary space.

The exosphere is the outermost layer of the Earth’s atmosphere. It starts at an altitude of about 500 km and goes out to about 10,000 km. Within this region particles of atmosphere can travel for hundreds of kilometers in a ballistic trajectory before bumping into any other particles of the atmosphere. Particles escape out of the exosphere into deep space.

The lower boundary of the exosphere, where it interacts with the thermosphere is called the thermopause. It starts at an altitude of about 250-500 km, but its height depends on the amount of solar activity. Below the thermopause, particles of the atmosphere have atomic collisions, like what you might find in a balloon. But above the thermopause, this switches over to purely ballistic collisions.

The theoretical top boundary of the exosphere is 190,000 km (half way to the Moon). This is the point at which the solar radiation coming from the Sun overcomes the Earth’s gravitational pull on the atmospheric particles. This has been detected to about 100,000 km from the surface of the Earth. Most scientists consider 10,000 km to be the official boundary between the Earth’s atmosphere and interplanetary space.

We have written several articles about the Earth’s atmosphere for Universe Today. Here’s an article about an evaporating extrasolar planet, and this article explains how far away space is.

You can learn more about the layers of the atmosphere, including the exosphere from this page at NASA.

We have recorded a whole episode of Astronomy Cast talking about the Earth’s (and it’s atmosphere). Check it out here, Episode 51: Earth.

Phoenix’s Telltale Tells All About Winds and Weather on Mars

The Telltale instrument on the Phoenix lander. Credit: University of Aarhus.

[/caption]
On board the plucky little Phoenix Mars lander was an even pluckier and littler device called the Telltale. It measured, for the first time, wind speeds and directions at the Mars polar region. Scientists have now been able to summarize the results from the Telltale, and presented their findings at the European Planetary Science Conference in Potsdam, Germany. They shared some unexpected new findings about the weather on Mars.

“Telltale has given us a wealth of information about the local Martian wind velocities and directions. At the Phoenix landing site, we were able to see meteorological changes caused by interactions between the dynamic north pole, where there are ever changing evaporation processes, and the Martian atmosphere,” said Dr. Haraldur Gunnlaugsson.

Artists rendition of Phoenix on Mars. Credit: NASA/JPL

As you recall, Phoenix landed in the North polar region of Mars on May 25, 2008 and operated successfully for about 5 Earth months, or 151 Martian sols. The Telltale device consisted of a lightweight tube suspended on top of a meteorological mast, roughly two meters above the local surface. The device had to be sensitive enough to detect very light breezes, but also be able to withstand the violent vibrations during the mission launch. After landing on Mars, Phoenix’s onboard camera continuously imaged the deflection of the tube in the wind, taking more than 7,500 images during the mission.

The astronomers/meteorologists found the wind speeds and directions varied as the seasons changed. Easterly winds of approximately 15-20 kilometers per hour prevailed during the Martian mid-summer, but when autumn approached, the winds increased and switched to come predominantly from the West. While these winds appeared to be dominated by turbulence, the highest wind speeds recorded of up to nearly 60 kilometers per hour coincided with the passing of weather systems, when also the number of dust devils increased by an order of magnitude.

Mars is typically a rather windy place and learning more about the planet’s climatic conditions will contribute to the understanding of the Martian water cycle and the identification of areas on the red planet that could sustain life. Local wind measurements by the Telltale instrument, amended with daily images of the whole northern hemisphere by the Mars Reconnaissance Orbiter spacecraft, have allowed astronomers to gain much deeper information on weather systems on Mars.

“We’ve seen some unexpected night-time temperature fluctuations and are starting to understand the possible ways dust is put into suspension in the Martian atmosphere. For example, we could see that some of the dust storms on Mars do not require the existence of high winds,” said Dr Gunnlaugsson.

Source: Europlanet

What! No Parallel Universe? Cosmic Cold Spot Just Data Artifact

Region in space detected by WMAP cooler than its surroundings. But not really. Rudnick/NRAO/AUI/NSF, NASA.

Rats! Another perplexing space mystery solved by science. New analysis of the famous “cold spot” in the cosmic microwave background reveals, and confirms, actually, that the spot is just an artifact of the statistical methods used to find it. That means there is no supervoid lurking in the CMB, and no parallel universe lying just beyond the edge of our own. What fun is that?

Back in 2004, astronomers studying data from the Wilkinson Microwave Anisotropy Probe (WMAP) found a region of the cosmic microwave background in the southern hemisphere in the direction of the constellation of Eridanus that was significantly colder than the rest by about 70 microkelvin. The probability of finding something like that was extremely low. If the Universe really is homogeneous and isotropic, then all points in space ought to experience the same physical development, and appear the same. This just wasn’t supposed to be there.

Some astronomers suggested the spot could be a supervoid, a remnant of an early phase transition in the universe. Others theorized it was a window into a parallel universe.

Well, it turns out, it wasn’t there.

Ray Zhang and Dragan Huterer at the University of Michigan in Ann Arbor say that the cold spot is simply an artifact of the statistical method–called Spherical Mexican Hat Wavelets–used to analyze the WMAP data. Use a different method of analysis and the cold spot disappears (or at least is no colder than expected).

“We trace this apparent discrepancy to the fact that WMAP cold spot’s temperature profile just happens to favor the particular profile given by the wavelet,” the duo says in their paper. “We find no compelling evidence for the anomalously cold spot in WMAP at scales between 2 and 8 degrees.”

This confirms another paper from 2008 also by Huterer along with colleague Kendrick Smith from the University of Cambridge who showed that the huge void could be considered as a statistical fluke because it had stars both in front of and behind it.

And in fact, one of the earlier papers suggesting the cold spot by Lawrence Rudnick from the University of Minnesota does indeed say that statistical uncertainties have not been accounted for.

Oh well. Now, on to the next cosmological mysteries like dark matter and dark energy!

Zhang and Huterer’s paper.

Huterer and Smith’s paper (2008)

Rudnick’s paper 2007

Original paper “finding” the cold spot

Sources: Technology Review Blog, Science

Smallest Expoplanet Yet Has Rocky Surface

The exoplanet Corot-7b is so close to its Sun-like host star that it must experience extreme conditions. Sister planet, CoRot-7c is seen in the distance. Credit: ESO

[/caption]
More details are emerging on the extrasolar planet that was discovered by the CoRoT satellite back in February. New information about this planet make it first in many respects: It is the smallest known exoplanet, it is the closest exoplanet yet to its host star, which also makes it the fastest; it orbits its star at a speed of more than 750,000 kilometers per hour. Plus, data reveal the presence of twin sister planet, another so-called super-Earth called CoRot-7c in this alien solar system. Was Obi-wan wise to conceal it?

(Sorry, couldn’t resist the twin sister/Star Wars reference….)

“This is science at its thrilling and amazing best,” says Didier Queloz, leader of the team that made the observations. “We did everything we could to learn what the object discovered by the CoRoT satellite looks like and we found a unique system.”

Back in February, the team of astronomers weren’t sure if this was a rocky planet or a possibly a theoretical “ocean world.” In theory, such planets would initially be covered partially in ice and they would later drift towards their star, with the ice melting to cover it in liquid.

But the temperatures on this planet would mean whatever is on the surface of this planet is likely boiling, whether it be water or lava. The probable temperature on its “day-face” is above 2,000 degrees, but minus 200 degrees on its night face. Undoubtedly, this is an extreme environment.

The star TYC 4799-1733-1, now known as CoRot-7, and its satellites have been studied intensely since February with many telescopes on the ground. The system is located towards the constellation of Monoceros (the Unicorn) at a distance of about 500 light-years. Slightly smaller and cooler than our Sun, CoRoT-7 is also thought to be younger, with an age of about 1.5 billion years.
Demonstration image of transiting exoplanet. Credit: ESO
Every 20.4 hours, the planet eclipses a small fraction of the light of the star for a little over one hour by one part in 3,000. CoRoT-7b is only 2.5 million kilometres away from its host star, or 23 times closer than Mercury is to the Sun.

The initial set of measurements, however, could not provide the mass of the exoplanet. Such a result requires extremely precise measurements of the velocity of the star, which is pulled a tiny amount by the gravitational tug of the orbiting exoplanet. The problem with CoRoT 7b is that these tiny signals are blurred by stellar activity in the form of “starspots” (just like sunspots on our Sun), which are cooler regions on the surface of the star. Therefore, the main signal is linked to the rotation of the star, with makes one complete revolution in about 23 days.

To help look closely, astronomers used the High Accuracy Radial velocity Planet Searcher (HARPS) spectrograph attached to the ESO 3.6-metre telescope at the La Silla Observatory in Chile. This device is turning out to be one of the best planet hunters around.

“Even though HARPS is certainly unbeaten when it comes to detecting small exoplanets, the measurements of CoRoT-7b proved to be so demanding that we had to gather 70 hours of observations on the star,” said co-author François Bouchy.

HARPS delivered, allowing the astronomers to tease out the 20.4-hour signal in the data. This figure led them to infer that CoRoT-7b has a mass of about five Earth masses, placing it in rare company as one of the lightest exoplanets yet found.

“Since the planet’s orbit is aligned so that we see it crossing the face of its parent star – it is said to be transiting – we can actually measure, and not simply infer, the mass of the exoplanet, which is the smallest that has been precisely measured for an exoplanet,” says team member Claire Moutou. “Moreover, as we have both the radius and the mass, we can determine the density and get a better idea of the internal structure of this planet.”

The calculated density is close to Earth’s, suggesting that the planet’s composition is similarly rocky.

Could there be life there? Well, probably not as we know it.

“CoRoT-7b is so close [to its star] that the place may well look like Dante’s Inferno,” said Queloz. “Theoretical models suggest that the planet may have lava or boiling oceans on its surface. With such extreme conditions this planet is definitively not a place for life to develop,” says Queloz.

The sister planet, CoRoT-7c, circles its host star in 3 days and 17 hours and has a mass about eight times that of Earth, so it too is classified as a super-Earth. Unlike CoRoT-7b, this sister world does not pass in front of its star as seen from Earth, so astronomers cannot measure its radius and thus its density.

But as it stands now, CoRoT-7 is the first star known to have a planetary system made of two short period super-Earths.

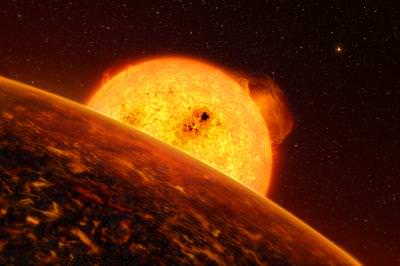
Lead image caption: The exoplanet Corot-7b is so close to its Sun-like host star that it must experience extreme conditions. Sister planet, CoRot-7c is seen in the distance. Credit: ESO

Source: EurekAlert

New Wallpaper for Star Trek, Cassini Fans

Why Does Saturn Have Rings

Star Trek fan? Like Cassini and Saturn? The very busy planetary scientist Carolyn Porco also has a visual graphics company, Diamond Sky Productions and they have created some new wallpapers featuring scenes from the latest Star Trek motion picture. The images are copyrighted, so we can’t post them here, but no doubt you’ll want to take a look at these spectacular images over at Diamond Sky’s website. Enjoy!

Spot Discovered on Haumea Rich With Organics and Minerals

Light curve of Haumea in two wavelenths.

A dark red area discovered on dwarf planet Haumea appears to be richer in minerals and organic compounds than the surrounding icy surface. Since Haumea is so small and far away, it shows up in telescopes as just a point of light, but the spot was discovered by measuring changes in brightness as it rotates. Small but persistent differences indicate that the dark spot is slightly redder in visible light and slightly bluer at infrared wavelengths.

The spot could be from a recent impact, so scientists aren’t sure if the materials come from Haumea or the impactor. The dwarf planet is thought to be a rocky body covered in ice.

“Our very first measurements of Haumea told us there was a spot on the surface” said Dr. Pedro Lacerda, from Queen?s University in Belfast. “The two brightness maxima and the two minima of the light curve are not exactly equal, as would be expected from a uniform surface. This indicates the presence of a dark spot on the otherwise bright surface. But Haumea’s light curve has told us more and it was only when we got the infrared data that were we able to begin to understand what the spot might be.”

Possible interpretations of the changes in the light curve are that the spot is richer in minerals and organic compounds, or that it contains a higher fraction of crystalline ice.
[/caption]
Haumea orbits the Sun beyond Neptune, in a region known as the Kuiper belt. It is the fourth largest known Kuiper belt object (KBO) after Eris, Pluto and Makemake. These large KBOs, together with main-belt asteroid Ceres, are known as dwarf planets. One of the most surprising characteristics of Haumea is its very fast rotation, with one day lasting only 3.9 Earth hours. No other large object in the solar system spins as fast as Haumea. The rapid spin deforms Haumea into an elongated ellipsoid, 2,000 km by 1,600 km by 1,000 km, whose shape balances gravitational and rotational accelerations. It is believed that Haumea was spun up by a massive impact more than a billion years ago.

Because of its rotation and elongated shape, Haumea brightens and dims periodically as it reflects more and less sunlight. The extent of this variation tells us how elongated Haumea is, and the time between each brightening and dimming is a measure of the rotation period. The precise Haumea shape and spin period imply that it has a density 2.5 times that of water. Since we know from spectroscopic observations that Haumea is covered in water ice, this high density implies Haumea must have a rocky interior, in contrast with its bright icy surface.

Artist concept of Haumea. Credit: NASA

New observations of this spot are planned for early 2010 using the ESO Very Large Telescope. “Now we will get detailed spectroscopy of the spot to hopefully identify its chemical composition and solve the puzzle of its origin” said Lacerda.

Source: Europlanet

Mini Comets Ejected from Comet Holmes Caused Outburst

(Left) Image of comet Holmes from the 3.6-meter Canada-France-Hawaii telescope on Mauna Kea showing the large expanding dust coma. On the left, a 'raw' image is shown, in which the brightness reflects the distribution of dust in the coma of the comet (the nucleus is in the bright, point-like region to the upper left of center). On the right is shown the same image after application of the Laplacian spatial filter, to emphasize fine structures. The white/black circular objects are background stars enhanced by the Laplacian filter.

[/caption]
Comet 17P/Holmes caused a sensation in October and November 2007 when overnight, it brightened enough to be visible with the naked eye and became the largest cometary outburst ever witnessed. Using a special filter on the Canada- France- Hawaii Telescope in Hawaii, astronomers were able to peer inside Comet Holmes to determine why the comet became so bright. Images and animations show multiple fragments were ejected and rapidly flew away from the nucleus of comet Holmes.

Astronomers Rachel Stevenson, Jan Kleyna and David Jewitt began observing comet Holmes in October 2007 soon after it was reported that the small (3.6 km wide) body had brightened by a million times in less than a day. They continued observing for several weeks after the outburst and watched as the dust cloud ejected by the comet grew to be larger than the Sun.

Comet Holmes by Hubble. Image credit: STSCI

The astronomers examined a sequence of images taken over nine nights in November 2007 using a Laplacian filter which enhances sharp discontinuities within images. It is particularly good at picking out faint small-scale features that would otherwise remain undetected against the bright background of the expanding comet. They found numerous small objects that moved radially away from the nucleus at speeds up to 125 meters per second (280 mph). These objects were too bright to simply be bare rocks, but instead were more like mini-comets creating their own dust clouds as the ice sublimated from their surfaces.

“Initially we thought this comet was unique simply because of the scale of the outburst,” said Stevenson. “But we soon realized that the aftermath of the outburst showed unusual features, such as these fast-moving fragments, that have not been detected around other comets.”

While cometary outbursts are common, their causes are unknown. One possibility is that internal pressure built up as the comet moved closer to the Sun and sub-surface ices evaporated. The pressure eventually became too great and part of the surface broke away, releasing a huge cloud of dust and gas, as well as larger fragments.

Surprisingly, the solid nucleus of comet Holmes survived the outburst and continued on its orbit, seemingly unperturbed. Holmes takes approximately 6 years to circle the Sun, and travels between the inner edge of the asteroid belt to beyond Jupiter. The comet is now moving away from the Sun but will return to its closest approach to the Sun in 2014, when astronomers will examine it for signs of further outbursts.

The team presented their findings at the European Planetary Science Congress in Potsdam, Germany.

Lead image caption: (Left) Image of comet Holmes from the 3.6-meter Canada-France-Hawaii telescope on Mauna Kea showing the large expanding dust coma. On the left, a ‘raw’ image is shown, in which the brightness reflects the distribution of dust in the coma of the comet (the nucleus is in the bright, point-like region to the upper left of center). On the right is shown the same image after application of the Laplacian spatial filter, to emphasize fine structures. The white/black circular objects are background stars enhanced by the Laplacian filter.

Source: Europlanet