Researchers Say Sun Cycle Alters Earth’s Climate

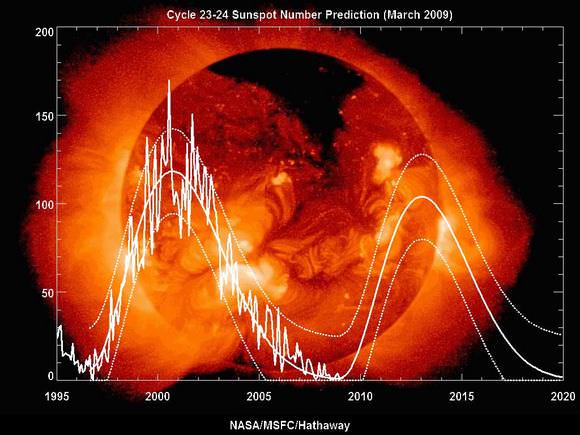
The sunspot cycle from 1995 to the present. The jagged curve traces actual sunspot counts. Smooth curves are fits to the data and one forecaster's predictions of future activity. Credit: David Hathaway, NASA/MSFC

[/caption]
If the energy from the sun varies by only 0.1 percent during the 11-year solar cycle, could such a small variation drive major changes in weather patterns on Earth? Yes, say researchers from the National Center for Atmospheric Research (NCAR) who used more than a century of weather observations and three powerful computer models in their study. They found subtle connections between solar cycle, the stratosphere, and the tropical Pacific Ocean that work in sync to generate periodic weather patterns that affect much of the globe. Scientists say this will help in predicting the intensity of certain climate phenomena, such as the Indian monsoon and tropical Pacific rainfall, years in advance.

“The Sun, the stratosphere, and the oceans are connected in ways that can influence events such as winter rainfall in North America,” says NCAR scientist Gerald Meehl, the lead author. “Understanding the role of the solar cycle can provide added insight as scientists work toward predicting regional weather patterns for the next couple of decades.”

The new study looked at the connection between the Sun’s impact on two seemingly unrelated regions. Chemicals in the stratosphere and sea surface temperatures in the Pacific Ocean respond during solar maximum in a way that amplifies the Sun’s influence on some aspects of air movement. This can intensify winds and rainfall, change sea surface temperatures and cloud cover over certain tropical and subtropical regions, and ultimately influence global weather.

The team first confirmed an earlier theory, that the slight increase in solar energy during the peak production of sunspots is absorbed by stratospheric ozone. The energy warms the air in the stratosphere over the tropics, where sunlight is most intense, while also stimulating the production of additional ozone there that absorbs even more solar energy. Since the stratosphere warms unevenly, with the most pronounced warming occurring at lower latitudes, stratospheric winds are altered and, through a chain of interconnected processes, end up strengthening tropical precipitation.

At the same time, the increased sunlight at solar maximum causes a slight warming of ocean surface waters across the subtropical Pacific, where Sun-blocking clouds are normally scarce. That small amount of extra heat leads to more evaporation, producing additional water vapor. In turn, the moisture is carried by trade winds to the normally rainy areas of the western tropical Pacific, fueling heavier rains and reinforcing the effects of the stratospheric mechanism.

The top-down influence of the stratosphere and the bottom-up influence of the ocean work together to intensify this loop and strengthen the trade winds. As more sunshine hits drier areas, these changes reinforce each other, leading to less clouds in the subtropics, allowing even more sunlight to reach the surface, and producing a positive feedback loop that further magnifies the climate response.

These stratospheric and ocean responses during solar maximum keep the equatorial eastern Pacific even cooler and drier than usual, producing conditions similar to a La Nina event. However, the cooling of about 1-2 degrees Fahrenheit is focused farther east than in a typical La Nina, is only about half as strong, and is associated with different wind patterns in the stratosphere.

Earth’s response to the solar cycle continues for a year or two following peak sunspot activity. The La Nina-like pattern triggered by the solar maximum tends to evolve into a pattern similar to El Nino as slow-moving currents replace the cool water over the eastern tropical Pacific with warmer water. The ocean response is only about half as strong as with El Nino and the lagged warmth is not as consistent as the La Nina-like pattern that occurs during peaks in the solar cycle.

Solar maximum could potentially enhance a true La Nina event or dampen a true El Nino event. The La Nina of 1988-89 occurred near the peak of solar maximum. That La Nina became unusually strong and was associated with significant changes in weather patterns, such as an unusually mild and dry winter in the southwestern United States.

The Indian monsoon, Pacific sea surface temperatures and precipitation, and other regional climate patterns are largely driven by rising and sinking air in Earth’s tropics and subtropics. Therefore the new study could help scientists use solar-cycle predictions to estimate how that circulation, and the regional climate patterns related to it, might vary over the next decade or two.

The team used three different computer models to look at all the variables and each came up with the same result, that even a small variablilty in the sun’s energy could have profound effects on Earth.

“With the help of increased computing power and improved models, as well as observational discoveries, we are uncovering more of how the mechanisms combine to connect solar variability to our weather and climate,” Meehl says.

The team’s research was published in the Journal Science.

The Universe DVD Giveaway

In case you haven’t heard, Season 4 of the History Channel’s “The Universe” has begun. To help celebrate, they’ve generously offered to give away two sweet prizes related to the show. One person will get “The Universe Collector’s Set“, which contains Season 1, Season 2, and the 2 specials. And another person will get to choose between Season 1 on Bluray, or Season 2 on DVD.

To enter the giveaway, just email [email protected] with the Subject Line: “Universe DVD Giveaway“. I’ll collect all the entries and pick two randomly as winners. Then I’ll delete all the emails.

The deadline to enter is Monday, August 31st, 2009 at 12:00 noon (Pacific Time).

And if you want to check out The Universe now, you can buy full episodes on iTunes, order DVDs from the History Channel, and even watch it on the television. The next episode, “It Fell From Space” airs on September 1, 2009

LookUP to Find Astronomical Objects

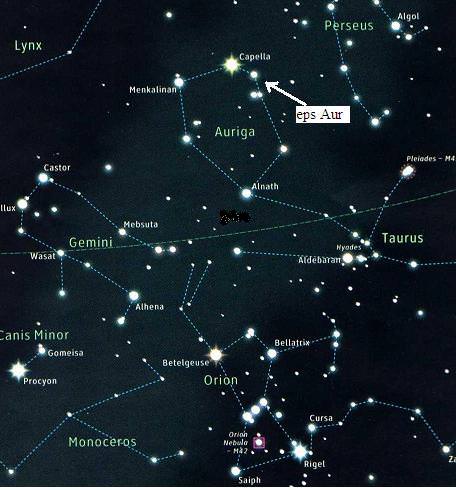
Sky map of Epsilon Aurigae

[/caption]
Have you heard about LookUP? Stuart Lowe from the Jodrell Bank Centre for Astrophysics created this web tool to provide quick access to information about the the position and other details of specific astronomical objects. Instead of having to go search through an astronomical database, all you have to do is type in the name of the object (this doesn’t apply for spacecraft) and LookUP contacts the relevant astronomical databases for you and provides info such as right ascension and declination. There’s also mobile version, an application for iPhones, and a widget for your desktop. The newest tool will thrill all the astronomy Twitterers out there. Rob Simpson from Orbiting Frog fame created a Twitter account for LookUP. All you do is send a tweet to it with the name of your object, and it will send you the info and a link with for further information. For example, I wanted to know where Asteroid Apophis was, and LookUp Tweeted back: Apophis is at RA 10:35:13.594 dec 07:37:40.210 More info http://bit.ly/1aVqzG (that is valid for the time I sent the Tweet.) Check it out; it’s all very quick and easy and wonderful for all you stargazers out there.

LookUP

How Close Was That Lightning to the Shuttle?

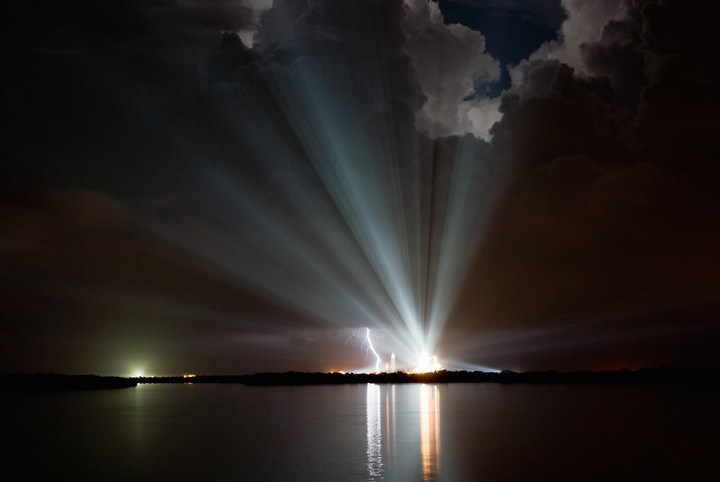
Lightning strikes close to the launchpad at Kennedy Space Center on August 25, 2009. Credit: NASA, Ben Cooper. Click the image for access to a larger version.

[/caption]
If you’re wondering why the first launch attempt for space shuttle Discovery was scrubbed early Tuesday morning, here’s your answer. Yikes! But what a gorgeous picture! And of course, the second launch attempt early Wednesday morning was called off when instrumentation for an 8-inch fill and drain valve on the shuttle’s external tank indicated the valve had failed to close. But yesterday, the valve functioned correctly five times during launch pad tests, NASA said. That means NASA will likely go ahead with a launch attempt at 04:22 GMT (12:22 a.m. ET) on Friday. But the anomaly remains unexplained, so it will be up to the mission management team to decide if the shuttle can fly as is, or if engineers need to know more about the issue. The decision won’t be made, however until the MMT meets Thursday afternoon, just hours before the scheduled liftoff time. As the saying goes, there’s a million parts on the shuttle and if only one is not working….

UPDATE: Launch now is targeted for no earlier than 11:59 p.m. Friday, Aug. 28, to allow engineers more time to develop plans for resolving the issue with the valve.

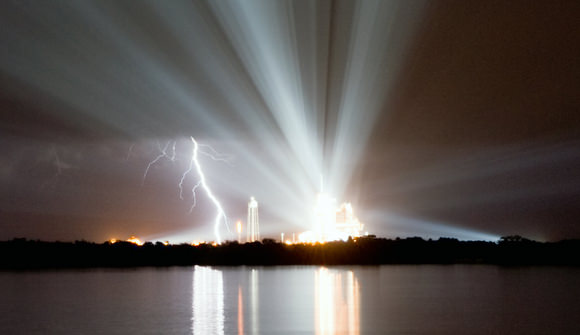
See below for a close-up of the lightning shot, to see how close it actually came to the shuttle.

Lightining strikes close to Discovery on the launchpad on Aug. 25, 2009. Credit: NASA/Ben Cooper.  Click image for access to larger version.
Lightining strikes close to Discovery on the launchpad on Aug. 25, 2009. Credit: NASA/Ben Cooper. Click image for access to larger version.

Discovery’s 13-day mission will deliver more than 7 tons of supplies, science racks and equipment, as well as additional environmental hardware to sustain six crew members on the International Space Station. The equipment includes a freezer to store research samples, a new sleeping compartment and the COLBERT treadmill. The mission is the 128th in the Space Shuttle Program, the 37th flight of Discovery and the 30th station assembly flight.

Hat Tip to absolutespacegrl on Twitter!

Mars Reconnissance Orbiter Goes Into Safe Mode Again

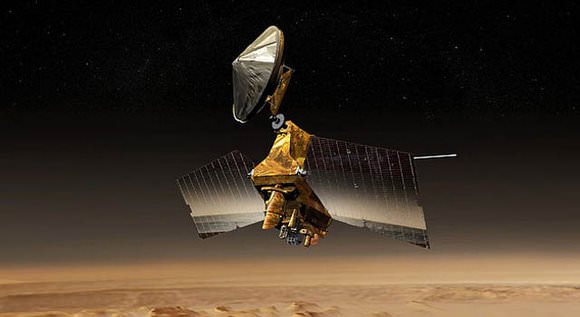
Artists concept of the Mars Reconnaisance Orbiter. Credit: NASA/JPL

[/caption]
NASA’s Mars Reconnaissance Orbiter put itself into a safe mode Wednesday morning, Aug. 26, for the fourth time this year. While in safe mode, the spacecraft can communicate normally with Earth, but aborts its scheduled activities, and awaits further instructions from ground controllers. “We hope to gain a better understanding of what is triggering these events and then have the spacecraft safely resume its study of Mars by next week,” said MRO Project Manager Jim Erickson.

Engineers have begun the process of diagnosing the problem prior to restoring the orbiter to normal science operations, a process expected to take several days. They will watch for engineering data from the spacecraft that might aid in identifying the cause of event and possibly of previous ones.

A possible cause for the frequent anomalies is cosmic ray hits. But the spacecraft has reacted differently with the various safe mode entries. The orbiter spontaneously rebooted its computer Wednesday, as it did in February and June, but did not switch to a redundant computer, as it did in early August.

To help in investigating a root cause of the three previous anomalies, engineers had programmed the spacecraft to frequently record engineering data onto non-volatile memory. That could give an improved record of spacecraft events leading up to the reboot.

MRO has been in Mars orbit since 2006, and has returned more data than all other current and past Mars missions combined.

Source: JPL

Charge of Electron

Charge of Electron
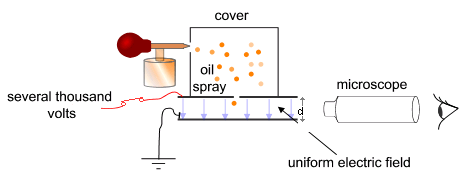
Simplified Scheme of Millikan’s Oil-drop Experiment

[/caption]

The charge of the electron is equivalent to the magnitude of the elementary charge (e) but bearing a negative sign. Since the value of the elementary charge is roughly 1.602 x 10⁻¹⁹ coulombs (C), then the charge of the electron is -1.602 x 10⁻¹⁹ C.

When expressed in atomic units, the elementary charge takes the value of unity; i.e., e = 1. Thus, the electron’s charge can be denoted by -e. Although the proton is much more massive than the electron, it only has a charge of e. Hence, neutral atoms always bear the same number of protons and electrons.

JJ Thomson is the undisputed discoverer of the electron. However, despite all those experiments he performed on it, he could only manage to obtain the electron’s charge to mass ratio. The distinction of being the first to measure the electron’s charge goes to Robert Millikan through his oil-drop experiment in 1909.

The Millikan Oil-Drop Experiment

Here’s the basic idea. If you know the density and dimensions (thus subsequently the volume) of a substance, it’s going to be easy to calculate its mass and the force that gravity exerts on it, a.k.a. weight. If you recall, weight is just m x g.

Now let’s assume these substances to be charged oil drops. If you subject these drops to gravity alone, they’ll fall freely. However, if they are allowed to fall in a uniform electric field, their trajectory will be altered depending on the direction and magnitude of the field.

If the forces due to the field are directed opposite to gravity, the downward velocity of the particles may decrease. At some point, when the upward force is equal to the downward force, the velocities may even go down to zero and the particles will stay in mid-air.

At this specific instance, if we know the magnitude of the electric field (in N/C, units defining the force per unit charge) and the weight of each particle, we can calculate the force of the electric field on a single particle and finally derive the charge.

Thus, a basic Millikan Oil-Drop Experiment setup will include an enclosure containing falling charged oil drops, a device to measure their radii, an adjustable uniform electric field, and a meter to determine the field’s magnitude.

By repeating the experiment on a large number of oil drops, Millikan and his colleague, Harvey Fletcher, obtained electron charge values within 1% of the currently accepted one.

We have some articles in Universe Today that are related to the charge of the electron. Here are two of them:

Physics World also has some more:

Tired eyes? Let your ears help you learn for a change. Here are some episodes from Astronomy Cast that just might suit your taste:

Sources:
Wikipedia
GSU Hyperphysics
University of Alaska-Fairbanks

Mars Kicking Spirit When She’s Down

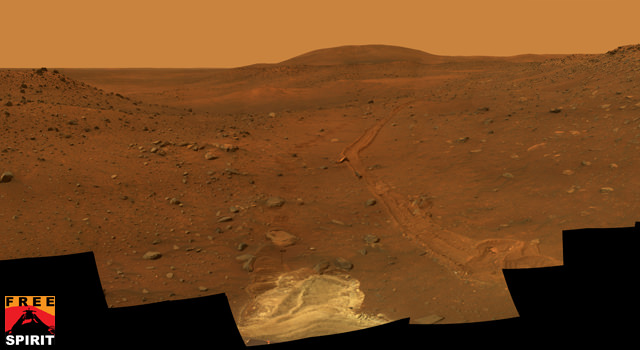
This full-circle view from the panoramic camera (Pancam) on NASA's Mars Exploration Rover Spirit shows the terrain surrounding the location called "Troy," where Spirit became embedded in soft soil during the spring of 2009. Credit: NASA/JPL

[/caption]
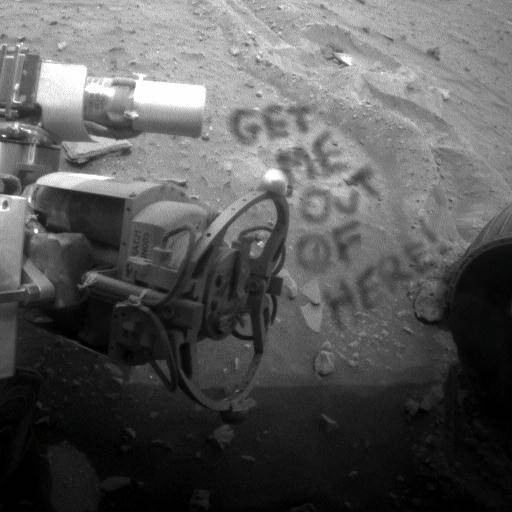
The Spirit rover has been stuck in loose soil on Mars for several months now, and just as the rover team is preparing to execute maneuvers to attempt to free Spirit, a dust storm hits. Is Mars an unforgiving planet or what? The amount of electricity generated by the solar panels on Spirit has been declining for the past several Martian days, or sols, because of the storm, and Spirit’s daily activities have been trimmed. Those watching over the rover are keeping an eye on weather reports from observations by NASA’s Mars Reconnaissance Orbiter. While the rover team at JPL are keeping their “spirits” up, a recent image from the rover indicates Spirit herself might be getting frustrated with her string of bad luck:

Get me out of here! Credit: NASA/JPL, image enhancement by Stuart Atkinson

Thanks to Stuart Atkinson from Cumbrian Sky for his image spoof!

Spirit’s solar panels generated 392 watt-hours during the mission’s Sol 2006 (Aug. 24, 2009), down from 744 watt-hours five sols earlier, but still generous compared with the 240 watt-hours per sol that was typical before a series of panel-cleaning events about four months ago.

“We expect that power will improve again as this storm passes, but we will continue to watch this vigilantly,” said JPL’s John Callas, project manager for Spirit and its twin, Opportunity. “Spirit remains power positive with healthy energy margins and charged batteries. The weather prediction from the Mars Color Imager team is that the storm is abating, but skies will remain dusty over Spirit for the next few sols.”

Recent images from the Mars Color Imager camera on Mars Reconnaissance Orbiter showed this regional storm becoming less extensive Monday even as it shifted southward so that its southern edge covered the Gusev Crater area where Spirit is working. Malin Space Science Systems in San Diego, which operates that camera, provides frequent weather updates to the rover team. Check out weekly weather reports here.

Meanwhile, in JPL’s In-Situ Instrument Laboratory, the rover team is continuing testing of strategies for getting Spirit out of a patch of soft soil where it is embedded on Mars. On Sol 2005 (Aug. 23, 2009) Spirit used its panoramic camera to examine the nature of how soil at the site has stuck to the rover’s middle wheels. The team has also used Spirit’s rock abrasion tool as a penetrometer to measure physical properties of the soil around Spirit by pressing into the soil with three different levels of force. The team is aiming to start sending drive commands to Spirit in September.

Source: JPL

Where In The Universe #68

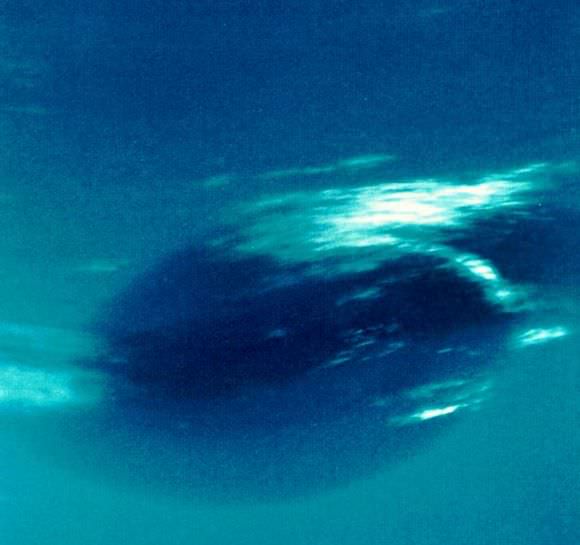
Here’s this week’s image for the WITU Challenge, to test your visual knowledge of the cosmos. You know what to do: take a look at this image and see if you can determine where in the universe this image is from; give yourself extra points if you can name the spacecraft responsible for the image. We’ll provide the image today, but won’t reveal the answer until tomorrow. This gives you a chance to mull over the image and provide your answer/guess in the comment section. Please, no links or extensive explanations of what you think this is — give everyone the chance to guess.

UPDATE: The answer has now been posted below.

Twenty years ago the Voyager 2 spacecraft flew by Neptune and took this image of the Great Dark Spot on that planet. This is the last face-on view of the GDS that Voyager took with its narrow-angle camera. The
image was shuttered 45 hours before closest approach at a distance of 2.8 million kilometers (1.7 million miles). The smallest structures that can be seen are of an order of 50 kilometers (31 miles). The image shows feathery white clouds that overlie the boundary of the dark and light blue regions.

The pinwheel (spiral) structure of both the dark boundary and the white cirrus suggest a storm system rotating counterclockwise. Periodic small-scale patterns in the white cloud, possibly waves, are short-lived and do not persist from one Neptunian rotation to the next. This color composite was made from the clear and green filters of the narrow-angle camera.

For more Voyager pictures of Neptune and its satellites, check out the NSSDC website.

New Images Reveal Details of the Trifid Nebula

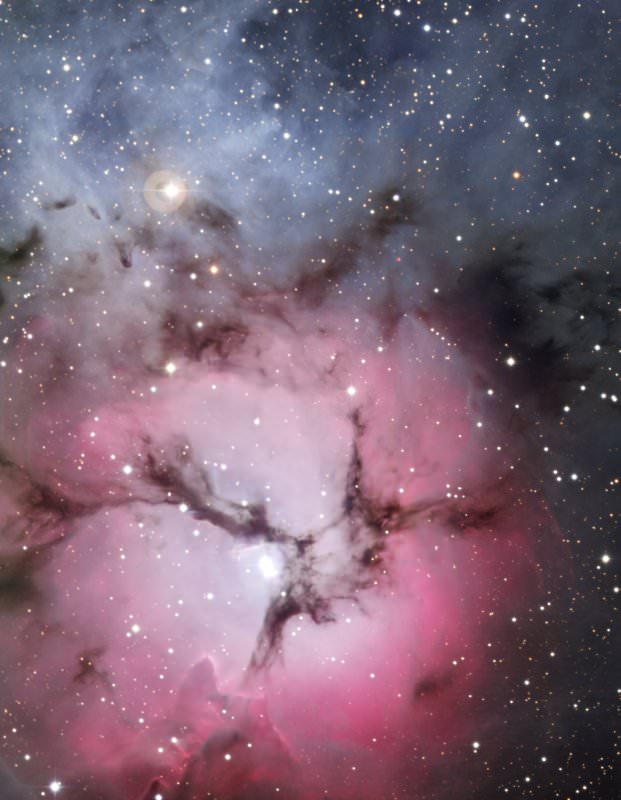
The Trifid Nebula. Credit: ESO

[/caption]
You’ll have no trouble at all enjoying these stunning new images of the Trifid Nebula. This massive star factory is so named for the dark dust bands that trisect its glowing heart, and is a rare combination of three nebula types: reflection, emission and dark nebulae. With these new images from ESO’s La Silla Observatory in northern Chile, astronomers are learning more about the early stages of stellar life, from gestation to first light.

Smouldering several thousand light-years away in the constellation of Sagittarius (the Archer), the Trifid Nebula is a favorite target for amateur and professional astronomers alike. These new images shows the heat and “winds” of newly ignited, volatile stars that stir the Trifid’s gas and dust-filled cauldron; in time, the dark tendrils of matter strewn throughout the area will themselves collapse and form new stars.

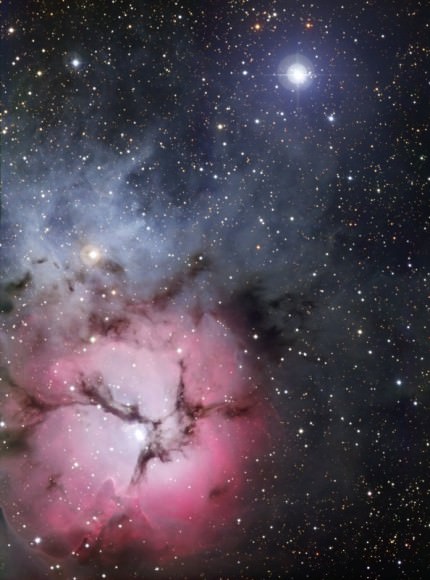
Full view of the Trifid Nebula.  Credit: ESO
Full view of the Trifid Nebula. Credit: ESO

Made with the Wide-Field Imager camera attached to the MPG/ESO 2.2-metre telescope at ESO’s La Silla Observatory in northern Chile, this new image prominently displays the different regions of the Trifid Nebula as seen in visible light. In the bluish patch to the upper left, called a reflection nebula, gas scatters the light from nearby, Trifid-born stars. The largest of these stars shines most brightly in the hot, blue portion of the visible spectrum. This, along with the fact that dust grains and molecules scatter blue light more efficiently than red light — a property that explains why we have blue skies and red sunsets — imbues this portion of the Trifid Nebula with an azure hue.

In the bottom part of the image, in the round, pink-reddish area typical of an emission nebula, the gas at the Trifid’s core is heated by hundreds of scorching young stars until it emits the red signature light of hydrogen, the major component of the gas, just as hot neon gas glows red-orange in illuminated signs all over the world.

See here for a zoomable image of the Trifid Nebula.

The gases and dust that crisscross the Trifid Nebula make up the third kind of nebula in this cosmic cloud, known as dark nebulae, courtesy of their light-obscuring effects. (The iconic Horsehead Nebula may be the most famous of these). Within these dark lanes, the remnants of previous star birth episodes continue to coalesce under gravity’s inexorable attraction. The rising density, pressure and temperature inside these gaseous blobs will eventually trigger nuclear fusion, and yet more stars will form.

In the lower part of this emission nebula, a finger of gas pokes out from the cloud, pointing directly at the central star powering the Trifid. This is an example of an evaporating gaseous globule, or “EGG”, also seen in the Eagle Nebula, another star-forming region. At the tip of the finger, which was photographed by Hubble, a knot of dense gas has resisted the onslaught of radiation from the massive star.

Source: ESO