[/caption]
When was the Sun discovered? Obviously the Sun is such an important feature in our lives, and the absolute necessity to all life on Earth. It’s kind of impossible to say when the Sun was discovered, since the first life forms on Earth probably relied on its energy. Humans have been well aware of the Sun for tens of thousands of years, and before modern astronomy had no idea what it was.
So perhaps a better question might be, when did we realize that the Sun is a star?
The Sun is incredibly important to our lives. When the Sun is in the sky, we have day. And when the Sun is below the horizon, we have night. Our biological clocks are programmed on it, and we life our lives by this routine. Ancient peoples thought the Sun was some kind of deity, and many civilizations – like the Inca in South America – worshipped it.
The Greek philosopher Anaxagoras first proposed that the Sun was a burning ball of fire, larger than a Greek Island, and not the chariot of a god. And other astronomers were able to calculate the distance to the Sun with surprising accuracy. In the modern scientific era Lord Kelvin proposed that the Sun was ball of hot liquid that was slowly cooling. But it wasn’t until the early 20th century that scientists were finally able to figure out what the source of the Sun’s energy is.
Ernest Rutherford proposed that the Sun’s heat came from radioactive decay, and it was Albert Einstein who used his famous mass-energy equation (E=mc2) to suggest that the Sun was converting mass into energy. And finally, the theoretical concept of fusion was created in the 30s by Subrahmanyan Chandrasekhar and Hans Bethe. They were able to calculate the actual fusion reactions in the Sun that convert hydrogen into helium.
I would say then, that the Sun was really discovered in the 1930s, when astrophysicists finally understood the mechanisms working inside the Sun that gave off so much energy.
We have written many articles about the Sun for Universe Today. Here’s an article about how big the Sun is, and here’s an article about the Sun’s future.
If you’d like more information about the Sun, check out NASA’s website for the SOHO spacecraft mission.
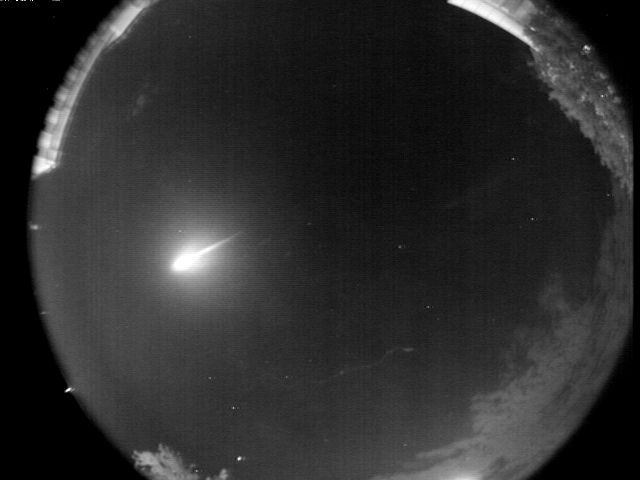
Composite all-sky camera image of the end of the fireball as seen from Hamilton (Camera #3, McMaster). Available below are movies of the event as seen by several of the SOMN cameras, as well as animations of the object's arrival at Earth. Credit: University of Western Ontario
A brilliant fireball seen over Ontario, Canada on September 25, 2009 was captured by seven all-sky cameras of the University of Western Ontario’s Southern Ontario Meteor Network (SOMN.) The fireball was seen widely by observers throughout southern Ontario and adjacent areas. The fireball was first detected by Western’s camera systems at an altitude of 100km, and moving southeastwards at 20.8 km/s. From the data collected, the researchers believe the meteoroid was initially about a meter wide, or about the size of a child’s tricycle. At its brightest, the fireball was approximately 100 times as bright as the full moon.
[/caption]
Researchers at Western are interested in hearing from anyone within 10 km of Grimsby, Ontario who may have witnessed or recorded this evening event, seen or heard unusual events at the time, or who may have found possible fragments of the freshly fallen meteorite.
The event occurred at 9:03 pm local time on Sept. 25, or 01:03 UT Sept. 26.
Analysis of the all-sky camera records as well as data from Western’s meteor radar and infrasound equipment indicates that this bright fireball was large enough to have dropped meteorites in a region south of Grimsby on the Niagara Peninsula, providing masses that may total as much as several kilograms.
To see more videos or images, or if you have questions, observations or possible meteorites check out Western’s website.
[/caption]
NASA scientists have recalculated the path of the large asteroid Apophis, significantly downgrading the odds of it hitting Earth. Using new information, the refined path indicates a 1 in 250,000 chance of impact in 2036, reduced from the 1 in 45,000 odds calculated earlier. The asteroid is expected to make a record-setting — but harmless — close approach to Earth on Friday, April 13, 2029, when it comes no closer than 18,300 miles above Earth’s surface.
The new information provided a more accurate glimpse of 2036 Apophis’ orbit well into the latter part of this century. Among the findings is another close encounter by the asteroid with Earth in 2068 with chance of impact currently at approximately 1 in 333,000. As with earlier orbital estimates where Earth impacts in 2029 and 2036 could not initially be ruled out due to the need for additional data, it is expected that the 2068 encounter will diminish in probability as more information about 2029 Apophis is acquired.
Initially, Apophis was thought to have a 2.7 percent chance of impacting Earth in 2029. Additional observations of the asteriod ruled out any possibility of an impact in 2029.
The Apophis asteroid is approximately the size of two-and-a-half football fields.
“The refined orbital determination further reinforces that Apophis is an asteroid we can look to as an opportunity for exciting science and not something that should be feared,” said Don Yeomans, manager of the Near-Earth Object Program Office at JPL. “The public can follow along as we continue to study Apophis and other near-Earth objects by visiting us on our AsteroidWatch Web site and by following us on the @AsteroidWatch Twitter feed.”
The new data were documented by near-Earth object scientists Steve Chesley and Paul Chodas at NASA’s Jet Propulsion Laboratory. A majority of the data that enabled the updated orbit of Apophis came from observations made by Dave Tholen and collaborators at the University of Hawaii’s Institute for Astronomy in Manoa. Tholen pored over hundreds of previously unreleased images of the night sky made with the University of Hawaii’s 88-inch telescope, located near the summit of Mauna Kea.
Tholen made improved measurements of the asteroid’s position in the images, enabling him to provide Chesley and Chodas with new data sets more precise than previous measures for Apophis. Measurements from the Steward Observatory’s 90-inch Bok telescope on Kitt Peak in Arizona and the Arecibo Observatory on the island of Puerto Rico also were used in Chesley’s calculations.
“Apophis has been one of those celestial bodies that has captured the public’s interest since it was discovered in 2004,” said Chesley. “Updated computational techniques and newly available data indicate the probability of an Earth encounter on April 13, 2036, for Apophis has dropped from one-in-45,000 to about four-in-a million.”
The science of predicting asteroid orbits is based on a physical model of the solar system which includes the gravitational influence of the sun, moon, other planets and the three largest asteroids.
NASA detects and tracks asteroids and comets passing close to Earth using both ground and space-based telescopes. The Near Earth-Object Observations Program, commonly called “Spaceguard,” discovers these objects, characterizes a subset of them and plots their orbits to determine if any could be potentially hazardous to our planet.
[/caption]
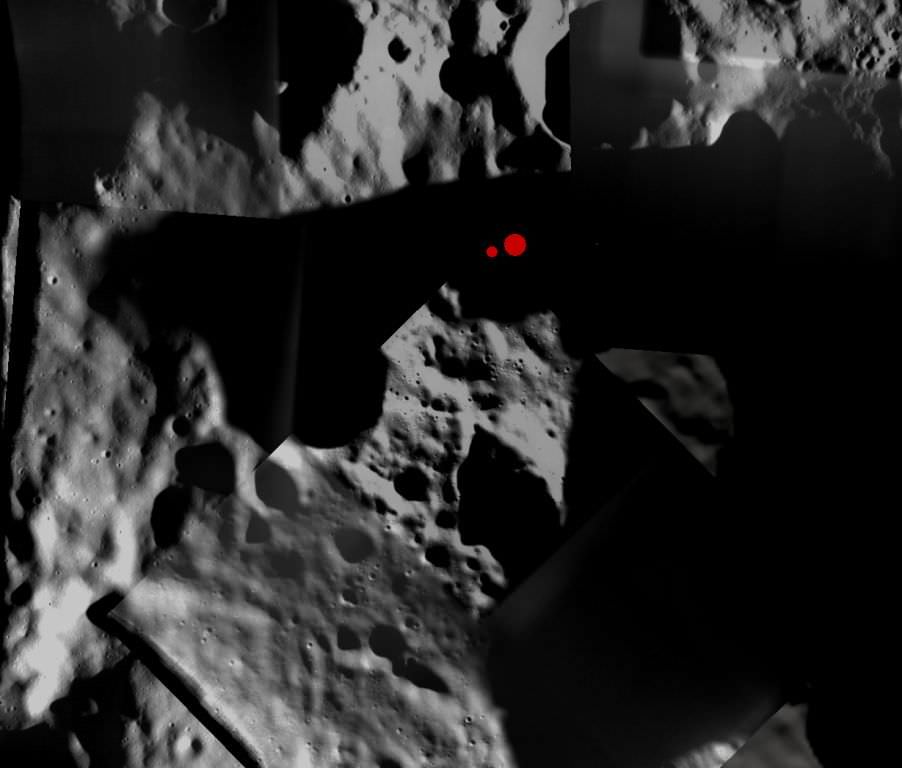
Since the LCROSS team reloaded and switched which lunar crater they are targeting for impact with the spacecraft and its upper stage of the Centaur rocket on October 9, the SMART-1 team has reloaded as well, and has released an updated image of the new crater. LCROSS (Lunar Crater Observation and Sensing Satellite) will search for water ice on the Moon by making two impacts into Cabeus crater at the lunar South Pole. The impacts are scheduled for 11:31:19 UTC and 11:35:45 UTC.
Previously, the SMART-1 team had released an image of Cabeus A, the original target crater.
Bjoern Grieger, the liaison scientist for SMART-1’s AMIE camera, and Bernard Foing, ESA SMART-1 Project Scientist, searched through SMART-1’s database for images of Cabeus, taken four years ago. The
SMART-1 images are at high resolution as the spacecraft was near its closest distance of 500 km from the South Pole.
The Cabeus crater interior is permanently shadowed, so ice lying inside the crater could be protected from the Sun’s harsh rays. LCROSS will send the upper stage Centaur rocket crashing into Cabeus and a
shepherd spacecraft will fly into the plume of dust generated and measure its properties before making a second impact with the lunar surface. Astronomers will observe both impacts using ground and space-based telescopes. The SMART-1 spacecraft also concluded its mission with a controlled bouncing impact on September 3, 2006. The event was observed with ground-based telescopes (a “dry run” for LCROSS), and the flash from the impact was detected at infrared wavelengths.
“The Cabeus topographic features as observed by SMART-1 vary greatly during the lunar rotation and the yearly seasons due to the polar grazing illumination conditions,” said Foing. “The floor of Cabeus
near LCROSS targets shows a number of small craters and seems old enough to have accumulated water ice delivered from comets and water-rich asteroids, and might have kept it frozen in its shadowed
area.”
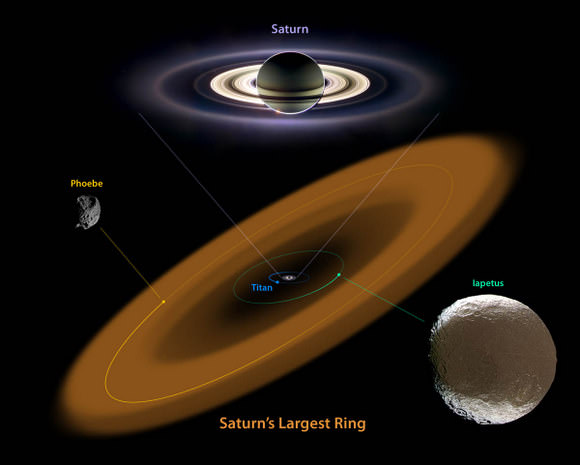
Artist concept of the new Saturnian Ring. Image courtesy Anne Verbiscer
[/caption]
The Spitzer Space Telescope has spied an enormous ring around Saturn, the largest and farthest distant band around this ringed world. Just how big is this ring? “If you had infrared eyes like Spitzer,” said Anne Verbiscer, research astronomer at the University of Virginia, Charlottesville, “from Earth, it would look like one full moon on either side of Saturn.” That’s incredibly huge! The bulk of its material starts about six million kilometers (3.7 million miles) away from the planet and extends outward roughly another 12 million kilometers (7.4 million miles). A billion Earths could fit in the volume of space this ring occupies.
So, why hasn’t this gigantic structure been detected previously?
“It is very, very faint; extremely tenuous,” Verbiscer told Universe Today. “If you were standing inside the ring you wouldn’t even know it. In a cubic kilometer of space there are only 10-20 particles. The particles are about the same size as fog particles, but they are very spread out. We’re just looking at the thermal emissions these little particles are giving off; we’re not looking at reflected sunlight at all in the observations we did with Spitzer. That’s what makes Spitzer the perfect instrument to use to try and find such a dust structure. This ring is completely analogous to debris disks around other stars that Spitzer has observed.”
The research team didn’t just stumble upon this ring; they were searching for it. The team includes Verbiscer, Douglas Hamilton of the University of Maryland, College Park, and Michael Skrutskie, of the University of Virginia, Charlottesville. They used the longer-wavelength infrared camera on Spitzer, called the multiband imaging photometer, and did their observations in February 2009 before Spitzer ran out of coolant in May and began its “warm” mission. The dark and light side of Iapetus. Credit: NASA/JPL/Space Science Institute
“For more than 300 years, people have been trying to explain the appearance of Saturn’s moon Iapetus, (which was discovered by Giovanni Cassini in 1671) and why one side of the moon is light and the other very dark,” said Verbiscer. “For the past 35 years, another moon, Phoebe has come up as a possible explanation, , as there is a connection between those two moons. Phoebe itself is very, very dark, and it matches the albedo or brightness of the dark material of Iapetus’ leading hemisphere. Phoebe has a retrograde orbit and Iapetus is in a pro-grade orbit. So if particles are launched off of Phoebe and spiral inward toward Saturn they would be smacking Iapetus right on that leading hemisphere.”
Verbiscer said that dynamically, this explanation for Iapetus’ dark side has been talked about and tried to be modeled. But no one had thought of using Spitzer to look for any dust in that area. “So, that was our idea,” she said. “The title of our proposal was ‘A New Saturnian Ring.’ We were definitely looking for a dust structure associated with Phoebe and in the same orbit, and that is precisely what we see.”
Verbiscer said it would be very difficult even for the Cassini spacecraft, and especially the imaging cameras to see this ring, since it shows up only in infrared. Plus Cassini is inside of this ring, and would have to look out past Saturn’s other rings. “This ring is so big but yet so faint, it would be difficult to know when you were looking at it and when you weren’t.”
The vertical height and orbital inclination of this ring matches perfectly with Phoebe’s orbit on the sky. “If you were to plot where Phoebe appears over time as it goes around Saturn, the ring matches exactly, Verbiscer said. “Think of a quarter spinning on a table; the ring has the same vertical tip to it, and Phoebe’s orbit does the same type of thing.”
As to whether the dust particles from Phoebe itself or if Phoebe “shepherding” some particles into that configuration, the scientists don’t have definite proof, but most likely the dust particles are from Phoebe. “We don’t have firm confirmation of that, but it is strongly suggestive that it comes from Phoebe,” Verbiscer said. “The materials all together amounts to what you would get from excavating a crater about a kilometer in diameter on Phoebe.” Cassini image of Phoebe. Credit: NASA/JPL
Phoebe is 200 km across and heavily cratered, so a 1 km crater is not an overly huge crater. “So, we can’t look at a certain crater on Phoebe and say that one created the ring,” Verbiscer explained. “It’s likely it’s from several different smaller impacts, and ring keeps getting supplied from subsequent impacts and micrometeorites hitting Phoebe, launching material into this ring, putting dust and material from Phoebe’s surface into a Phoebe-like orbit.”
But there still is a bit of a mystery about the color of Iapetus’ leading hemisphere.
The two moons have frequently been compared in composition, and in near infrared, they share absorption features. In the ultraviolet, however, the spectra don’t match as well. “In terms of color, on Iapetus, the dark color looks a little more red compared to Phoebe, so there is a little color mismatch,” Verbiscer said. “It could be the particles launched from Phoebe mix with whatever is on Iapetus, which might account for the color difference. That might be something interesting to explore, to do some spectral mixing models to come up with some primordial Iapetus material and mix with Phoebe’s material see if they get reddened somehow.”
The ring itself is too faint to take a spectra to try and determine what materials make up the ring, but the assumptions are the materials come from the top surface of Pheobe’s cratered surface, which also might include some ice. Cassini close-ups of the moon from 2004 show bright craters, hinting that ice is close to the surface.
Spitzer was able to sense the glow of the cool dust, which is only about 80 Kelvin (minus 316 degrees Fahrenheit). Cool objects shine with infrared, or thermal radiation; for example, even a cup of ice cream is blazing with infrared light. “By focusing on the glow of the ring’s cool dust, Spitzer made it easy to find,” said Verbiscer.
Lead image caption: Artist concept of the new Saturnian Ring. Credit: NASA/JPL-Caltech/R. Hurt (SSC) The inset credit (Saturn, Phoebe, and Iapetus) is NASA/JPL/SSI. Image courtesy Anne Verbiscer
Stereographic projection of Synthetic Aperture Radar (SAR) imagery of Titan’s south polar region obtained between Sep. 2005 and July 2009. The Cassini radar has observed 60% of this area and 9% has repeat coverage. Areas where changes have been detected are outlined in red. Credit: Alex Hayes and Jonathan Lunine
[/caption]
New images of Titan’s surface from the Cassini spacecraft show changes which are evidence of seasonal change. Objects identified earlier as liquid hydrocarbon lakes are shrinking and disappearing over the course of one to several Earth years. Scientists say seasonal temperature variations causing evaporation is the most likely cause for the changes observed. Cassini’s Synthetic Aperture Radar (SAR) repeatedly peered through Titan’s thick atmosphere, and data show that the lakes exhibit more than an order of magnitude increase in radar return and have disappearing borders between observations, suggesting surface change. These changes cannot be explained without invoking temporal variability, scientists reported at the American Astronomical Society’s Division for Planetary Sciences meeting now under way in Fajardo, Puerto Rico.
Alex Hayes, of the California Institute of Technology, and Dr. Jonathan Lunine, of the University of Rome Tor Vergata shared images of several regions on Titan’s south pole. Ontario Lacus is the largest and best characterized lake on Titan. Between July 2004 and July 2009, the shorelines of Ontario Lacus have receded, consistent with liquid evaporation and/or infiltration. In June and July 2009, the Cassini radar acquired its first high-resolution SAR images of the lake. Together with closest approach altimetry acquired in December 2008, these observations provide a unique opportunity to study Ontario. Areas where the Cassini radar has observed transient surface liquid in Titan’s south polar region. The top two images are located near (60S, 210W) and were obtained in December 2007 and May 2009. Empty lake features are outlined in red and filled lakes, observed in the 2007 image, are outlined in cyan. The lake features disappear between observations. The bottom row consists of images near (69S, 90W) obtained in Oct. 2007 and Dec. 2008. Empty lake features observed in Dec. 2008 are outlined in red. The empty lake features in the bottom-left section of the image are dark in Oct. 2007, consistent with liquid-filled lakes. In the Dec. 2008 image the brightness of these features are indistinguishable from the empty lakes in the upper-right section of the image (which are bright in both observations), suggesting surface change.
Evaporation is the most likely scenario for observed changes on Titan’s surface. Alternative explanations include freezing, cryovolcanism, and subsurface infiltration. Freezing is unlikely due to thermodynamic reasons during the summer season in Titan’s south pole, and there are no clearly observable cryovolcanic features in the study areas. However, liquids evaporating and becoming part of a static hydrologic system is inconsistent with the observations. But, the scientists said, infiltration into a dynamic hydrologic system with a regionally varying methane/ethane table is possible.
“If evaporation is responsible, model results suggest rates are about 1m/yr, similar to current GCM estimates of methane evaporation rates for the latitudes and season in question,” Hayes and Lunine wrote in their press release. “An analysis of the receding shorelines observed in Ontario Lacus also yield evaporation rates of about 1 m/yr and support the results of the two- layer model for the smaller lakes. These observations constrain volatile fluxes and hence, the evolution of Titan’s hydrologic system.”
U.S. satellite measurements show Arctic sea ice extent in 2009 – the area of the Arctic Ocean covered by floating ice – was the third lowest since satellite measurements were first made in 1979. While the ice area at minimum was an increase from the past two years, it is still well below the average for the past 30 years. In the video above, Tom Wagner, NASA’s cryosphere program manager, describes the shrinking of Arctic sea ice and the significance of the problem for the rest of the planet. Continue reading “Arctic Sea Ice Extent is Third Lowest on Record”
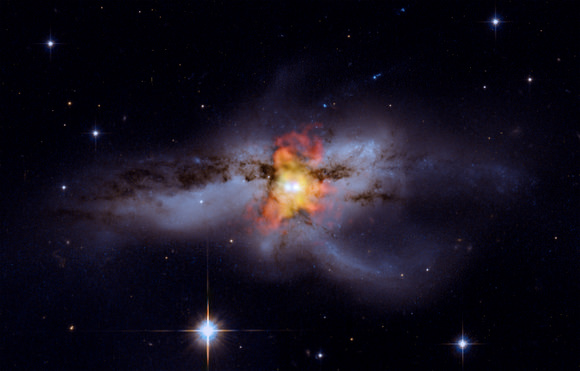
NGC 6240. Image credit: X-ray: NASA/CXC/MIT/ C.Canizares, M.Nowak; Optical: NASA/STScI
[/caption]
If black holes could communicate, there would likely be a lotta in your face trash talkin’ going on between these two merging black holes. This image of NGC 6240 contains new X-ray data from Chandra (shown in red, orange, and yellow) that has been combined with an optical image from the Hubble Space Telescope originally released in 2008. The two black holes are a mere 3,000 light years apart and are seen as the bright point-like sources in the middle of the image.
Scientists think these black holes are in such close proximity because they are in the midst of spiraling toward each other – a process that began about 30 million years ago. It is estimated that the two black holes will eventually drift together and merge into a larger black hole some tens or hundreds of millions of years from now.
Finding and studying merging black holes has become a very active field of research in astrophysics. Since 2002, there has been intense interest in follow-up observations of NGC 6240 by Chandra and other telescopes, as well as a search for similar systems. Understanding what happens when these exotic objects interact with one another remains an intriguing question for scientists.
The formation of multiple systems of supermassive black holes should be common in the Universe, since many galaxies undergo collisions and mergers with other galaxies, most of which contain supermassive black holes. It is thought that pairs of massive black holes can explain some of the unusual behavior seen by rapidly growing supermassive black holes, such as the distortion and bending seen in the powerful jets they produce. Also, pairs of massive black holes in the process of merging are expected to be the most powerful sources of gravitational waves in the Universe.
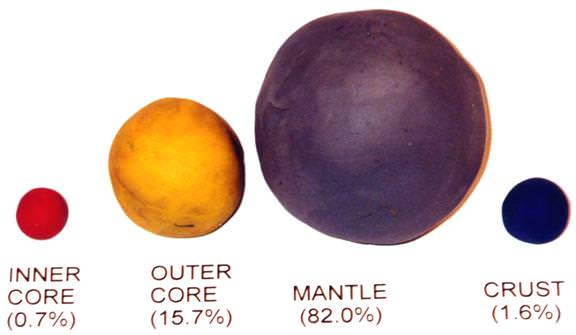
My son recently came back from a science day camp with one of the coolest things. It was a model of the Earth that he had created out of modeling clay. It showed the internal structure of the Earth, and because he built it, he was able to remember all of the layers of the Earth. Very cool. So here’s a good way to learn the Earth layers for kids.
To make your own, you need some modeling clay of different colors. You start by making a ball about 1.2 cm across. This represents the Earth’s inner core. Then you make a second ball about 3 cm across. This ball represents the Earth’s outer core. Then you make a third ball about 6 cm across. This ball represents the Earth’s mantle. And finally, you make some flattened pieces of clay that will be the Earth’s crust. To make it extra realistic, make some pieces blue and others green.
Take inner core and surround it with the outer core, and then surround that by the mantle. Cover the entire mantle with a thin layer of blue, and then put on some green continents on top of the blue.
If you’ve been really careful, you should be able to take a sharp knife and slice your Earth ball in half. You should be able to see the Earth’s layers inside, just like you’d see the real Earth’s layers. And you can see that the mantle is thicker underneath the Earth’s continents than it is under the oceans.
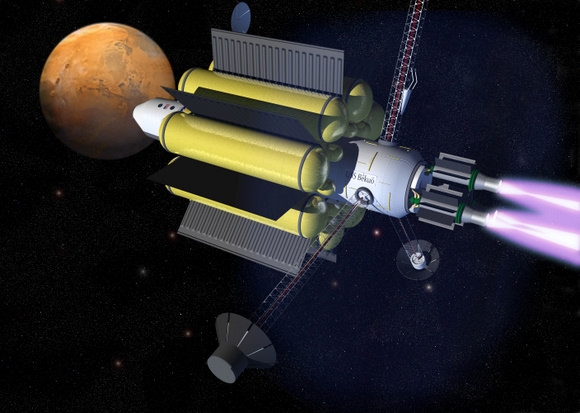
Artist rendering of the VASIMR powered spacecraft heading to Mars. Credit: Ad Astra
[/caption]
Using traditional chemical rockets, a trip to Mars – at quickest — lasts 6 months. But a new rocket tested successfully last week could potentially cut down travel time to the Red Planet to just 39 days. The Ad Astra Rocket Company tested a plasma rocket called the VASIMR VX-200 engine, which ran at 201 kilowatts in a vacuum chamber, passing the 200-kilowatt mark for the first time. “It’s the most powerful plasma rocket in the world right now,” says Franklin Chang-Diaz, former NASA astronaut and CEO of Ad Astra. The company has also signed an agreement with NASA to test a 200-kilowatt VASIMR engine on the International Space Station in 2013.
The tests on the ISS would provide periodic boosts to the space station, which gradually drops in altitude due to atmospheric drag. ISS boosts are currently provided by spacecraft with conventional thrusters, which consume about 7.5 tons of propellant per year. By cutting this amount down to 0.3 tons, Chang-Diaz estimates that VASIMR could save NASA millions of dollars per year.
The test last week was the first time that a small-scale prototype of the company’s VASIMR (Variable Specific Impulse Magnetoplasma Rocket) rocket engine has been demonstrated at full power.
Plasma, or ion engines uses radio waves to heat gases such as hydrogen, argon, and neon, creating hot plasma. Magnetic fields force the charged plasma out the back of the engine, producing thrust in the opposite direction.
They provide much less thrust at a given moment than do chemical rockets, which means they can’t break free of the Earth’s gravity on their own. Plus, ion engines only work in a vacuum. But once in space, they can give a continuous push for years, like wind pushing a sailboat, accelerating gradually until the vehicle is moving faster than chemical rockets. They only produce a pound of thrust, but in space that’s enough to move 2 tons of cargo.
Due to the high velocity that is possible, less fuel is required than in conventional engines.
Currently, the Dawn spacecraft, on its way to the asteroids Ceres and Vesta, uses ion propulsion, which will enable it to orbit Vesta, then leave and head to Ceres. This isn’t possible with conventional rockets. Additionally, in space ion engines have a velocity ten times that of chemical rockets. Specfic impulse and thrust graph. Credit: NASA
Rocket thrust is measured in Newtons (1 Newton is about 1/4 pound). Specific impulse is a way to describe the efficiency of rocket engines, and is measured in time (seconds). It represents the impulse (change in momentum) per unit of propellant. The higher the specific impulse, the less propellant is needed to gain a given amount of momentum.
Dawn’s engines have a specific impulse of 3100 seconds and a thrust of 90 mNewtons. A chemical rocket on a spacecraft might have a thrust of up to 500 Newtons, and a specific impulse of less than 1000 seconds.
The VASIMR has 4 Newtons of thrust (0.9 pounds) with a specific impulse of about 6,000 seconds.
The VASIMR has two additional important features that distinguish it from other plasma propulsion systems. It has the ability to vary the exhaust parameters (thrust and specific impulse) in order to optimally match mission requirements. This results in the lowest trip time with the highest payload for a given fuel load.
In addition, VASIMR has no physical electrodes in contact with the plasma, prolonging the engine’s lifetime and enabling a higher power density than in other designs.
To make a trip to Mars in 39 days, a 10- to 20-megawatt VASIMR engine ion engine would need to be coupled with nuclear power to dramatically shorten human transit times between planets. The shorter the trip, the less time astronauts would be exposed to space radiation, and a microgravity environment, both of which are significant hurdles for Mars missions. VASIMR. Credit: Ad Astra
The engine would work by firing continuously during the first half of the flight to accelerate, then turning to deaccelerate the spacecraft for the second half. In addition, VASIMR could permit an abort to Earth if problems developed during the early phases of the mission, a capability not available to conventional engines.
VASIMR could also be adapted to handle the high payloads of robotic missions, and propel cargo missions with a very large payload mass fraction. Trip times and payload mass are major limitations of conventional and nuclear thermal rockets because of their inherently low specific impulse.
Chang-Diaz has been working on the development of the VASIMR concept since 1979, before founding Ad Astra in 2005 to further develop the project.


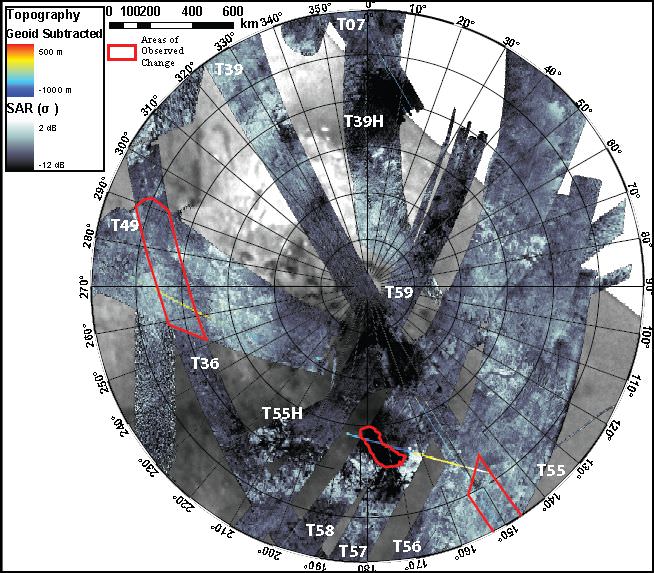
 and were obtained in December 2007 and May 2009. Empty lake features are outlined in red and filled lakes, observed in the 2007 image, are outlined in cyan. The lake features disappear between observations. The bottom row consists of images near (69S, 90W) obtained in Oct. 2007 and Dec. 2008. Empty lake features observed in Dec. 2008 are outlined in red. The empty lake features in the bottom-left section of the image are dark in Oct. 2007, consistent with liquid-filled lakes. In the Dec. 2008 image the brightness of these features are indistinguishable from the empty lakes in the upper-right section of the image (which are bright in both observations), suggesting surface change.")