These radar images of asteroid 2013 ET were obtained when the asteroid was about 693,000 miles from Earth. The images span 1.3 hours or about 1/3 or the asteroid's rotation rate. Click to enlarge. Credit: NASA/JPL-Caltech/GSSR
Another space rock sat pretty for NASA’s big dish photographer. The 70-meter (230-feet) Goldstone antenna zinged radio waves at 2013 ET on March 10 when the asteroid flew by Earth at 2.9 lunar distances or about 693,000 miles (1.1 million km).
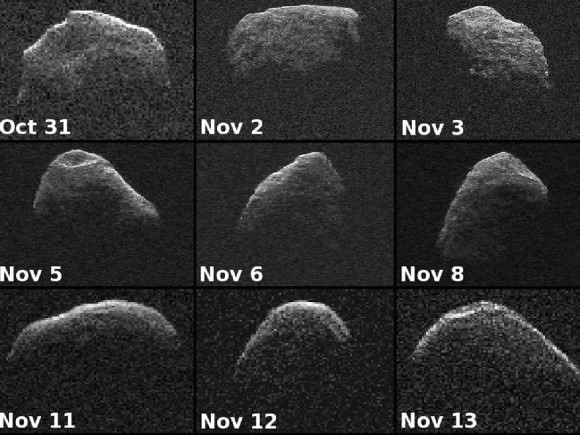
By studying the returned echoes, astronomers pieced together 18 images of a rugged, irregular-shaped object about 130 feet (40 m) across. Radar measurements of an asteroid’s distance and speed nail down its orbit with great accuracy, enabling scientists to predict whether or not it might become a danger to the planet at a future date.
The Goldstone dish dish, based in the Mojave Desert near Barstow, Cal. is used for radar mapping of planets, comets, asteroids and the moon. Credit: NASA
It’s also the only way outside of a sending a spacecraft to the object of seeing a small asteroid’s shape and surface features. Most optical telescopes cannot resolve asteroids as anything more than points of light.
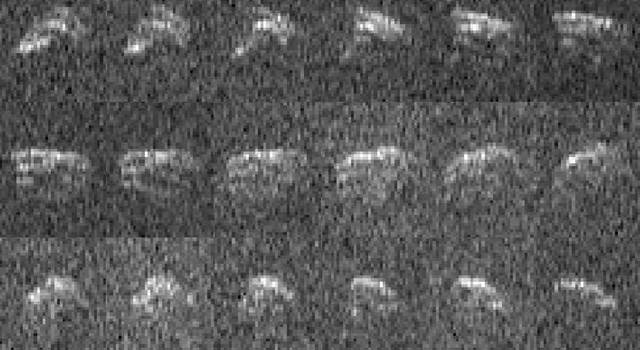
By convention, radar images appear “lit” from above. That’s the side closest to the antenna. As you examine a radar image from top to bottom, distance from the antenna increases and the asteroid fades. If the equator of the asteroid faces the antenna, it will appear brightly illuminated at the top of the image. If the antenna faces one of the poles, the pole will be on top and lit up. It takes a bit of getting used to.
Nine radar images of near-Earth asteroid 2007 PA8 obtained between by NASA’s 230-foot-wide (70-meter) Deep Space Network antenna. The part of the asteroid closest to the antenna is at top. Credit: NASA/JPL-Caltech
The asteroid’s width in the images depends on the asteroid’s rotation rate and the antenna’s perspective. If the antenna stares directly down over the equator and the asteroid rotates rapidly, the images will be stretched from Doppler-shifting of the returned radar echo.
Radio waves are a form of light just like the familiar colors of the rainbow. If radio light is moving toward you, its waves bunch together more tightly and appear slightly bluer than if they were at rest. Astronomers call this a Doppler shift or blueshift. If they’re moving away, the light waves get stretched and become “redshifted”.
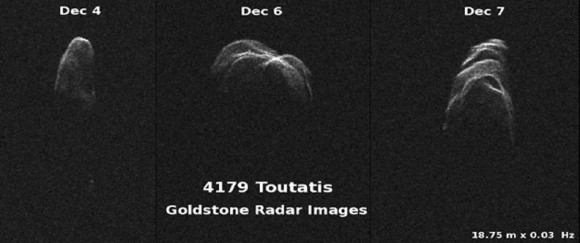
Three views of asteroid 4179 Toutatis made in early Dec. 2012 by Goldstone. In all three, distance from the antenna increases from top to bottom and Doppler frequency increases toward the right, indicating Toutatis rotates from right to left, since that’s the side of the asteroid approaching the observer. Credit: NASA/JPL-Caltech
A slow-rotating asteroid will appear narrower to radar eyes, and if it doesn’t rotate at all, will show up as a “spike” of light. When the antenna happens to be point directly at a pole, the asteroid will appear to be rotating neither toward nor away from the observer and also look like a spike.
Most asteroids fall somewhere in between, and their radar portraits are close to their true shapes. Radar images show us surface textures, shape, size, rotation rate and surface features like craters. 2013 ET joins the ranks of numerous asteroids probed by radio waves from Earth as we try to grasp the complexity of our planetary neighborhood while hoping for we don’t stare down cosmic disaster anytime soon.
And if you’re interested in looking back, here’s an archive to all the past Carnivals of Space. If you’ve got a space-related blog, you should really join the carnival. Just email an entry to [email protected], and the next host will link to it. It will help get awareness out there about your writing, help you meet others in the space community – and community is what blogging is all about. And if you really want to help out, sign up to be a host. Send an email to the above address.
Not even two and a half weeks after a memory glitch that sent NASA’s Curiosity rover into a safe mode on Feb. 27, the robotic Mars explorer once again went into standby status as the result of a software discrepancy — although mission engineers diagnosed the new problem quickly and anticipate having the rover out of safe mode in a couple of days.
“This is a very straightforward matter to deal with,” said Richard Cook, project manager for Curiosity at Jet Propulsion Laboratory in Pasadena. “We can just delete that file, which we don’t need anymore, and we know how to keep this from occurring in the future.”
“Curiosity initiated this automated fault-protection action, entering ‘safe mode’ at about 8 p.m. PDT (11 p.m. EDT) on March 16, while operating on the B-side computer, one of its two main computers that are redundant to each other. It did not switch to the A-side computer, which was restored last week and is available as a back-up if needed. The rover is stable, healthy and in communication with engineers.
“The safe-mode entry was triggered when a command file failed a size-check by the rover’s protective software. Engineers diagnosed a software bug that appended an unrelated file to the file being checked, causing the size mismatch.”
The rover is stable, healthy and in communication with engineers.
– NASA’s Jet Propulsion Laboratory
Once Curiosity is back online its investigation into the watery history of Gale crater will resume, but another hiatus — this one planned — will commence on April 4, when Mars will begin passing behind the Sun from Earth’s perspective. Mission engineers will refrain from sending commands to the rover during a four-week period to avoid data corruption from solar interference.
Keep up with the latest news from the MSL mission here.
Then again, there’s a certain personality on Twitter who claims a slightly different reason for these recent setbacks…
Aurora over Sweden on March 17, 2013. Credit: Chad Blakley/lightsoverlapland.com
Photographer Chad Blakley took this imagery yesterday of green aurorae over the Abisko National Park in Sweden. Fittingly, it was St. Patrick’s Day! Check out his website, in case you want to travel to see the aurora borealis – Blakley can take you on a tour!
Rock Target ‘Knorr’ Near Curiosity. Scientists used Curiosity's Mast Camera (Mastcam) to study spectral characteristics of the rock target called Knorr in the Yellowknife Bay area and determined that it possessed veins of hydrated minerals, including hydrated calcium sulfate. This self-portrait is a mosaic of images taken by Curiosity's Mars Hand Lens Imager (MAHLI) camera during Sol 177 (Feb. 3, 2013). Credit: NASA/JPL-Caltech/MSSS
The science team guiding NASA’s Curiosity Mars Science Lab (MSL) rover have demonstrated a new capability that significantly enhances the robots capability to scan her surroundings for signs of life giving water – from a distance. And the rover appears to have found that evidence for water at the Gale Crater landing site is also more widespread than prior indications.
The powerful Mastcam cameras peering from the rovers head can now also be used as a mineral-detecting and hydration-detecting tool to search 360 degrees around every spot she explores for the ingredients required for habitability and precursors to life.
Researchers announced the new findings today (March 18) at a news briefing at the Lunar and Planetary Science Conference in The Woodlands, Texas.
“Some iron-bearing rocks and minerals can be detected and mapped using the Mastcam’s near-infrared filters,” says Prof. Jim Bell, Mastcam co-investigator of Arizona State University, Tempe.
Bell explained that scientists used the filter wheels on the Mastcam cameras to run an experiment by taking measurements in different wavelength’s on a rock target called ‘Knorr’ in the Yellowknife Bay area were Curiosity is now exploring. The rover recently drilled into the John Klein outcrop of mudstone that is crisscrossed with bright veins.
Curiosity accomplished Historic 1st drilling into Martian rock at John Klein outcrop on Feb 8, 2013 (Sol 182), shown in this context mosaic view of the Yellowknife Bay basin taken on Jan. 26 (Sol 169) where the robot is currently working. The robotic arm is pressing down on the surface at John Klein outcrop of veined hydrated minerals – dramatically back dropped with her ultimate destination; Mount Sharp. Credit: NASA/JPL-Caltech/Ken Kremer (kenkremer.com)/Marco Di Lorenzo
Researchers found that near-infrared wavelengths on Mastcam can be used as a new analytical technique to detect the presence of some but not all types of hydrated minerals.
“Mastcam has some capability to search for hydrated minerals,” said Melissa Rice of the California Institute of Technology, Pasadena.
“The first use of the Mastcam 34 mm camera to find water was at the rock target called “Knorr.”
“With Mastcam, we see elevated hydration signals in the narrow veins that cut many of the rocks in this area. These bright veins contain hydrated minerals that are different from the clay minerals in the surrounding rock matrix.”
Mastcam thus serves as an early detective for water without having to drive up to every spot of interest, saving precious time and effort.
Hydration in Veins and Nodules at ‘Knorr’ rock in Yellowknife bay. At different locations on the surface of the same rock, scientists can use the Mast Camera (Mastcam) on Curiosity to measure the amount of reflected light at a series of different wavelengths to obtain spectral information about composition. The inset photograph shows two locations on a rock target called “Knorr,” where Mastcam spectral measurements were made: A light-toned vein and part of the host rock. The main graph shows the spectra recorded at those two points, with increasing wavelengths of visible light and near-infrared light from left to right, and with increasing intensity of reflectance from bottom to top. The bright vein shows greater reflectance through the range of wavelengths assessed. The shapes of the two curves also differ, especially where the vein spectrum dips in the near-infrared wavelengths. The range of wavelengths included in box-outlined portion of the vein spectrum is shown at the top of the group of reference spectra to the right. These reference spectra show how the dip in reflectance at those wavelengths in the vein material corresponds to dips in those wavelengths in several types of hydrated minerals — minerals that have molecules of water bound into their crystalline structure, including hydrated calcium-sulfates. Mastcam is not sensitive to all hydrated minerals, however, including many phyllosilicates. Credit: NASA/JPL-Caltech/MSSS/ASU
But Mastcam has some limits. “It is not sensitive to the hydrated phyllosilicates found in the drilling sample at John Klein” Rice explained.
“Mastcam can use the hydration mapping technique to look for targets related to water that correspond to hydrated minerals,” Rice added. “It’s a bonus in searching for water!”
The key finding of Curiosity thus far is that the fine-grained, sedimentary mudstone rock at the Yellowknife Bay basin possesses a significant amount of phyllosilicate clay minerals; indicating an environment where Martian microbes could once have thrived in the distant past.
“We have found a habitable environment which is so benign and supportive of life that probably if this water was around, and you had been on the planet, you would have been able to drink it,” said John Grotzinger, the chief scientist for the Curiosity Mars Science Laboratory mission at the California Institute of Technology in Pasadena, Calif.
Hydration Map, Based on Mastcam Spectra for ‘Knorr’ rock target shows coded map of the amount of mineral hydration indicated by a ratio of near-infrared reflectance intensities measured by Curiosity. The color scale on the right shows the assignment of colors for relative strength of the calculated signal for hydration. The map shows that the stronger signals for hydration are associated with pale veins and light-toned nodules in the rock. The Mastcam observations were conducted during Sol 133 (Dec. 20, 2012). The width of the area shown in the image is about 10 inches (25 centimeters). Credit: NASA/JPL-Caltech/MSSS/ASU
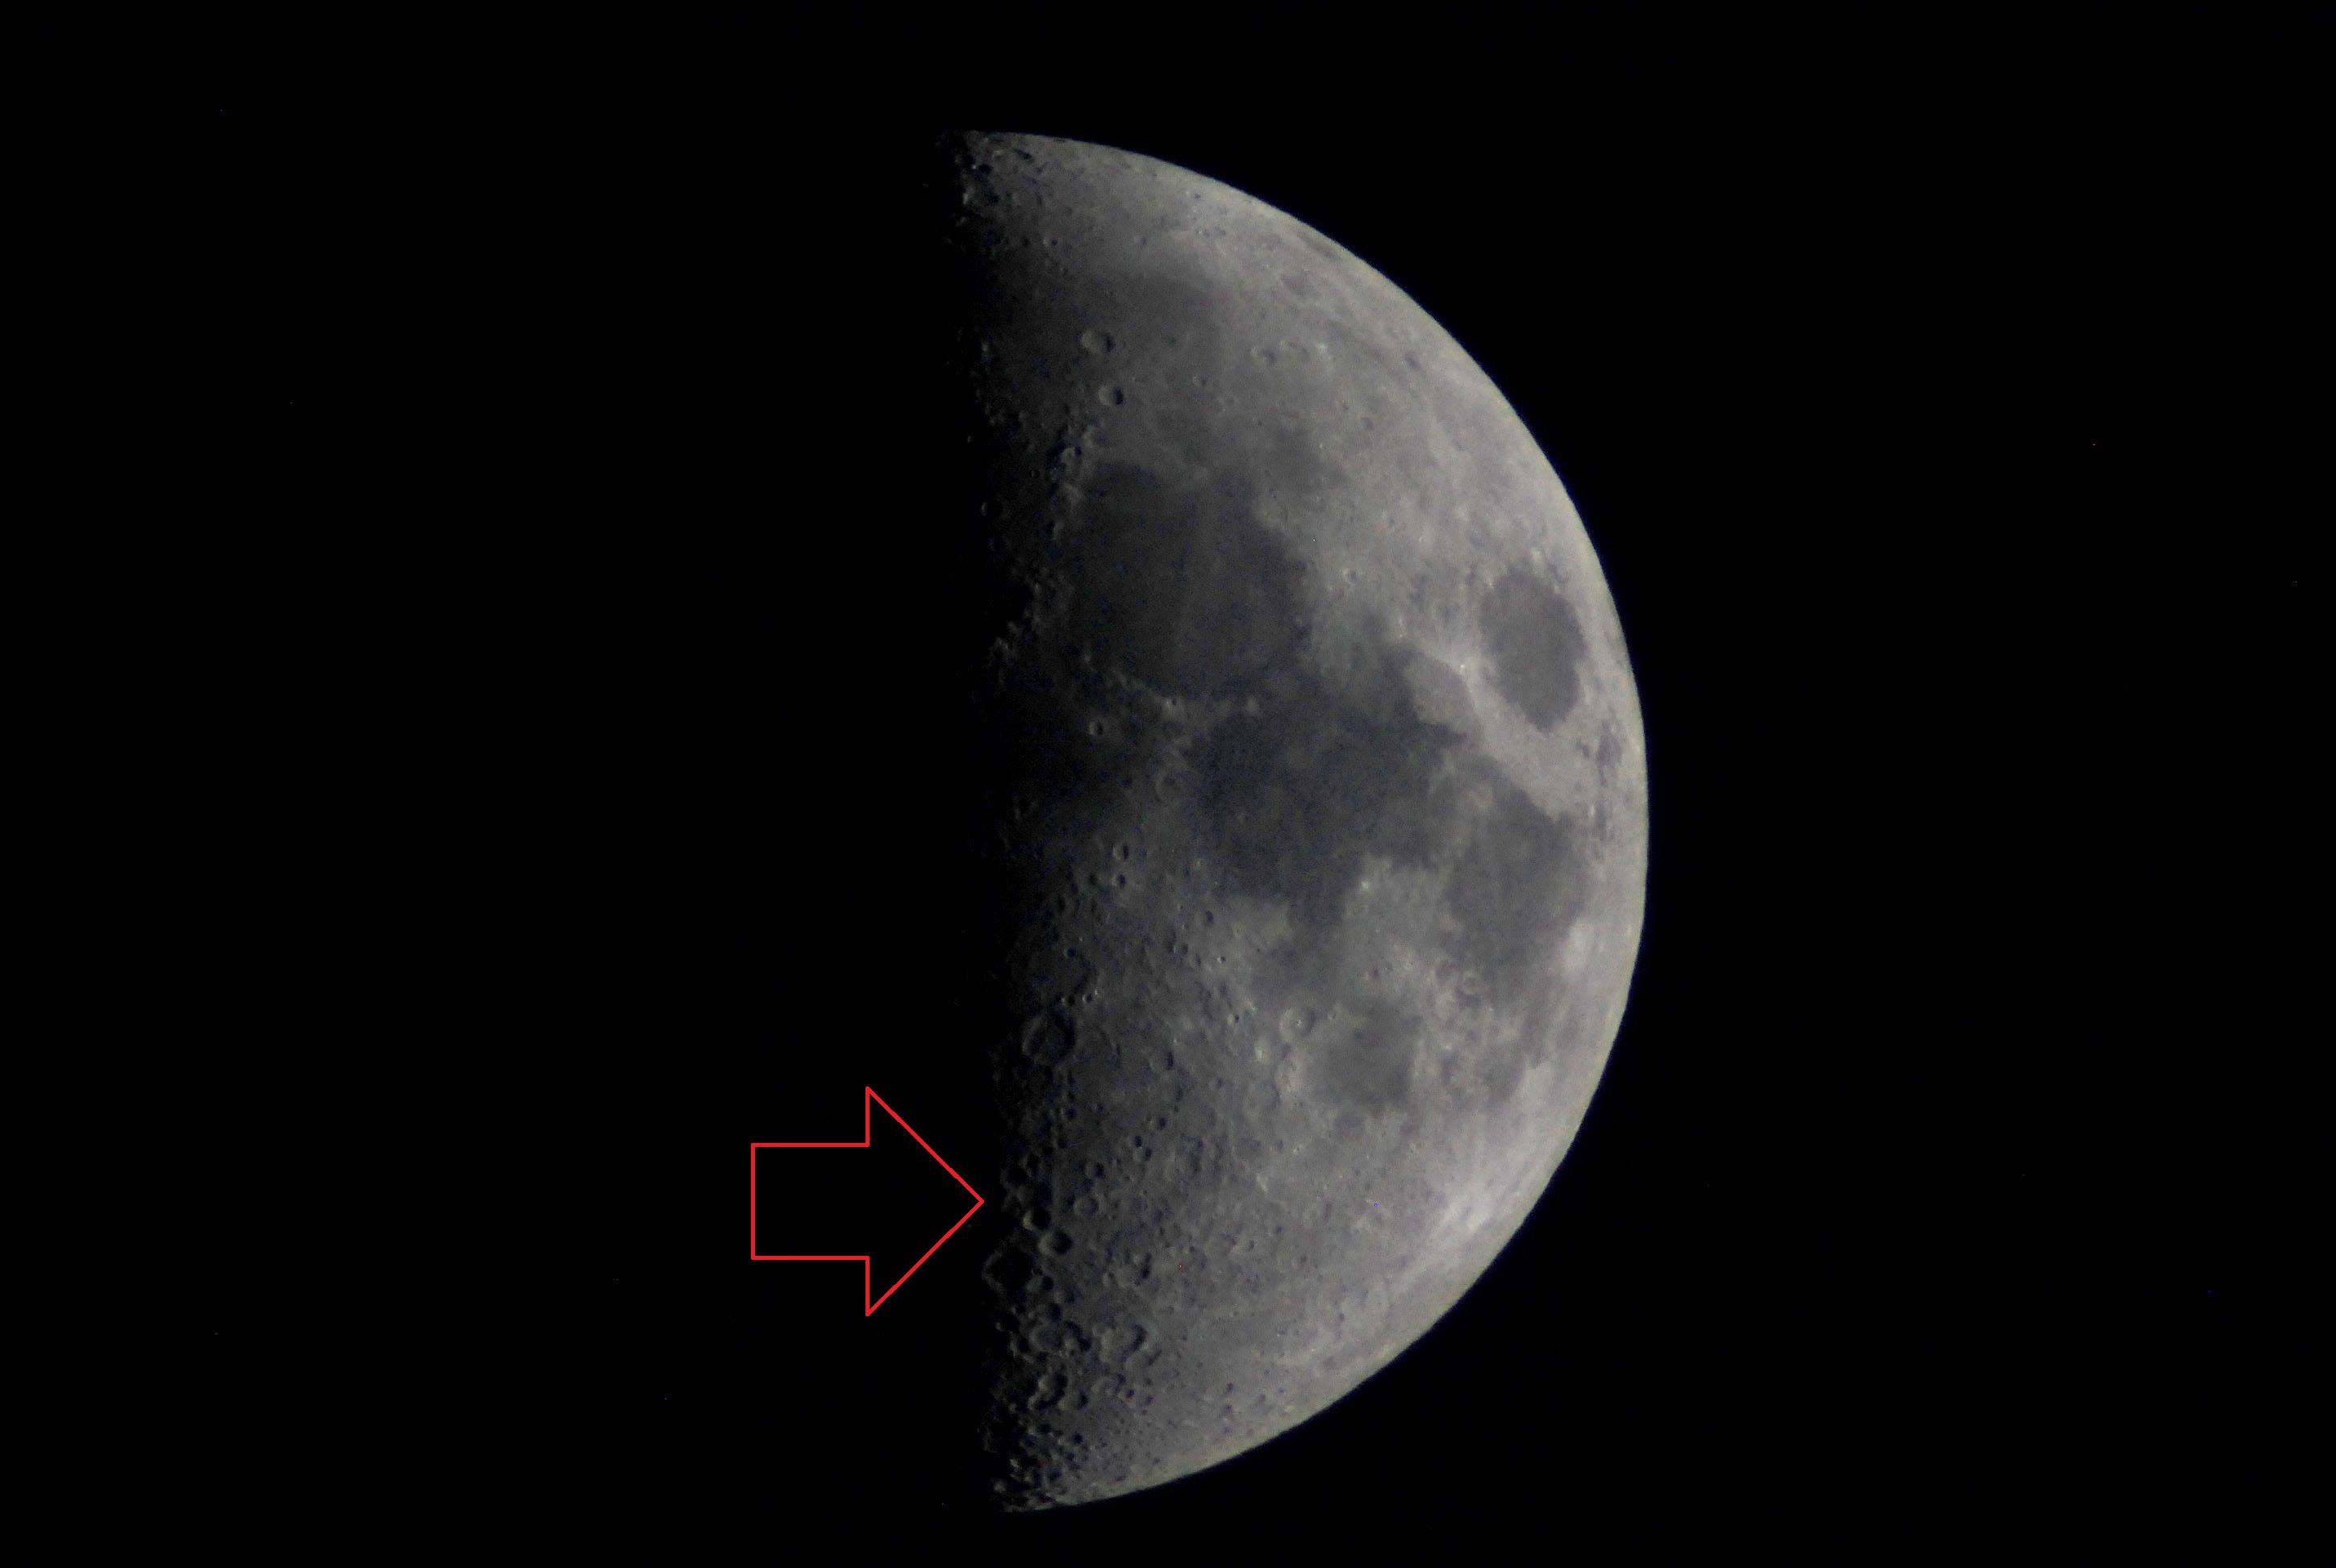
The Lunar X, captured by the author on June 8th, 2011.
This week offers observers a shot at capturing a fascinating but elusive lunar feature.
But why study the Moon? It’s a question we occasionally receive as a backyard astronomer. There’s a sort of “been there, done that” mentality associated with our nearest natural neighbor in space. Keeping one face perpetually turned Earthward, the Moon goes through its 29.5 synodic period of phases looking roughly the same from one lunation to the next. Then there’s the issue of light pollution. Many deep sky imagers “pack it in” during the weeks surrounding the Full Moon, carefully stacking and processing images of wispy nebulae and dreaming of darker times ahead…
But fans of the Moon know better. Just think of life without the Moon. No eclipses. No nearby object in space to give greats such as Sir Isaac Newton insight into celestial mechanics 101. In fact, there’s a fair amount of evidence to suggest that life arose here in part because of our large Moon. The Moon stabilizes our rotational axis and produces a large tidal force on our planet. And as all students of lunar astronomy know, not all lunations are exactly equal.
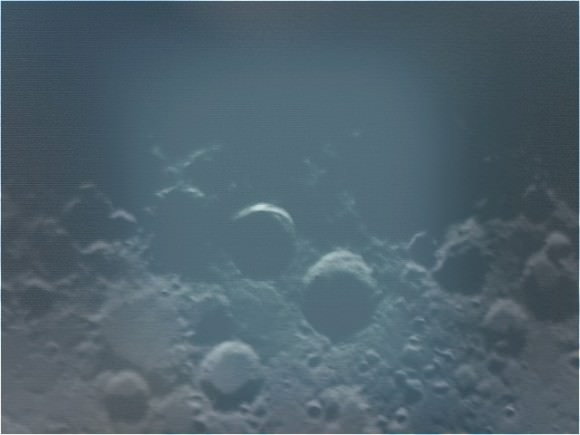
A daytime capture of the Lunar X. (Photo by Author).
This week, we get a unique look at a feature embedded in the lunar highlands which demonstrates this fact. The Lunar X, also sometimes known as the Purbach cross or the Werner X reaches a decent apparition on March 19th at 11:40UT/7:40EDT favoring East Asia and Australia. This feature is actually the overlapping convergence of the rims of Blanchinus, La Caille and Purbach craters. The X-shaped feature reaches a favorable illumination about six hours before 1st Quarter phase and six hours after Last Quarter phase. It is pure magic watching the X catch the first rays of sunlight while the floor of the craters are still immersed in darkness. For about the span of an hour, the silver-white X will appear to float just beyond the lunar terminator.
Visibility of the Lunar X for the Remainder of 2013.
Lunation
Date
Time
Phase
Favors
1116
March 19th
11:40UT/7:40EDT
Waxing
East Asia/Australia
1116
April 3rd
3:20UT/23:20EDT*
Waning
Africa/Europe
1117
April 17th
23:47UT/19:47EDT
Waxing
Eastern North America
1117
May 2nd
16:19UT/12:19EDT
Waning
Central Pacific
1118
May 17th
10:51UT/6:51EDT
Waxing
East Asia/Australia
1118
June 1st
4:31UT/0:31EDT
Waning
Western Africa
1119
June 15th
21:21UT/17:21EDT
Waxing
South America
1119
June 30th
16:04UT/12:04EDT
Waning
Western Pacific
1120
July 15th
7:49UT/3:49EDT
Waxing
Australia
1120
July 30th
3:16UT/23:16EDT*
Waning
Africa/Western Europe
1121
August 13th
18:50UT/14:50EDT
Waxing
South Atlantic
1121
August 28th
14:27UT/10:27EDT
Waning
Central Pacific
1122
September 12th
9:50UT/5:50EDT
Waxing
East Asia/Australia
1122
September 27th
2:00UT/22:00EDT*
Waning
Middle East/East Africa
1123
October 11th
19:52UT/15:52EDT
Waxing
Atlantic Ocean
1123
October 26th
14:12UT/10:12EDT
Waning
Central Pacific
1124
November 10th
10:03UT/5:03EST
Waxing
East Asia/Australia
1124
November 25th
3:14UT/22:14EST*
Waning
Africa/Europe
1125
December 10th
00:57UT/19:57EST
Waxing
Western North America
1126
December 24th
17:07UT/12:07EST
Waning
Western Pacific
*Times marked in bold denote visibility in EDT/EST the evening prior.
Fun Factoid: All lunar apogees and perigees are not created equal either. The Moon also reaches another notable point tonight at 11:13PM EDT/ 3:13 UT as it arrives at its closest apogee (think “nearest far point”) in its elliptical orbit for 2013 at 404,261 kilometres distant. Lunar apogee varies from 404,000 to 406,700 kilometres, and the angular diameter of the Moon appears 29.3’ near apogee versus 34.1’ near perigee. The farthest and visually smallest Full Moon of 2013 occurs on December 17th.
The first sighting of the Lunar X feature remains a mystery, although modern descriptions of the curious feature date back to an observation made by Bill Busler in June 1974. As the Sun rises across the lunar highlands the feature loses contrast. By the time the Moon reaches Full, evidence of the Lunar X vanishes all together. With such a narrow window to catch the feature, many longitudes tend to miss out during successive lunations. Note that it is possible to catch the 1st and Last Quarter Moon in the daytime.
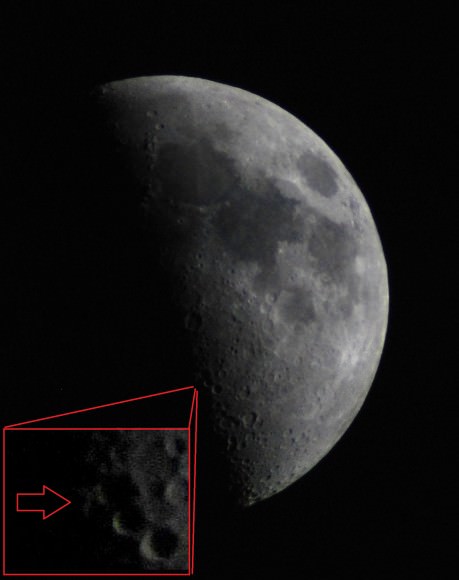
A 1st Quarter Moon with the Lunar X (inset). (Photo by Author).
Compounding the dilemma is the fact that the lighting angle for each lunation isn’t precisely the same. This is primarily because of two rocking motions of the Moon known as libration and nutation. Due to these effects, we actually see 59% of the lunar surface. We had to wait for the advent of the Space Age and the flight of the Soviet spacecraft Luna 3 in 1959 to pass the Moon and look back and image its far side for the first time.
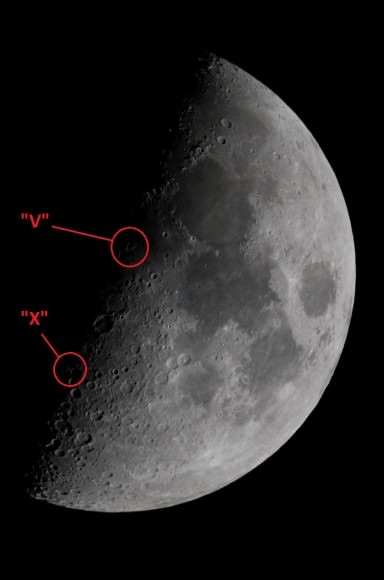
We actually managed to grab the Lunar X during a recent Virtual Star Party this past February. Note that another fine example of lunar pareidolia lies along the terminator roughly at the same time as the Lunar X approaches favorable illumination. The Lunar V sits near the center of the lunar disk near 1st and Last Quarter as well and is visible right around the same time. Formed by the confluence of two distinct ridges situated between the Mare Vaporum and Sinus Medii, it is possible to image both the Lunar X and the Lunar V simultaneously!
A simultaneous capture of the Lunar X & the Lunar V features. (Photo by Author).
This also brings up the interesting possibility of more “Lunar letters” awaiting discovery by keen-eyed amateur observers… could a visual “Lunar alphabet be constructed similar to the one built by Galaxy Zoo using galactic structures? Obviously, the Moon has no shortage of “O’s,” but perhaps “R” and “Q” would be a bit more problematic. Let us know what you see!
-Thanks to Ed Kotapish for providing us with the calculations for the visibility of the Lunar X for 2013.
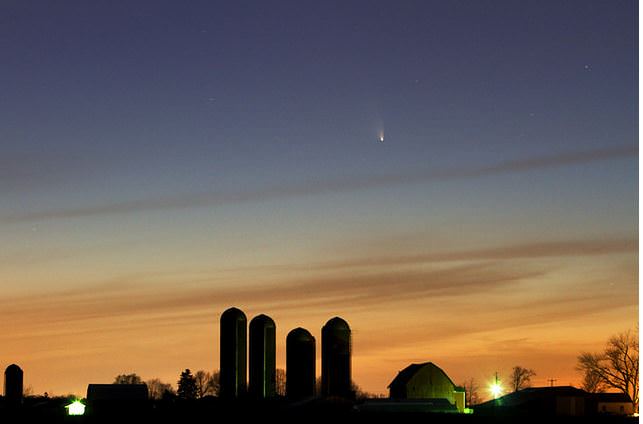
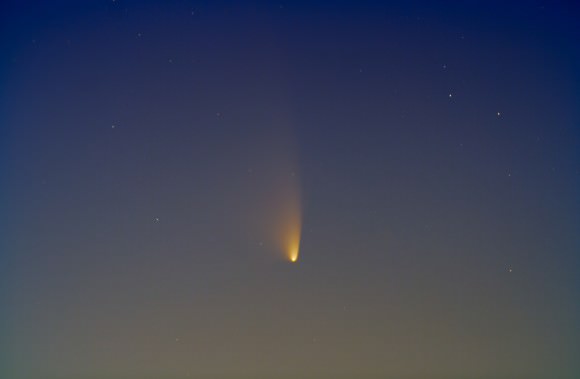
Comet PANSTARRS above a farm near Alto, Michigan. Credit: Kevin's Stuff on Flickr.
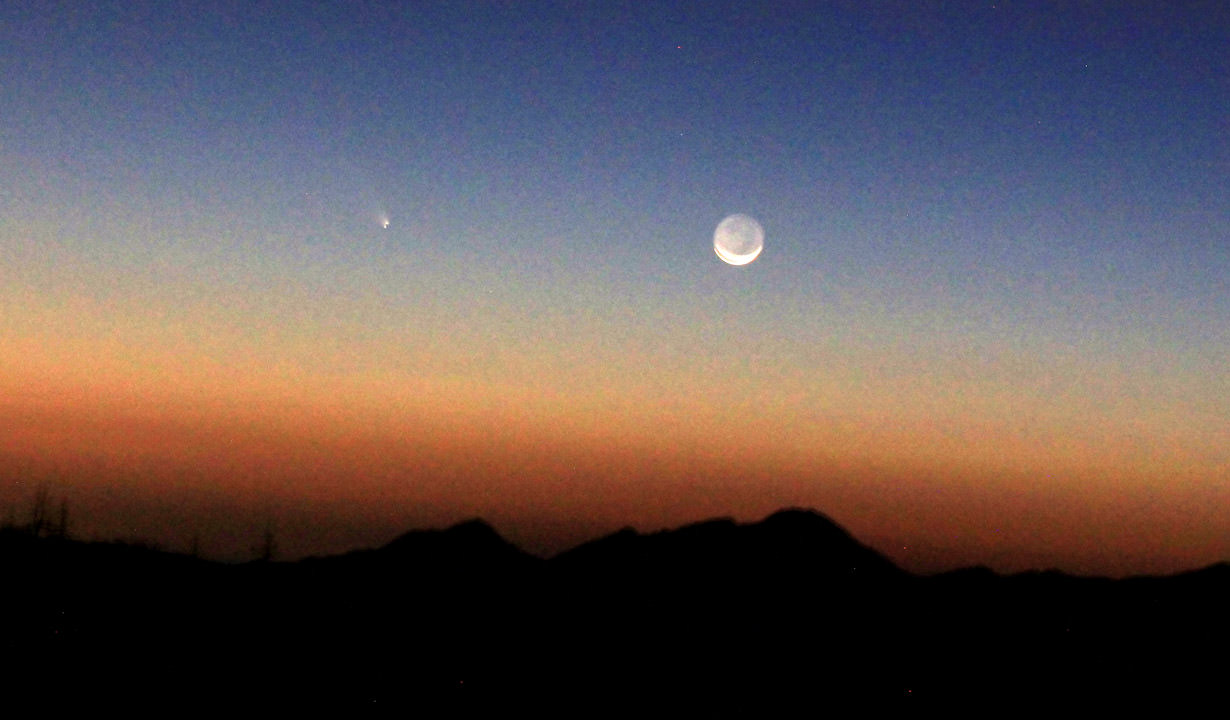
Comet C/2011 L4 (PanSTARRS) keeps getting easier to see, and over the weekend, we were inundated with images and videos from astrophotographers around the world. NASA says that solar heating from the comet’s close pass of the Sun last week has caused the comet to glow brighter than a first magnitude star. Bright twilight sharply reduces visibility, but it is still an easy target for binoculars and small telescopes 1 and 2 hours after sunset. And as of March 15th, people reported they can see the comet with the unaided eye.
Photographer Fred Kamphues took this timelapse from the Leiden Observatory in The Netherlands, the oldest astronomical observatory in the world still active today. Kamphues notes that astronomer Jan Hendrik Oort of Leiden Observatory discovered the origin of comets in 1950. The observatory is used today by student astronomers to learn observing.
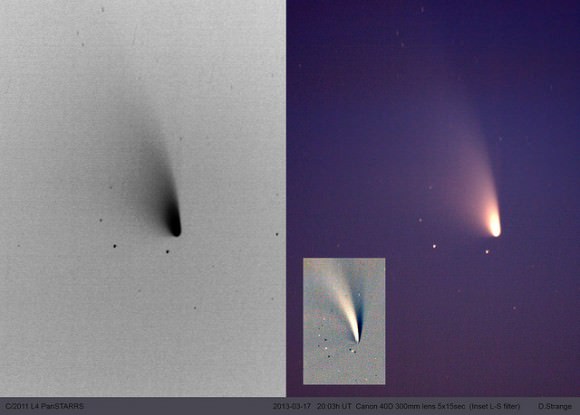
Comet C/2011 L4 (PANSTARRS) taken on March 16 from Mount Faito (Naples, Italy). Credit and copyright: Ernesto Guido & Antonio CatapanoSpecial filters and a negative image to try and ‘tease out the structure of the tail,’ says photographer David G. Strange.Comet PANSTARRS over Tallinn, Estonia on March 16, 2013. Credit and copyright: Karthikeyan VJComet PANSTARRS over the San Gabriel mountains on 3/12/2013 above Pasadena,CA, 3-4 miles from Mt.Wilson. Shot with a with Canon 60D. Credit and copyright: Henry Levenson.Comet PANSTARRS, shot from near Keene, Ontario, Canada, on March 16, 2013, using a Canon 50D (modified) with Canon 200mm lens; 4 sec. exp.; f/4.5; 640 ISO. Credit and copyright: Rick Stankiewicz, Peterborough Astronomical Association (PAA) [/caption
This video, above, from UT reader Brent (a.k.a. HelloBozos) in Florida shows this compilation of views of the Sun and the comet. “At 2:08 in the video, a bird flies in front of the camera,” Brent said via email, “This was all done off the side the road, on 3-16-13 8pm-8:30pm.”
[caption id="attachment_100801" align="aligncenter" width="580"] Comet PANSTARRS over Arizona on March 16, 2013. Credit and copyright: Chris Schur
This image is from Chris Schur in Arizona. He says, “Note the fan tail appearing! Also the tail is really starting to curve in the images. Very easy to see naked eye, and so was the yellow color in binoculars when it gets lower.”
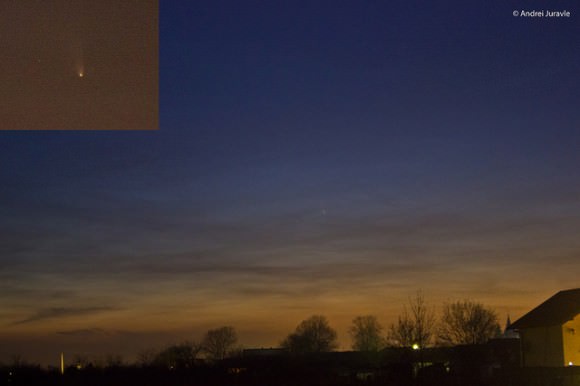
Comet PANSTARRS on March 17, 2013. Credit and copyright: Andrei Juravle.Comet PanSTARRS (C/2011 L4) taken near Koprivnica (Koprivni?ki Bregi), Croatia. Credit and copyright: Vedran Matica.
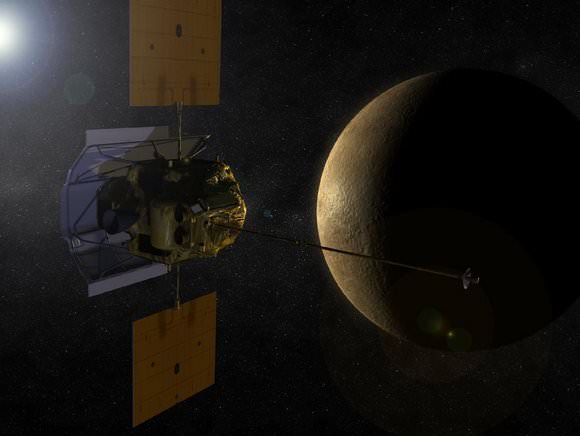
Artist's concept of MESSENGER in orbit around Mercury. Courtesy of NASA
After two years of doing the loop-the-loop around Mercury, MESSENGER has unveiled a bunch of surprises from Mercury — the closest planet to the Sun.
The spacecraft launched in 2004 and made three flybys of the planet before settling into orbit two years ago today. Incredibly, MESSENGER is only the second NASA probe to visit Mercury; the first one, Mariner 10, only flew by a few times in the 1970s. It was an incredible feat for the time, but we didn’t even have a complete map of Mercury before MESSENGER arrived at the planet.
So, what have scientists found in MESSENGER’s two years in orbit? Tales of sulfur, organic materials and iron, it turns out.
Mercury’s south pole has a weak spot
Magnetic field lines differ at Mercury’s north and south poles As a result of the north-south asymmetry in Mercury’s internal magnetic field, the geometry of magnetic field lines is different in Mercury’s north and south polar regions. Credit: NASA/Johns Hopkins University Applied Physics Laboratory/Carnegie Institution of Washington
The magnetic field lines converge differently at the north and south poles of Mercury. What does this mean? There’s a larger “hole” at the south pole for charged particles to do their thing to the surface of Mercury. At the time this information was released, NASA said it’s possible that space weathering or erosion would be different at the north and south poles because of this. Charged particles on the surface would also add to Mercury’s wispy atmosphere.
How the atmosphere changes according to distance from the sun
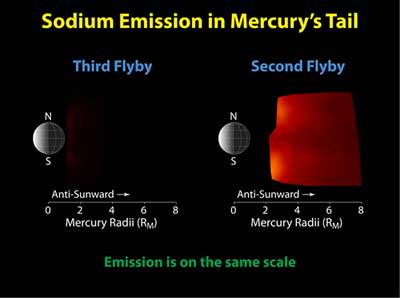
Comparison of neutral sodium observed during MESSENGER’s second and third Mercury flybys. Credit: NASA
Wondering about the atmosphere on Mercury? It depends on the season, and also the element. The scientists found striking changes in calcium, magnesium and sodium when the planet was closer to and further from the sun.
“A striking illustration of what we call ‘seasonal’ effects in Mercury’s exosphere is that the neutral sodium tail, so prominent in the first two flybys, is 10 to 20 times less intense in emission and significantly reduced in extent,” said participating scientist Ron Vervack, of the Johns Hopkins University Applied Physics Laboratory in 2009. “This difference is related to expected variations in solar radiation pressure as Mercury moves in its orbit and demonstrates why Mercury’s exosphere is one of the most dynamic in the solar system.”
Discovery of water ice and organics
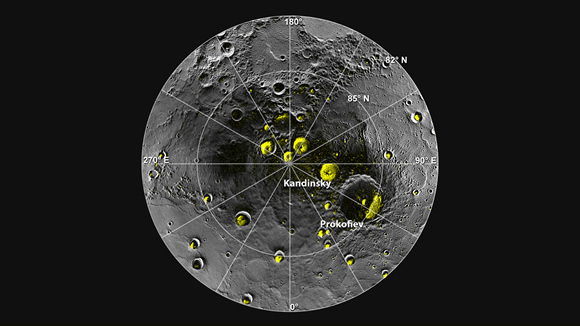
A radar image of Mercury’s north polar region is shown superposed on a mosaic of MESSENGER images of the same area. All of the larger polar deposits are located on the floors or walls of impact craters. Deposits farther from the pole are seen to be concentrated on the north-facing sides of craters. Credit: NASA/Johns Hopkins University Applied Physics Laboratory/Carnegie Institution of Washington/National Astronomy and Ionosphere Center, Arecibo Observatory
Late in 2012, NASA finally was able to corroborate some science results from about 20 years ago. Scientists on Earth saw “radar bright” images from Mercury in the 1990s, implying that there was ice and organic materials at the poles. MESSENGER finally confirmed that through three separate lines of investigation that were published in Science in 2012. Scientists estimated the planet holds between 100 billion and 1 trillion tons of water ice, perhaps as deep as 20 meters in some places. “Water ice passed three challenging tests and we know of no other compound that matches the characteristics we have measured with the MESSENGER spacecraft,” said MESSENGER principal investigator Sean Solomon in a NASA briefing.
Mercury has a big iron core
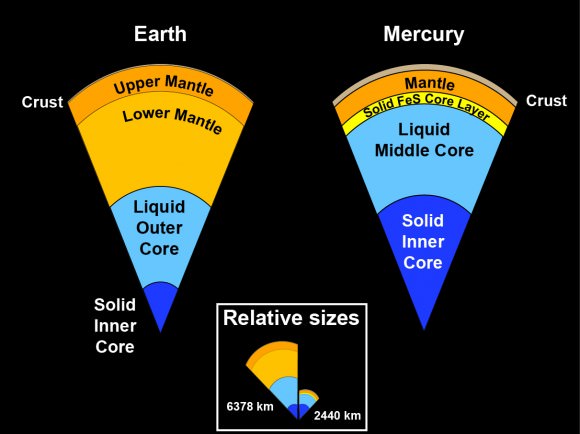
The internal structure of Mercury is very different from that of the Earth. The core is a much larger part of the whole planet in Mercury and it also has a solid iron-sulfur cover. As a result, the mantle and crust on Mercury are much thinner than on the Earth. Credit: Case Western Reserve University
While scientists knew before that Mercury has an iron core, the sheer size of it surprised scientists. At 85%, the proportion of the core to the rest of the planet dwarfs its rocky solar system companions. Further, scientists measured Mercury’s gravity. From that, they were surprised to see that the planet had a partially liquid core. “The planet is sufficiently small that at one time many scientists thought the interior should have cooled to the point that the core would be solid,” stated Case Western Reserve University’s Steven A. Hauck II, a co-author of a paper on the topic that appeared in Science Express.
The surface is sulfur-rich
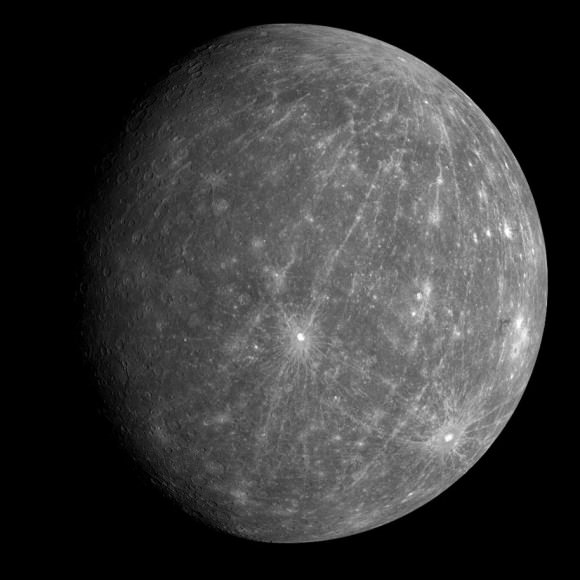
A global view of Mercury, as seen by MESSENGER. Credit: NASA
At some point in Mercury’s history, it’s possible that it could have had lavas erupt and sprinkle the surface with sulfur, magnesium and similar materials. At any rate, what is known for sure is there is quite a bit of sulfur on Mercury’s surface. “None of the other terrestrial planets have such high levels of sulfur. We are seeing about ten times the amount of sulfur than on Earth and Mars,” said paper author Shoshana Weider of the Carnegie Institution of Washington.
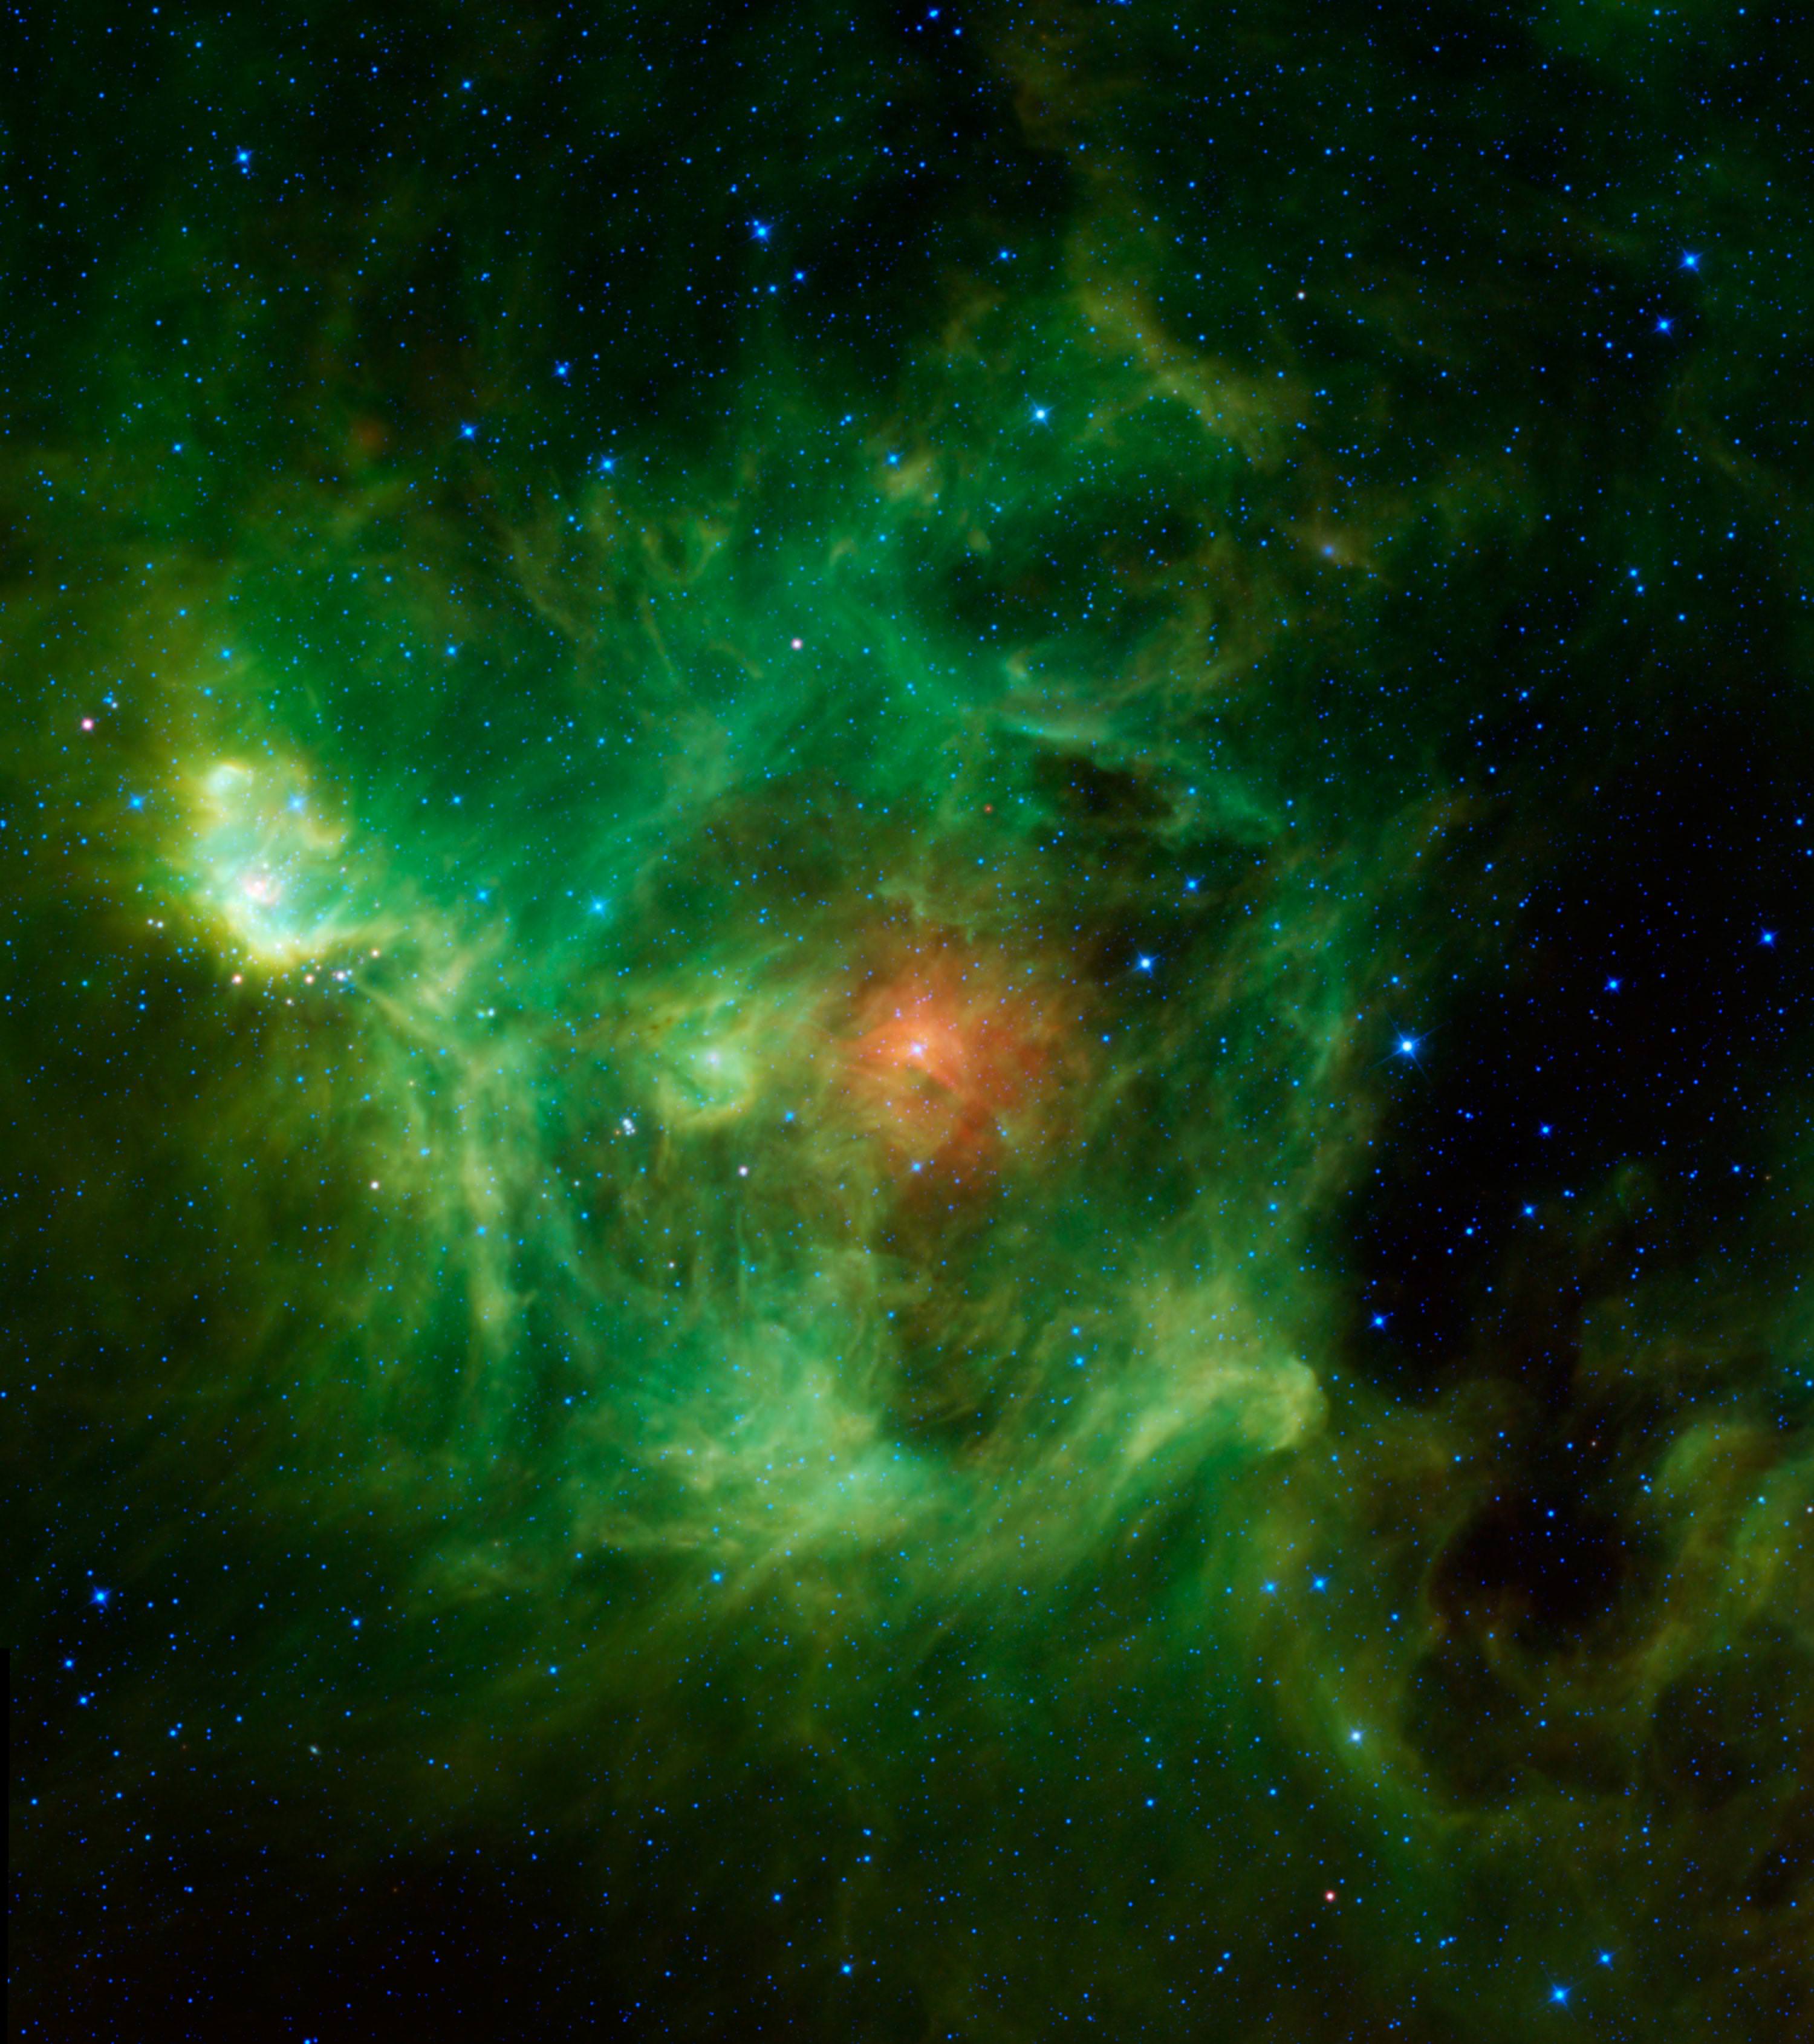
The Wreath Nebula (Barnard 3) glows green in space in this Wide-field Infrared Survey Explorer (WISE) image. Credit: NASA/JPL-Caltech/UCLA
While a quest for green beer in space would be difficult, we’re happy to report there are other ways you can celebrate Saint Patrick’s Day while looking at the night sky. Just check out the nebulae and aurorae in these pictures!
A word of caution, these pictures are taken by cameras that expose light for a very long time, sometimes using different filters, to bring out the colors. A nebula, for example, seen with our own eyes does not look quite as stunning.
The picture above shows the Wreath Nebula, which apparently is filled with warm dust bits that are about the same composition as smog.
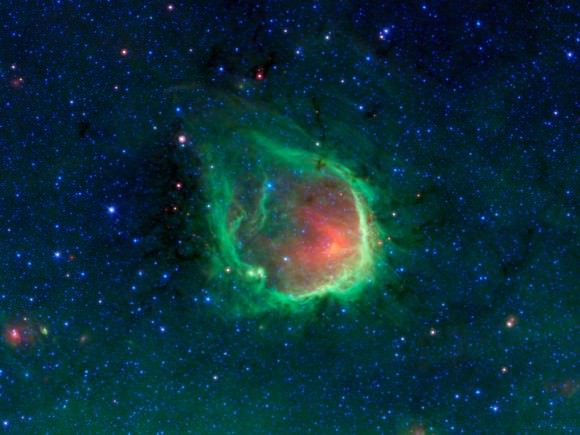
RCW 120. Credit: NASA/JPL-Caltech
Here’s a picture of a “Green Ring” Nebula; the NASA press release is worth a read for the hilarious Green Lantern references. But besides the science fiction, there is some neat science in action here: “The green color represents infrared light coming from tiny dust grains called polycyclic aromatic hydrocarbons,” NASA writes. “These small grains have been destroyed inside the bubble. The red color inside the ring shows slightly larger, hotter dust grains, heated by the massive stars.”
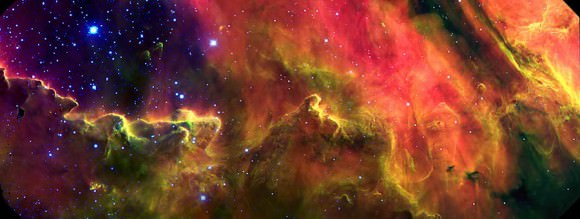
A portion of the Lagoon nebula imaged by the Gemini South telescope with the Gemini Multi-Object Spectrograph. Credit: Julia I. Arias and Rodolfo H. Barbá Departamento de Física, Universidad de La Serena (Chile), and ICATE-CONICET (Argentina).
You can even see hints of green in the Lagoon Nebula picture above. Using a filter that picks up green (sulfur) emission, the astronomers ferreted out a bit of emerald.
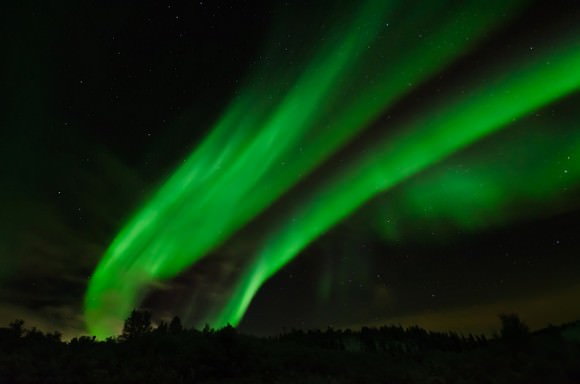
An October 2012 picture from Jason Arhns in Alaska, which he calls a “ghost flame.” Credit: Jason Arhns
If you live far enough north or south, you occasionally get to see aurorae dancing across the sky. These events, sometimes known as the Northern Lights or Southern Lights, occur due to interactions between the sun’s particles and the Earth’s upper atmosphere. We had some green stunners in October 2012 after a solar flare pushed a bunch of these particles in Earth’s direction. Most of the light you see in auroras comes from oxygen atoms being “excited” from the interaction with the sun’s particles; green occurs at higher altitudes, and red at lower ones.
Light curve of different stars.
One object that can’t glow green in space, however, is a star. Stellar colors depend on the surface of the star. Blue stars, the hottest ones, are at about 12,000 Kelvin and red stars, the coolest ones, are less than 3,500 Kelvin. (The sun is about in the middle, at 6,800 Kelvin, as it emits white light.)
As Universe Today publisher Fraser Cain pointed out in a past post, the only way a green star could be possible is if the light curve peaks at green. That doesn’t work, however: “If you make the star hotter, it just gets bluer,” he wrote. “And if you make a star cooler, it just becomes orange and then redder. There’s no way to have a light curve that makes a star look green.” Check out more details here.
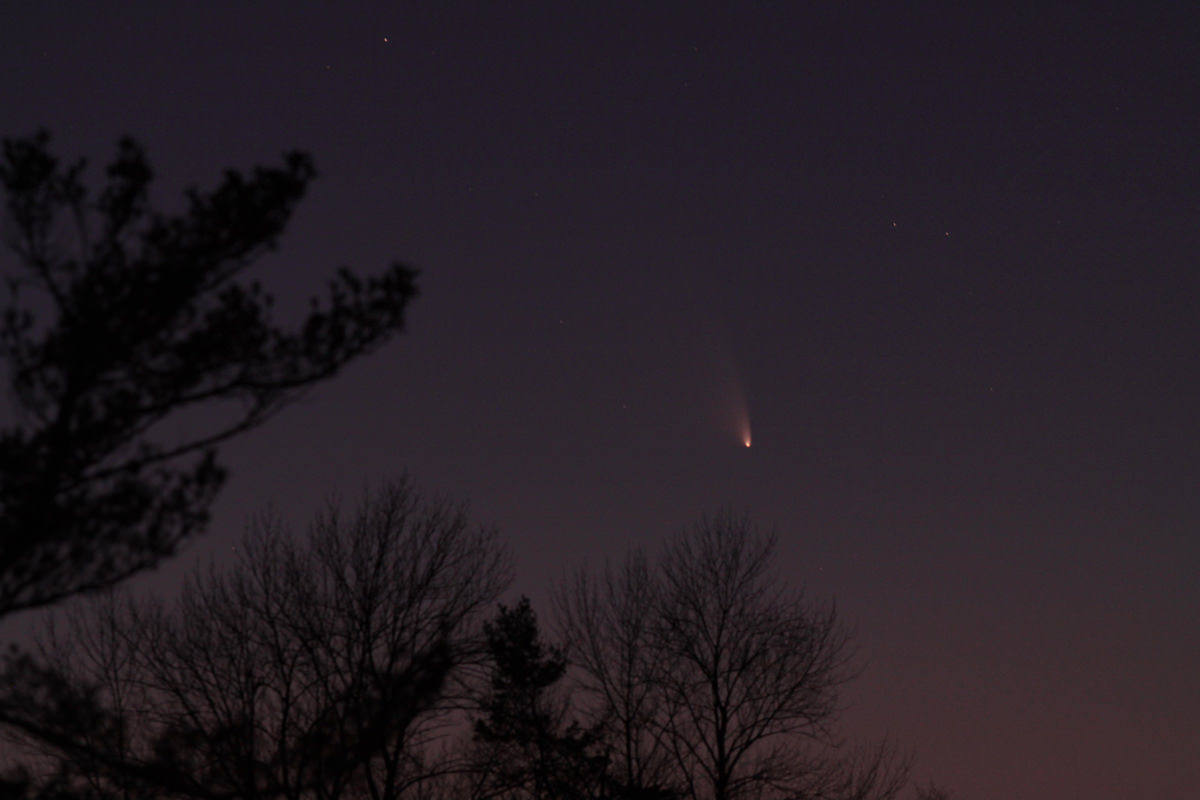
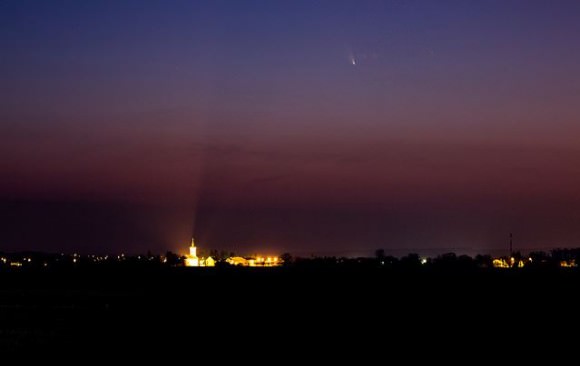
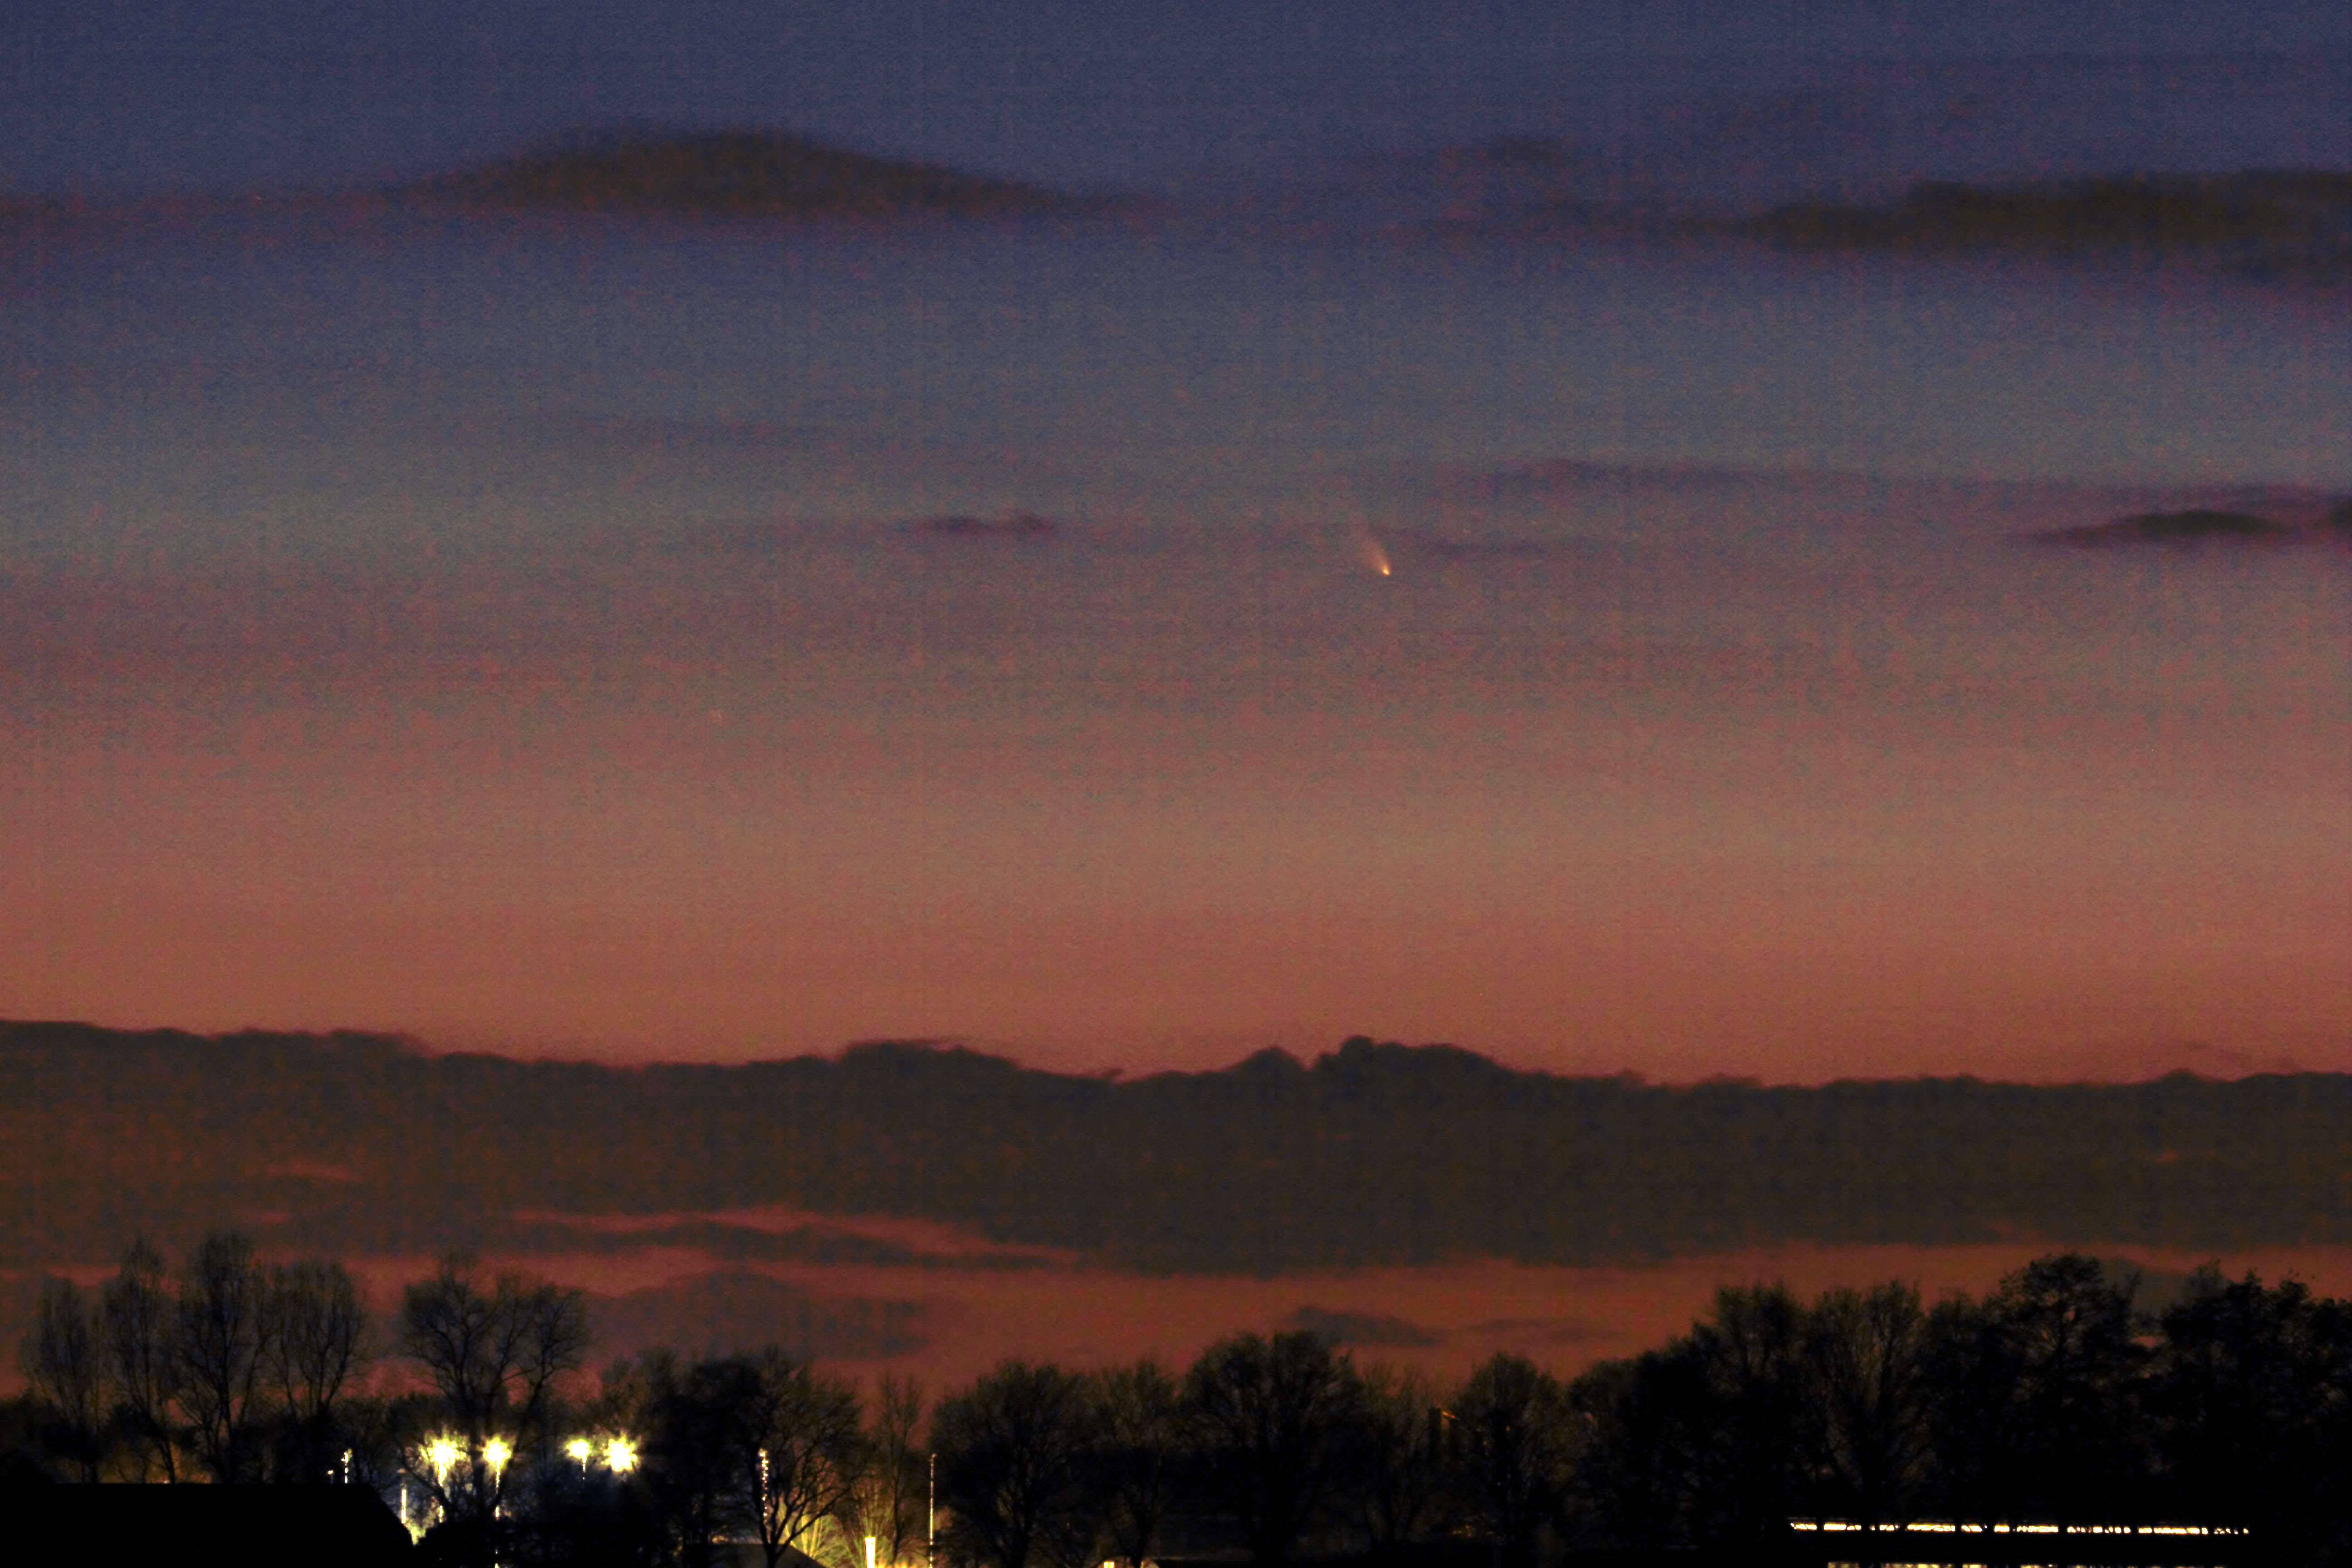
Comet Pan-STARRS thrills Dutch observers of the Night Sky on March 15, 2013 shortly after sunset. Shot with a Canon 60D camera and Canon 100/400 mm lens, exposure time 15 seconds, ISO 300 Credit: Rob van Mackelenbergh
Comet Pan-STARRS thrills Dutch observers of the Night Sky on March 14, 2013 shortly after sunset- note the rich hues. Shot with a Canon 60D camera and Canon 100/400 mm lens, exposure time 2 seconds, ISO 800. Credit: Rob van Mackelenbergh See viewing guide and sky maps below Update – see readers photo below[/caption]
Comet Pan-STARRS (C/2011 L4) is exciting amateur astronomers observing the night sky worldwide as it becomes visible in the northern latitudes after sunset. And now it’s wowing crowds in Europe and all over Holland – north to south.
Check out the beautiful, richly hued new photos of Comet Pan-STARRS captured on March 14, 2013 by Dutch astrophotographer Rob van Mackelenbergh.
“I took these photos in the southern part of the Netherlands on Thursday evening, March 14, at around 7:45 pm Dutch time with my Canon 60 D camera.”
“I was observing from the grounds of our astronomy club – “Sterrenwacht Halley” – named in honor of Halley’s Comet.”
Comet Pan-STARRS is a non-periodic comet from the Oort Cloud that was discovered in June 2011 by the Pan-STARRS telescope located near the summit of the Hawaiian Island of Maui.
The comet just reached perihelion – closest approach to the Sun – on March 10, 2013. It passed closest to Earth on March 5 and has an orbital period of 106,000 years.
Comet Pan-STARRS from Holland on March 14, 2013 at about 7:45 PM, shortly after sunset – Canon 60D camera, Canon 100/400 mm lens, exposure time 2 seconds, ISO 800. Credit: Rob van Mackelenbergh
“Over 30 people were watching with me and they were all very excited, looking with binoculars and cameras. People were cheering. They were so excited to see the comet. But it was very cold, about minus 2 C,” said Mackelenbergh.
The “Sterrenwacht Halley” Observatory was built in 1987 and houses a Planetarium and a Celestron C14 Schmidt-Cassegrain telescope. It’s located about 50 km from the border with Belgium, near Den Bosch – the capitol city of southern Holland.
Comet Pan-STARRS was photographed from Sterrenwacht Halley – or ‘Halley Observatory” in Holland. Credit: Rob van Mackelenbergh
“It was hard to see the comet with the naked eye. But we were able to watch it for about 45 minutes altogether in the west, after the sun set.”
“The sky was completely clear except for a few scattered clouds near the horizon. After the comet set, we went inside the observatory for a general lecture about Comets and especially Comets Pan-STARRS and ISON because most of the people were not aware about this year’s pair of bright comets.”
“So everyone was lucky to see Comet Pan-STARRS because suddenly the sky cleared of thick clouds!”
Comet Pan-STARRS from Holland on March 14, 2013 at about 7:45 PM, shortly after sunset – Canon 60D camera, Canon 100/400 mm lens, exposure time 2 seconds, ISO 800. Credit: Rob van Mackelenbergh
“In the past I also saw Comet Halley and Comet Hale-Bopp, but these are my first ever comet photos and I’m really excited !”
“I hope to see Comet Pan-STARRS again in the coming days when the sky is clear,” Mackelenbergh told me.
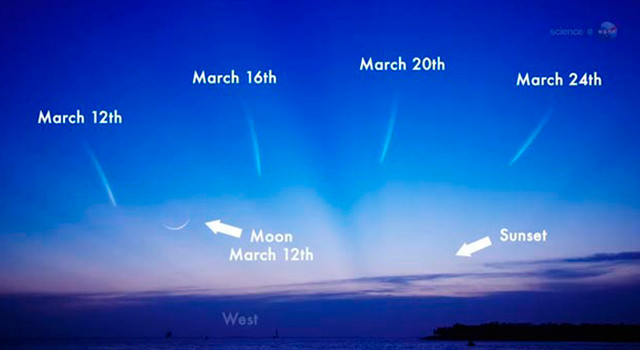
Over the next 2 weeks or so the sunset comet may grow in brightness even as it recedes from Earth into darker skies. Right now it’s about magnitude 0.2.
So keep looking with your binoculars; look west for up to 1 to 2 hours after sunset – and keep your eyes peeled.
See a readers photo of sunset Comet Pan-STARRS below
Comet Pan-STARRS viewing graphic from NASAComet Pan-Starrs Sky Map. Viewing guide to find the comet low in the horizon after sunset.Credit: Spaceweather.com