The International Space Station is one of the most complicated machines ever built and the largest object ever assembled in space.
At any time there are up to six astronauts on board, each originating from one of fifteen different nations on Earth. It orbits at an altitude of approximately four-hundred kilometers, and completes an orbit around the Earth every ninety-two minutes and fifty seconds. The station has a mass of four-hundred-and-twenty metric tonnes, and contains a dozen pressurized modules, and many more unpressurized modules, trusses and solar panels.
It truly is a feat of human ingenuity.
But did you know that the International Space Station is one of the brightest objects in the night sky? And it’s easy to see if you know when, and where, to look.
In fact, with your ability to find the station you can amaze your friends and neighbours.
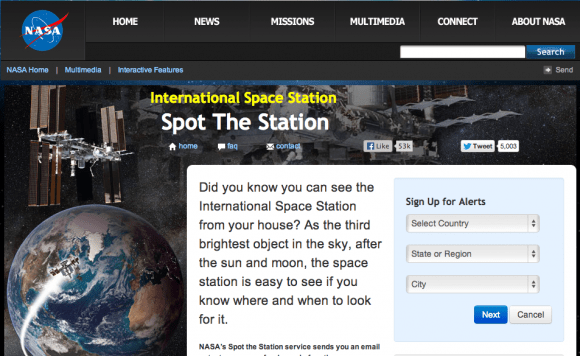
NASA’s Spot the Station WebsiteThe best place to start is NASA’s Spot the Station website. Enter your Country, Region, City along with an email address or mobile phone number. Then give your preference for notifications in the evening, morning or both and that’s it.
About twelve hours before the station is due to fly overhead, you’ll get a notification from NASA. Depending on your location, you might get notified a couple of times a week, or as rarely as once a month. As soon as you get the notification, create an alarm on your phone for about a minute before the flyover.
When the alarm goes off, take your friends outside and look to the West.
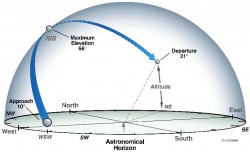
Station’s path across the skyThe station orbits the Earth from West to East, so you’ll see it appear on the Western horizon as a very bright star, moving rapidly across the sky. It will take only few minutes to cross the entire sky.
The station moves so quickly if you’re using a telescope you will have a tough time tracking its movement. A nice pair of binoculars will make it look a lot brighter, and even let you see the H-shape of its solar panels. But even viewing it with the naked eye is a great experience.
NASA’s website is just one of the many ways you can get notifications.
@twisstIf you use Twitter, follow @twisst. They can figure out your location and then send you a notification when the station is about to fly overhead via Twitter.
There are also dozens of Android and iPhone apps that will perform this function; many of which are free to use.
If you’ve never seen the station, head on over to NASA and set up a notification right away.
Then kick back and let orbital mechanics bring the station to your backyard at a time that’s convenient for you.
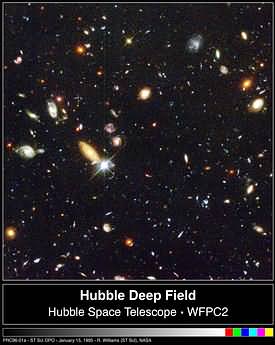
“Hubble: Galaxies Across Space and Time” is an award-winning IMAX Super Short film. In less than 3 minutes you can explore 10 billion years of cosmic history as you fly through one of Hubble’s iconic images, the Hubble Deep Field. These galaxies were photographed by the Hubble Space Telescope as part of the Great Observatory Origins Deep Survey (GOODS) project. Hubble scientists and imaging specialists worked for months to extract individual galaxy images, placing them in a 3-D model according to their approximate true distances.
If you ever have the chance to see the big screen version of “Hubble 3-D IMAX,” do it. It’s an incredible cinematic view that portrays the immensity and gloriousness of our Universe like no other film I’ve seen. You can read my review of it here.
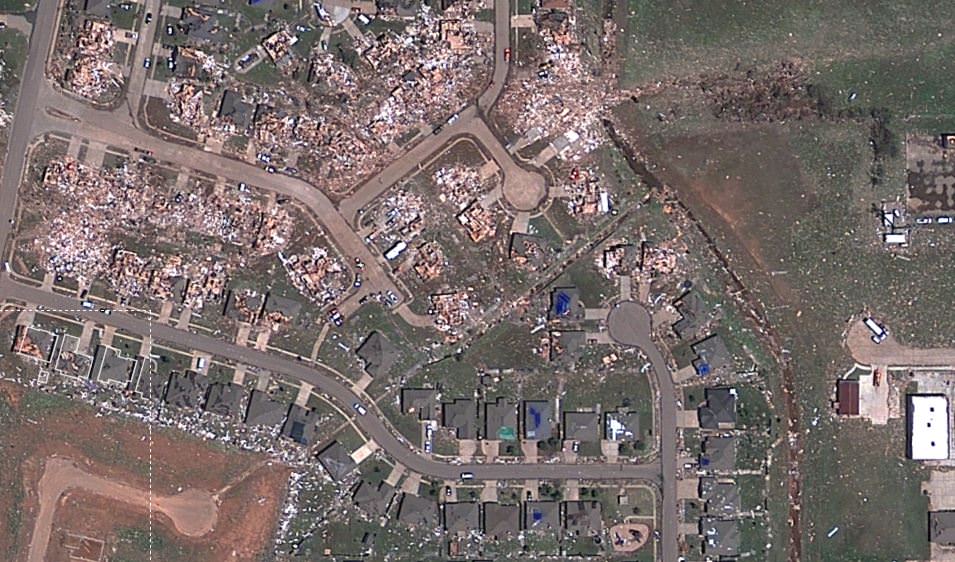
Sceenshot of a satellite view from Google/Digital Globe of the destruction in Moore, Oklahoma after the May 20, 2013 tornado. Click image to have access to an interactive, zoomable version via NPR.
A new satellite map from Google and Digital Globe shows just-released satellite imagery of the damage from the tornado that struck the area of Moore, Oklahoma on May 20, 2013. It’s been called one of the most powerful and destructive tornadoes ever recorded — determined to be an EF5 tornado, the strongest rating for a tornado — and the destruction is heartbreaking. In the screenshot above, you can see how some houses were left undamaged, while others were completely destroyed.
Click on the image above to have access to an interactive map that shows hi-resolution views of the damage, providing details of where the buildings and houses once were. NPR put this map together, using satellite data from Digital Globe, along with property data from City of Oklahoma City, City of Moore, and Cleveland County. Satellite data like this are helping to assist the recovery and rescue teams on the ground.
In the immediate aftermath of a natural catastrophe such as this tornado, the priority is searching for survivors and saving lives.
But longer term recovery — including the rebuilding of infrastructure and amenities such as schools and hospitals — can take decades, and satellite imagery can provide a systematic approach to aiding, monitoring and evaluating this process.
Satellite view of the destructive tornado that passed just south of Oklahoma City. The Moderate Resolution Imaging Spectroradiometer (MODIS) on NASA’s Aqua satellite acquired this image of the storm at 2:40 p.m. local time (19:40 UTC) on May 20, 2013. Credit: NASA image courtesy Jeff Schmaltz, LANCE/EOSDIS MODIS Rapid Response Team at NASA GSFC.
The Take Part website has a list of organizations that are providing support for the recovery and care of the people affected, if you would like to contribute.
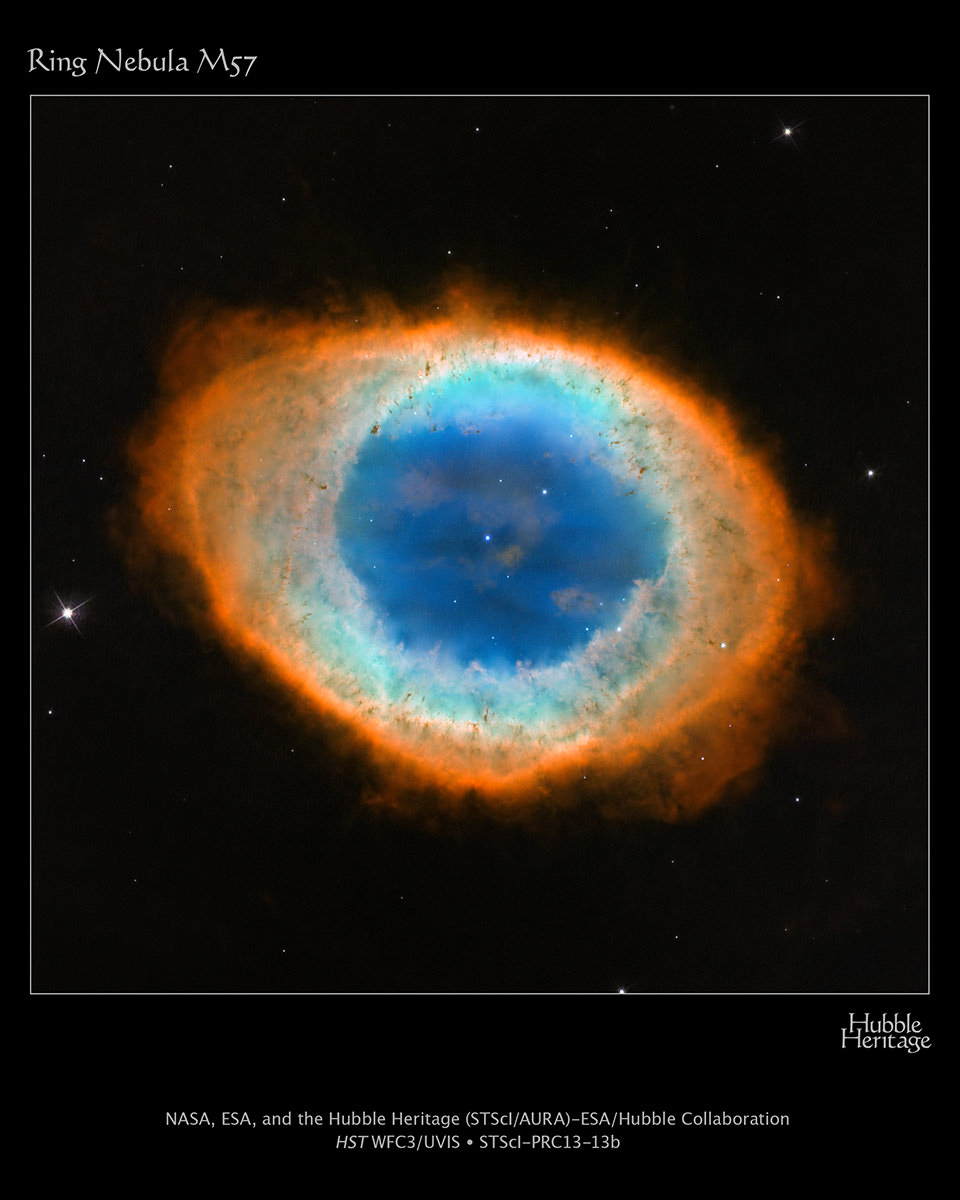
Hubble Space Telescope view of the Ring Nebula. Credit: NASA, ESA, and the Hubble Heritage (STScI/AURA)-ESA/Hubble Collaboration
Sometimes the popular names given to an astronomical object hit the mark of describing its features. Other times…. not so much. Case in point, the Ring Nebula. While the distinctive loop shape and colorful beauty have made it one of the most famous celestial discs, it is not really a classic “ring.” And this recent image from the Hubble Space Telescope shows an amazing new level of detail in this iconic nebula.
“The nebula is not like a bagel, but rather, it’s like a jelly doughnut, because it’s filled with material in the middle,” said C. Robert O’Dell of Vanderbilt University, who led a research team that used Hubble and several ground-based telescopes to obtain the best view yet of the Ring nebula. The images show a more complex structure than astronomers once thought and have allowed them to construct the most precise 3-D model of the nebula.
“With Hubble’s detail, we see a completely different shape than what’s been thought about historically for this classic nebula,” O’Dell said. “The new Hubble observations show the nebula in much clearer detail, and we see things are not as simple as we previously thought.”
The Ring Nebula is about 2,000 light-years from Earth and measures roughly 1 light-year across. Located in the constellation Lyra, the nebula is a popular target for amateur astronomers.
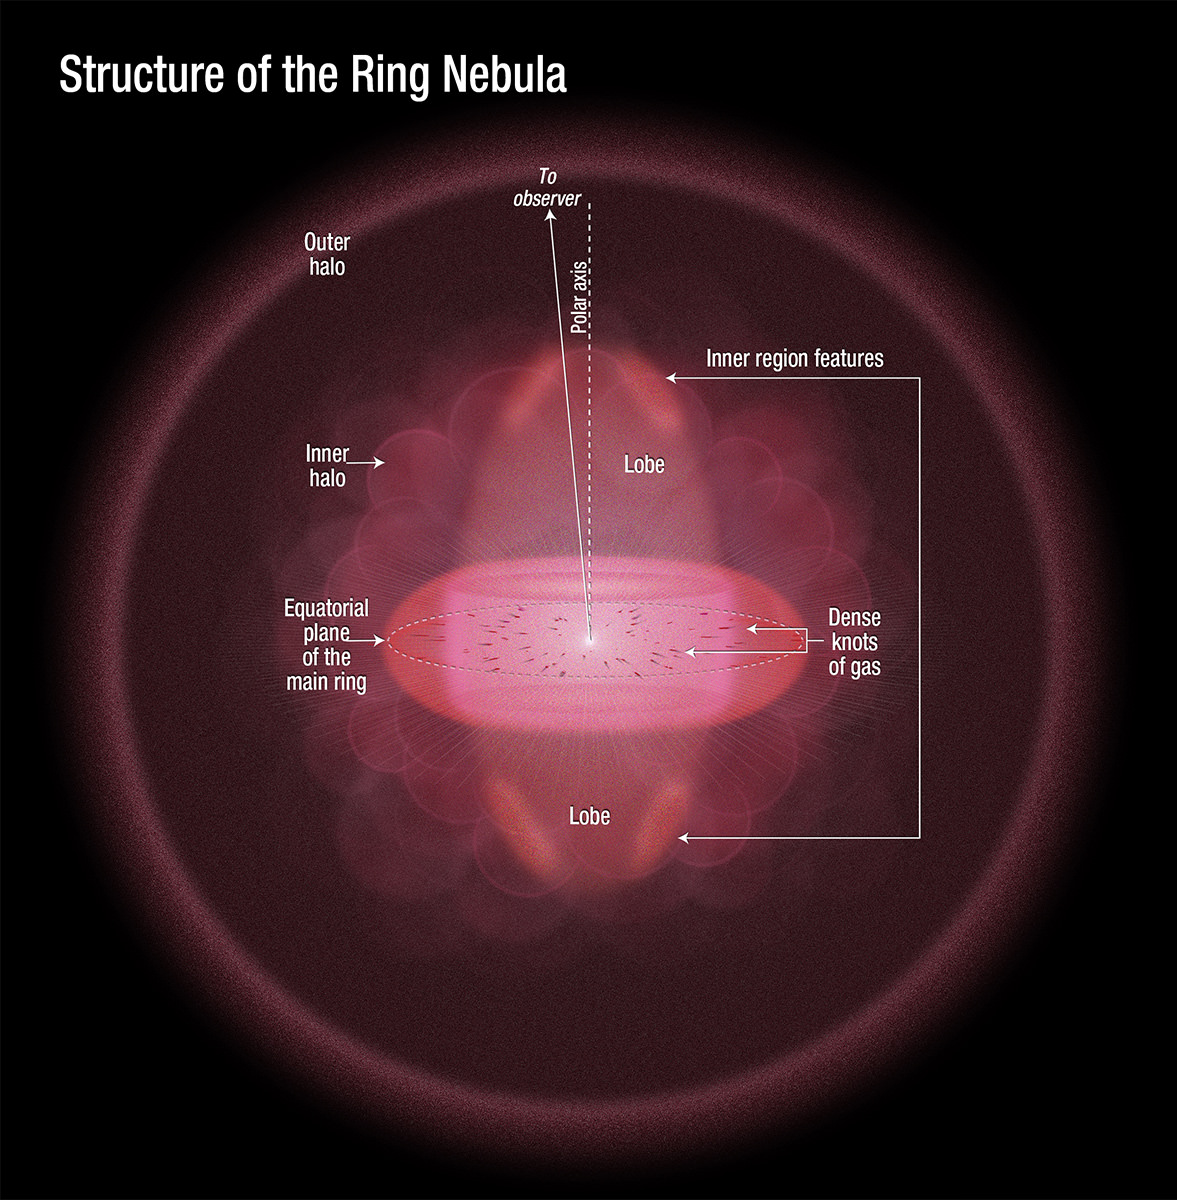
Previous observations by several telescopes had detected the gaseous material in the ring’s central region. But the new view by Hubble’s Wide Field Camera 3 shows the nebula’s structure in more detail. O’Dell’s team suggests the ring wraps around a blue, football-shaped structure. Each end of the structure protrudes out of opposite sides of the ring.
This video zooms into the constellation Lyra to the location of the Ring Nebula and the new image from the Hubble Space Telescope and the Large Binocular Telescope:
In the analysis, the research team also obtained images from the Large Binocular Telescope at the Mount Graham International Observatory in Arizona and spectroscopic data from the San Pedro Martir Observatory in Baja California, Mexico.
The nebula is tilted toward Earth so that astronomers see the ring face-on. In the Hubble image, the blue structure is the glow of helium. Radiation from the white dwarf star, the white dot in the center of the ring, is exciting the helium to glow. The white dwarf is the stellar remnant of a sun-like star that has exhausted its hydrogen fuel and has shed its outer layers of gas to gravitationally collapse to a compact object.
O’Dell’s team was surprised at the detailed Hubble views of the dark, irregular knots of dense gas embedded along the inner rim of the ring, which look like spokes in a bicycle wheel. These gaseous tentacles formed when expanding hot gas pushed into cool gas ejected previously by the doomed star. The knots are more resistant to erosion by the wave of ultraviolet light unleashed by the star. The Hubble images have allowed the team to match up the knots with the spikes of light around the bright, main ring, which are a shadow effect. Astronomers have found similar knots in other planetary nebulae.
This illustration depicts a sideways view of the Ring Nebula, as deduced by astronomers using new Hubble observations. Credit: NASA, ESA, and A. Feild (STScI)
All of this gas was expelled by the central star about 4,000 years ago. The original star was several times more massive than our sun. After billions of years converting hydrogen to helium in its core, the star began to run out of fuel. It then ballooned in size, becoming a red giant. During this phase, the star shed its outer gaseous layers into space and began to collapse as fusion reactions began to die out. A gusher of ultraviolet light from the dying star energized the gas, making it glow.
The outer rings were formed when faster-moving gas slammed into slower-moving material. The nebula is expanding at more than 43,000 miles an hour, but the center is moving faster than the expansion of the main ring. O’Dell’s team measured the nebula’s expansion by comparing the new Hubble observations with Hubble studies made in 1998.
The Ring Nebula will continue to expand for another 10,000 years, a short phase in the lifetime of the star. The nebula will become fainter and fainter until it merges with the interstellar medium.
Studying the Ring Nebula’s fate will provide insight into the sun’s demise in another 6 billion years. The sun is less massive than the Ring Nebula’s progenitor star, so it will not have an opulent ending.
“When the sun becomes a white dwarf, it will heat more slowly after it ejects its outer gaseous layers,” O’Dell said. “The material will be farther away once it becomes hot enough to illuminate the gas. This larger distance means the sun’s nebula will be fainter because it is more extended.”
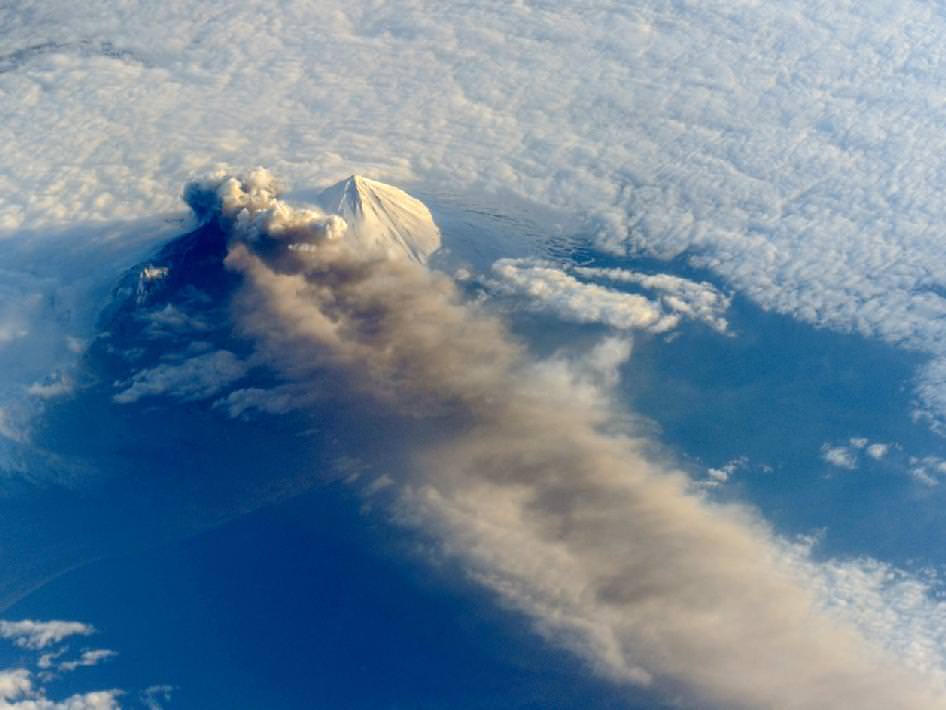
The Pavlof Volcano in Alaska on May 18, 2013. The oblique perspective from the ISS reveals the three dimensional structure of the ash plume, which is often obscured by the top-down view of most remote sensing satellites. Credit: NASA
The Pavlof Volcano began erupting on May 13, 2013, shooting lava into the air and spewing an ash cloud 20,000 feet (6,000 meters) high. This image from the International Space Station was taken on May 18, and provides a unique oblique (sideways) glance at the action. When the photograph was taken, the space station was about 475 miles south-southeast of the volcano (49.1° North latitude, 157.4° West longitude). The volcanic plume extended southeastward over the North Pacific Ocean.
NASA says the oblique perspective reveals the three dimensional structure of the ash plume, which is usually not visible from the top-down views of most remote sensing satellites.
If the volcano keeps erupting and spewing ash at those heights, it could interfere with airline traffic. Pavlov is one of the most frequently erupting volcanoes in the Aleutian arc. It last erupted in August of 2007; it previously had not been active since 1996.
There’s more information — and an impressive set of ground-based images — on the Pavlov Volcano at the Alaska Volcano Observatory website, and here’s a helicopter video of the eruption:
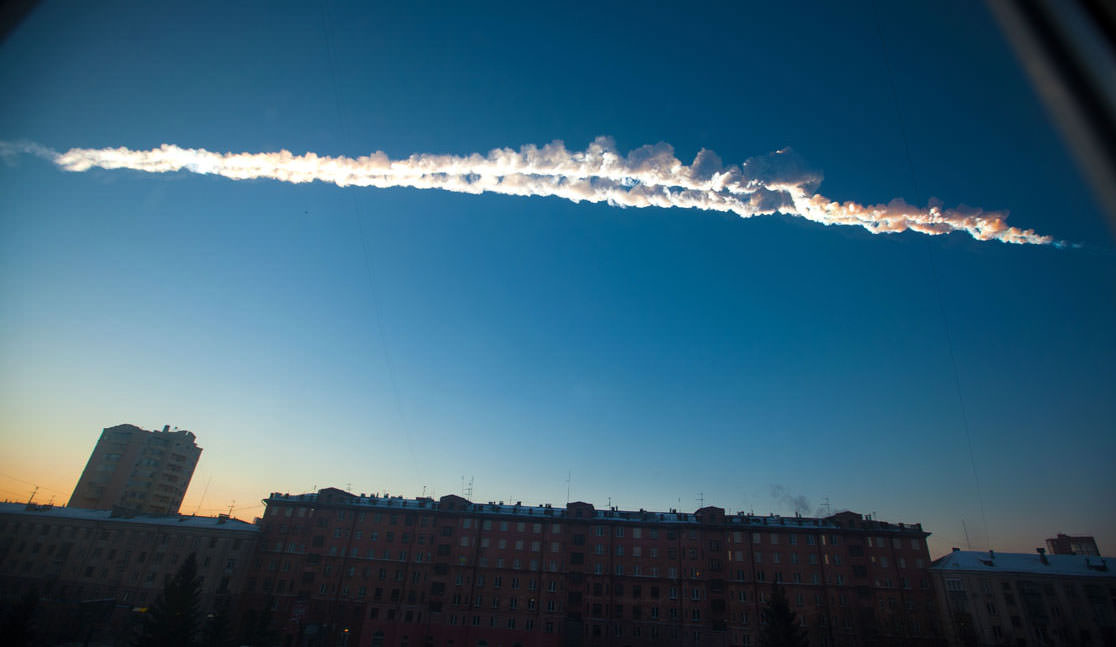
The two main smoke trails left by the Russian meteorite as it passed over the city of Chelyabinsk. Credit: AP Photo/Chelyabinsk.ru
It’s been about three months since that infamous meteor broke up over Chelyabinsk, Russia. In that time, there’s been a lot of conversation about how we can better protect ourselves against these space rocks with a potentially fatal (from humanity’s perspective) gravitational attraction to Earth.
This week, the European Space Agency officially inaugurated a “NEO Coordination Centre” that is intended to be asteroid warning central in the European Union. It will be the hub for early warnings on near-Earth objects (hence the ‘NEO’ in the name) under ESA’s space situational awareness program.
ESA estimates that of the 600,000 asteroids and comets that orbit the Sun, about 10,000 of them are NEOs. (They define NEOs as asteroids or comets with sizes of several feet up to several tens of miles.)
NASA, of course, is also gravely concerned about the threat NEOs present. Its administrator, Charles Bolden, talked about this at a Congressional hearing about asteroids in March.
Before delving into the threat, Bolden took a metaphorical deep breath to talk about the dozens of asteroids — a meter or larger — that slam into Earth’s atmosphere each year. Most of them burn up harmlessly, and further, 80 tons of dust-like material rain on Earth daily.
A notable meteor that did cause some damage took place about 100 years ago, in 1908, when an object broke up over an isolated area in Russia and flattened trees for miles. Bolden characterized that as a statistically one-in-a-thousand year event, but added that the “real catch” is this type of event could happen at any time.
NASA, however, is seeking out those that cause a threat. It is supposed to find 90 per cent of asteroids 140 meters or larger by 2020, and is making progress towards that goal. (By comparison, the Chelyabinsk object was estimated at 17 to 20 meters.)
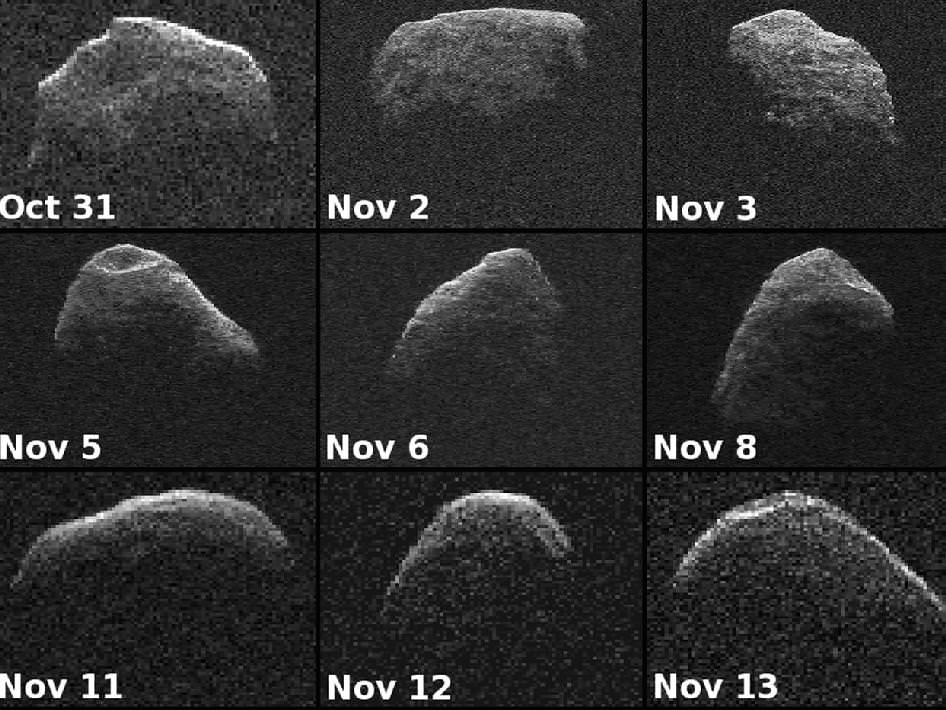
Nine radar images of near-Earth asteroid 2007 PA8 obtained between by NASA’s 230-foot-wide (70-meter) Deep Space Network antenna. The part of the asteroid closest to the antenna is at top. Credit: NASA/JPL-Caltech
So how to best monitor the threat? Bolden outlined a few ideas: crowdsourcing, coordinating with other federal agencies and making use of automatic feeds from different telescopes throughout the world (as NASA does right now.)
Bolden emphasized that none of the asteroids we have found is on a collision course with the Earth. Still, NASA and other science experts are not complacent.
In the same hearing, John Holdren — the president’s assistant on science and technology — recommended following a National Academy of Sciences report to spend upwards of $100 million a year on asteroid detection and characterization. To mitigate the threat, Holdren further recommended a visit to an asteroid by 2025, which would perhaps cost $2 billion.
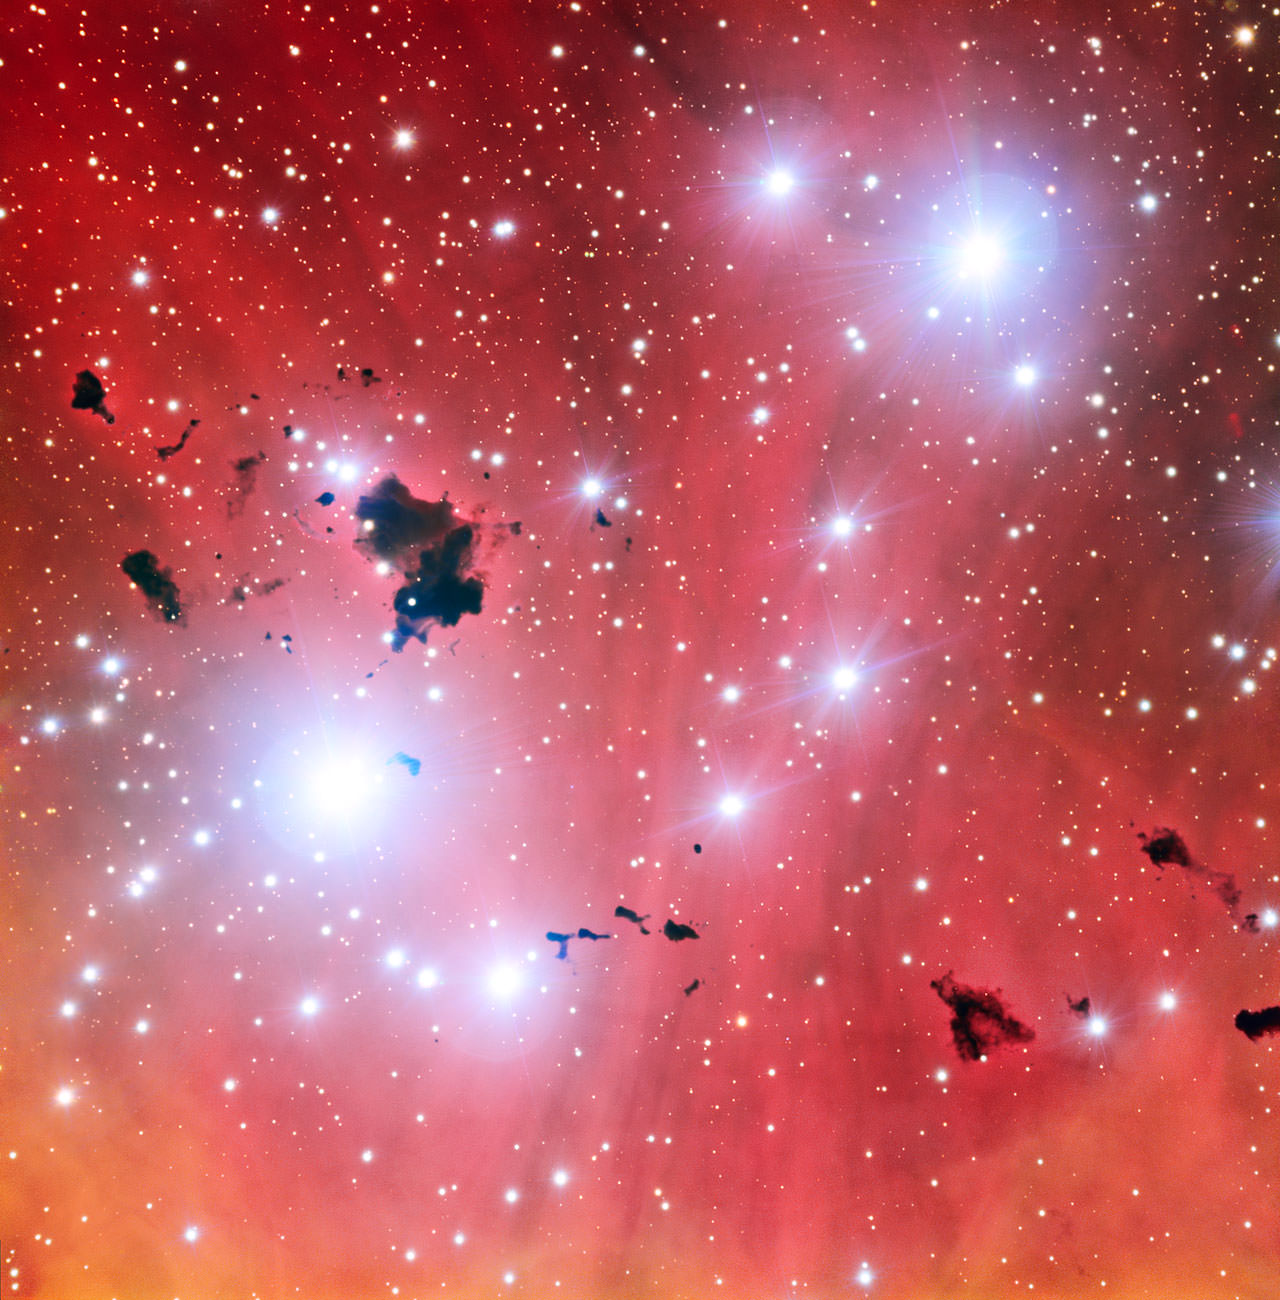
A new view of the spectacular stellar nursery IC 2944 (ESO)
This Saturday will mark 15 years that the European Southern Observatory’s Very Large Telescope (VLT) first opened its eyes on the Universe, and ESO is celebrating its first-light anniversary with a beautiful and intriguing new image of the stellar nursery IC 2944, full of bright young stars and ink-black clouds of cold interstellar dust.
This is the clearest ground-based image yet of IC 2944, located 6,500 light-years away in the southern constellation Centaurus.
Emission nebulae like IC 2944 are composed mostly of hydrogen gas that glows in a distinctive shade of red, due to the intense radiation from the many brilliant newborn stars. Clearly revealed against this bright backdrop are mysterious dark clots of opaque dust, cold clouds known as Bok globules. They are named after Dutch-American astronomer Bart Bok, who first drew attention to them in the 1940s as possible sites of star formation. This particular set is nicknamed the Thackeray Globules.
Larger Bok globules in quieter locations often collapse to form new stars but the ones in this picture are under fierce bombardment from the ultraviolet radiation from nearby hot young stars. They are both being eroded away and also fragmenting, like lumps of butter dropped into a hot frying pan. It is likely that Thackeray’s Globules will be destroyed before they can collapse and form stars.
This new picture celebrates an important anniversary for the the VLT – it will be fifteen years since first light on the first of its four Unit Telescopes on May 25, 1998. Since then the four original giant telescopes have been joined by the four small Auxiliary Telescopes that form part of the VLT Interferometer (VLTI) – one of the most powerful and productive ground-based astronomical facilities in existence.
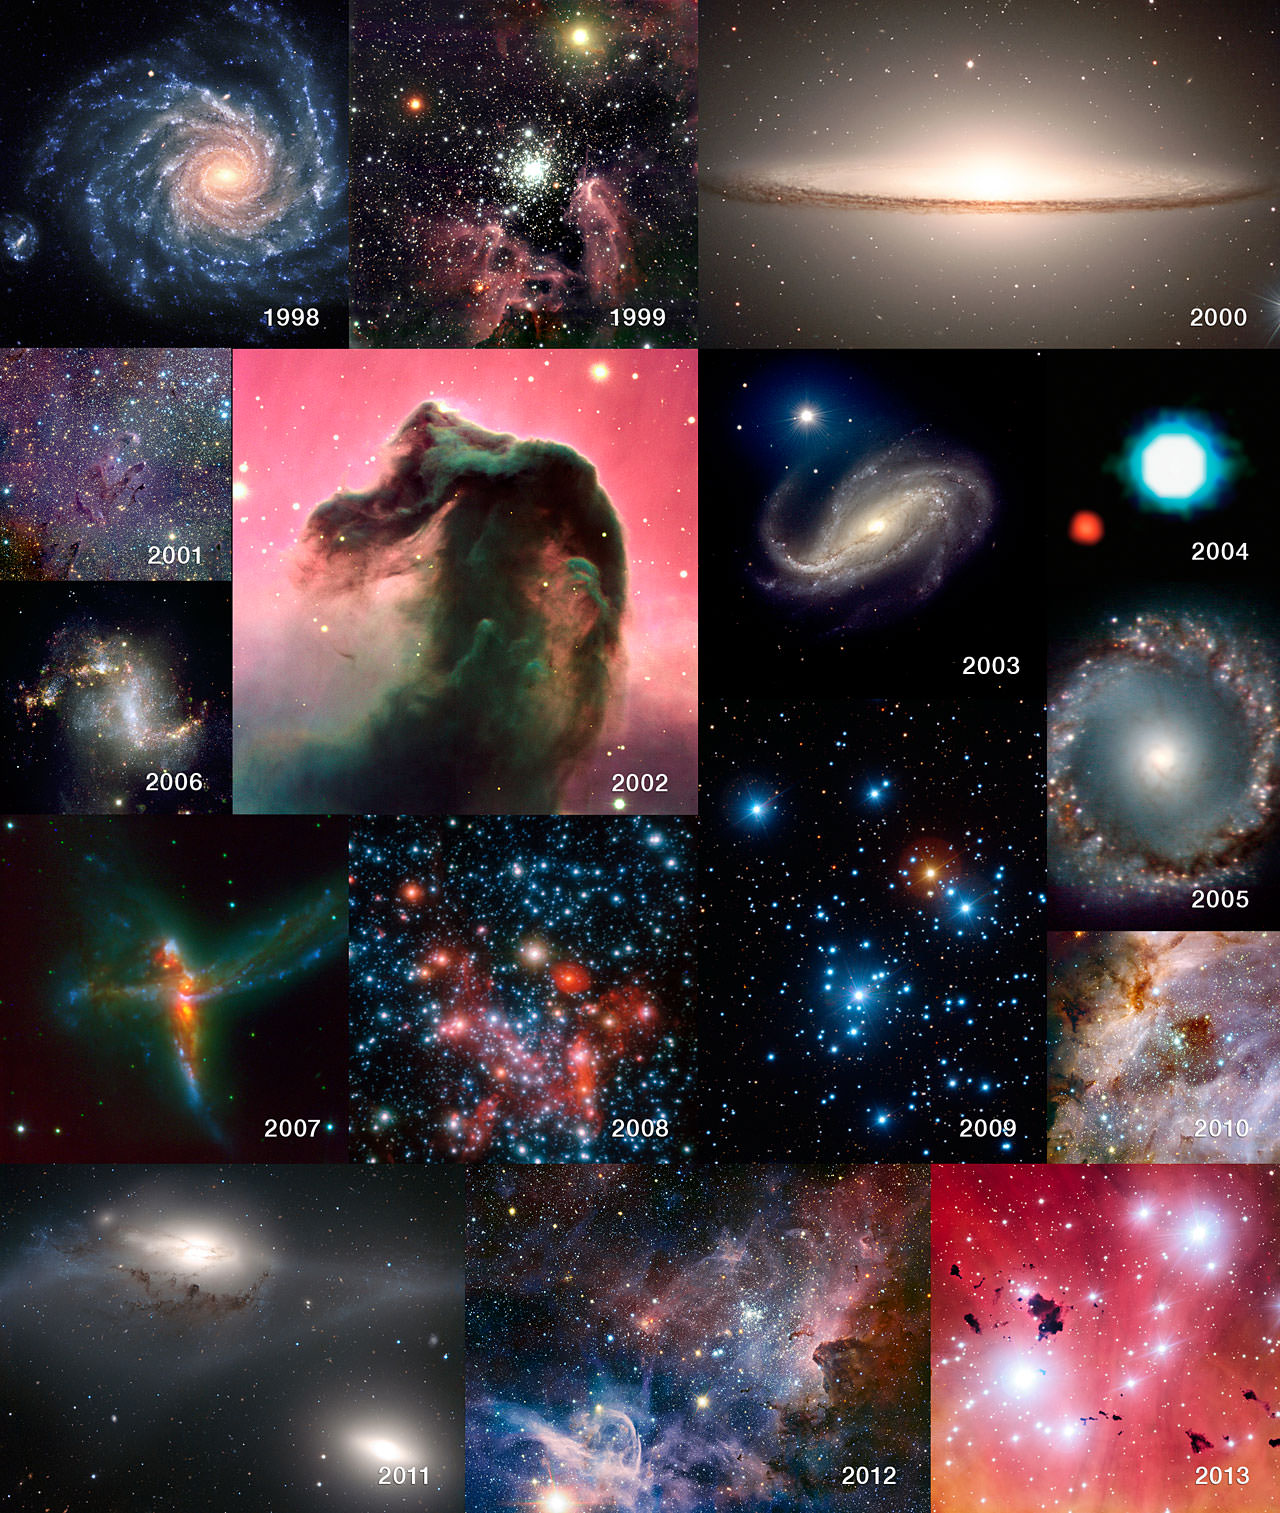
The selection of images below — one per year — gives a taste of the VLT’s scientific productivity since first light in 1998:
A selection of images from 15 years of the VLT (Credits: ESO/P.D. Barthel/M. McCaughrean/M. Andersen/S. Gillessen et al./Y. Beletsky/R. Chini/T. Preibisch)
Read more on the ESO site here, and watch an ESOCast video below honoring the VLT’s fifteen-year milestone:
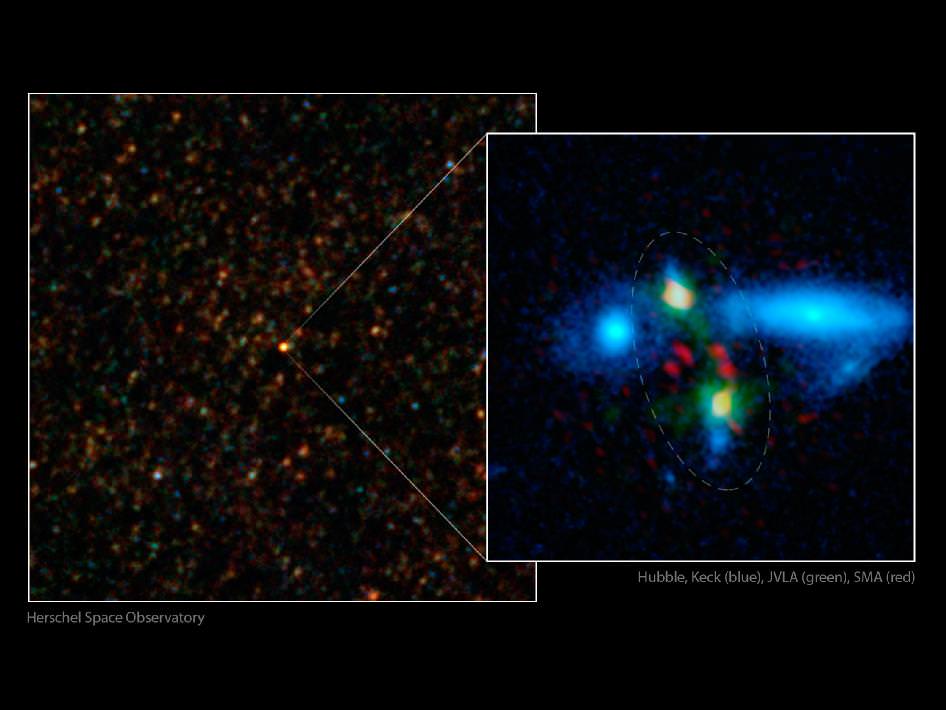
A rare and massive merging of two galaxies that took place when the Universe was just 3 billion years old.
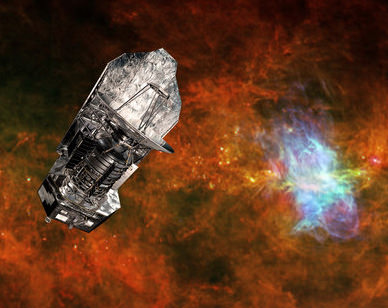
Even though the spacecraft has exhausted its supply of liquid helium coolant necessary to observe the infrared energy of the distant Universe, data collected by ESA’s Herschel space observatory are still helping unravel cosmic mysteries — such as how early elliptical galaxies grew so large so quickly, filling up with stars and then, rather suddenly, shutting down star formation altogether.
Now, using information initially gathered by Herschel and then investigating closer with several other space- and ground-based observatories, researchers have found a “missing link” in the evolution of early ellipticals: an enormous star-sparking merging of two massive galaxies, caught in the act when the Universe was but 3 billion years old.
It’s been a long-standing cosmological conundrum: how did massive galaxies form in the early Universe? Observations of distant large elliptical galaxies full of old red stars (and few bright, young ones) existing when the Universe was only a few billion years old just doesn’t line up with how such galaxies were once thought to form — namely, through the gradual accumulation of many smaller dwarf galaxies.
But such a process would take time — much longer than a few billion years. So another suggestion is that massive elliptical galaxies could have been formed by the collision and merging of large galaxies, each full of gas, dust, and new stars… and that the merger would spark a frenzied formation of even more stars.
Investigation of a bright region first found by Herschel, named HXMM01, has identified such a merger of two galaxies, 11 billion light-years distant.
The enormous galaxies are linked by a bridge of gas and each has a stellar mass of about 100 billion Suns — and they are spawning new stars at the incredible rate of about 2,000 a year.
“We’re looking at a younger phase in the life of these galaxies — an adolescent burst of activity that won’t last very long,” said Hai Fu of the University of California at Irvine, lead author of a new study describing the results.
ESA’s Herschel telescope used liquid helium to keep cool while it observed heat from the early UniverseHidden behind vast clouds of cosmic dust, it took the heat-seeking eyes of Herschel to even spot HXMM01.
“These merging galaxies are bursting with new stars and completely hidden by dust,” said co-author Asantha Cooray, also of the University of California at Irvine. “Without Herschel’s far-infrared detectors, we wouldn’t have been able to see through the dust to the action taking place behind.”
Herschel first spotted the colliding duo in images taken with longer-wavelength infrared light, as shown in the image above on the left side. Follow-up observations from many other telescopes helped determine the extreme degree of star-formation taking place in the merger, as well as its incredible mass.
The image at right shows a close-up view, with the merging galaxies circled. The red data are from the Smithsonian Astrophysical Observatory’s Submillimeter Array atop Mauna Kea, Hawaii, and show dust-enshrouded regions of star formation. The green data, taken by the National Radio Astronomy Observatory’s Very Large Array, near Socorro, N.M., show carbon monoxide gas in the galaxies. In addition, the blue shows starlight.
Although the galaxies in HXMM01 are producing thousands more new stars each year than our own Milky Way does, such a high star-formation rate is not sustainable. The gas reservoir contained in the system will be quickly exhausted, quenching further star formation and leading to an aging population of low-mass, cool, red stars — effectively “switching off” star formation, like what’s been witnessed in other early ellipticals.
Dr. Fu and his team estimate that it will take about 200 million years to convert all the gas into stars, with the merging process completed within a billion years. The final product will be a massive red and dead elliptical galaxy of about 400 billion solar masses.
The study is published in the May 22 online issue of Nature.
Read more on the ESA Herschel news release here, as well as on the NASA site here. Also, check out an animation of the galactic merger below:
Main image credit: ESA/NASA/JPL-Caltech/UC Irvine/STScI/Keck/NRAO/SAO
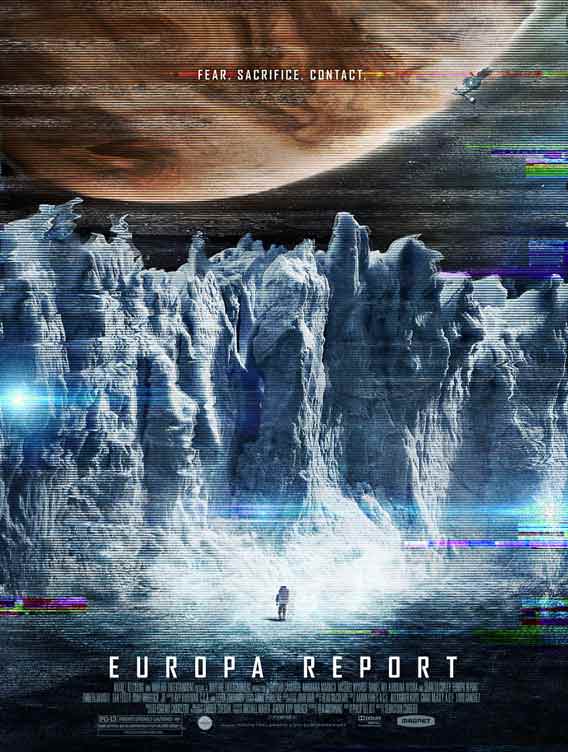
Europa Report was a 2013 film that focused on a human mission to the Jovian moon. Poster by Start Motion Pictures.
The producers of a new movie called “Europa Report” have released a new trailer about their film, which features a near-future mission to Jupiter’s moon, Europa, in search of extraterrestrial life. From the trailer, the film looks to be of extremely high quality, and it stars Sharlto Copley (District 9), with music score from composer Bear McCreary (Battlestar Galactica, Eureka).
And while this is a sci-fi flick, the makers of “Europa Report” say they have steeped it in real science. JPL scientists acted as advisers on the film, and it’s been called “One of the most thrilling and realistic depictions of deep-space exploration since ‘Moon’ and ‘2001: A Space Odyssey’” by Space.com
Enjoy the trailer below.
The film will be released on for download on June 27th and theatrically on August 2nd through Magnolia Pictures. The premiere showing of the film will be in the Hayden Planetarium at the American Museum of Natural History on August 1st.
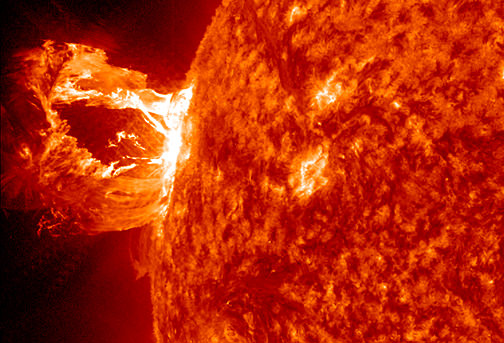
In this image, the Solar Dynamics Observatory (SDO) captured an X1.2 class solar flare, peaking on May 15, 2013. Credit: NASA/SDO
What’s more fun than something that misbehaves? When it comes to solar dynamics, we know a lot, but there are many things we don’t yet understand. For example, when a particle filled solar flare lashes out from the Sun, its magnetic field lines can do some pretty unexpected things – like split apart and then rapidly reconnect. According to the flux-freezing theorem, these magnetic lines should simply “flow away in lock-step” with the particles. They should stay intact, but they don’t. It’s not just a simple rule they break… it’s a law of physics.
What can explain it? In a paper published in the May 23 issue of “Nature”, an interdisciplinary research team led by a Johns Hopkins mathematical physicist may just have found a plausible explanation. According to the group, the underlying factor is turbulence – the “same sort of violent disorder that can jostle a passenger jet when it occurs in the atmosphere” – or the one your brother leaves behind after he’s eaten baked beans. By employing a well-organized and logically constructed computer modeling technique, the researchers were able to simulate what happens when magnetic field lines meet up with turbulence in a solar flare. Armed with this information, they were then able to state their case.
“The flux-freezing theorem often explains things beautifully,” said Gregory Eyink, a Department of Applied Mathematics and Statistics professor who was lead author of the “Nature” study. “But in other instances, it fails miserably. We wanted to figure out why this failure occurs.”
Just what is the flux-freezing theorem? Maybe you’ve heard of Hannes Alfvén. He was a Swedish electrical engineer, plasma physicist and winner of the 1970 Nobel Prize in Physics for his work on magnetohydrodynamics (MHD). He’s the man responsible for explaining what we now know as Alfvén waves – a low-frequency travelling oscillation of the ions and the magnetic field in plasma. Well, some 70 years ago, he came up with the thought that magnetic lines of force sail along a locomotive fluid similar to snippets of thread flowing along a stream. It should be impossible for them to break and then join again. However, solar physicists have discovered this just isn’t the case when it comes to activity within a particularly violent solar flare. In their observations, they have determined that the magnetic field lines within these flares can stretch to the breaking point and then reconnect in a surprisingly quick amount of time – as little as 15 minutes. When this happens, it expels a copious amount of energy which, in turn, powers the flare.
“But the flux-freezing principle of modern plasma physics implies that this process in the solar corona should take a million years!” Eyink animatedly states. “A big problem in astrophysics is that no one could explain why flux-freezing works in some cases but not others.”
Of course, there has always been speculation that turbulence may have been the root source of the enigmatic behavior. Time for investigation? You bet. Eyink then joined forces – and minds – with other experts in astrophysics, mechanical engineering, data management and computer science, based at Johns Hopkins and other institutions. “By necessity, this was a highly collaborative effort,” Eyink said. “Everyone was contributing their expertise. No one person could have accomplished this.”
Gregory Eyink, professor of applied mathematics and statistics at Johns Hopkins. Photo by Nat Creamer.The next step was to create a computer simulation – a simulation which could duplicate the plasma state of solar flare activity and all the nuances the charged particles undergo during different conditions. “Our answer was very surprising,” stated Eyink. “Magnetic flux-freezing no longer holds true when the plasma becomes turbulent. Most physicists expected that flux-freezing would play an even larger role as the plasma became more highly conducting and more turbulent, but, as a matter of fact, it breaks down completely. In an even greater surprise, we found that the motion of the magnetic field lines becomes completely random. I do not mean ‘chaotic,’ but instead as unpredictable as quantum mechanics. Rather than flowing in an orderly, deterministic fashion, the magnetic field lines instead spread out like a roiling plume of smoke.”
Of course, other solar experts feel there may be alternative answers for this rule-breaking activity within solar flares, but as Eyink says, “I think we made a pretty compelling case that turbulence alone can account for field-line breaking.”
What is most exciting is the collaborative effort of the team members from such widely varied disciplines. It was a group effort which aided Eyink to come up with this new theory on the solar flare riddle. “We used ground-breaking new database methods, like those employed in the Sloan Digital Sky Survey, combined with high-performance computing techniques and original mathematical developments,” he said. “The work required a perfect marriage of physics, mathematics and computer science to develop a fundamentally new approach to performing research with very large datasets.”
In conclusion, Eyink noted this type of research work may very well give us a better understanding of solar flares and coronal mass ejections. As we know, this type of dangerous “space weather” can be harmful to astronauts, disrupt communications satellites, and even be responsible for the shut-down of electrical power grids on Earth. And you know what that means… no satellite TV and no power to watch it by. But, that’s O.K.
“I don’t stay out late. Don’t care to go. I’m home about eight… Just me and my radio. Ain’t misbehavin’.. Savin’ my love for you.”